. 2024 Sep 6;10(36):eadn2321.
doi: 10.1126/sciadv.adn2321. Epub 2024 Sep 4.

AAGGG repeat expansions trigger RFC1-independent synaptic dysregulation in human CANVAS neurons

Affiliations

AAGGG repeat expansions trigger RFC1-independent synaptic dysregulation in human CANVAS neurons

Connor J Maltby et al. Sci Adv. .

Abstract

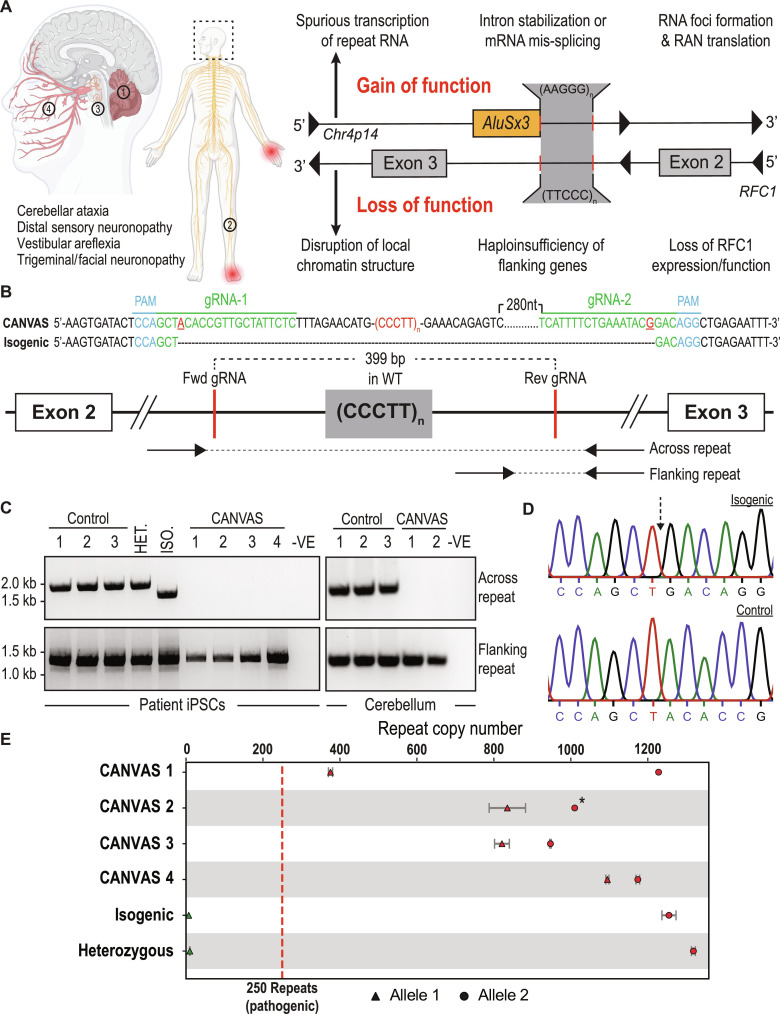
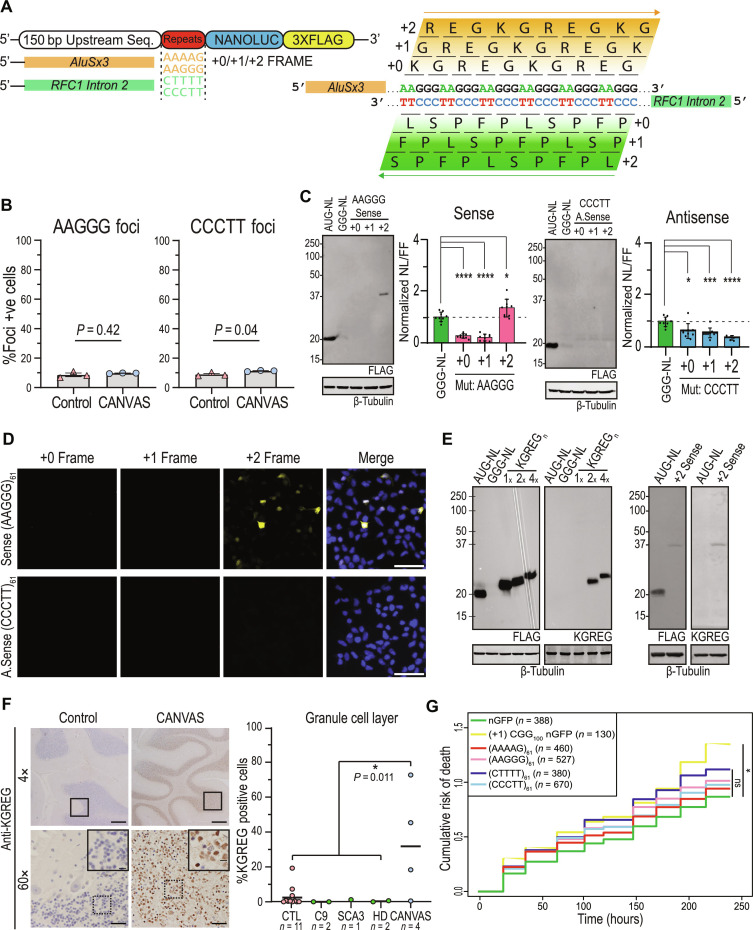
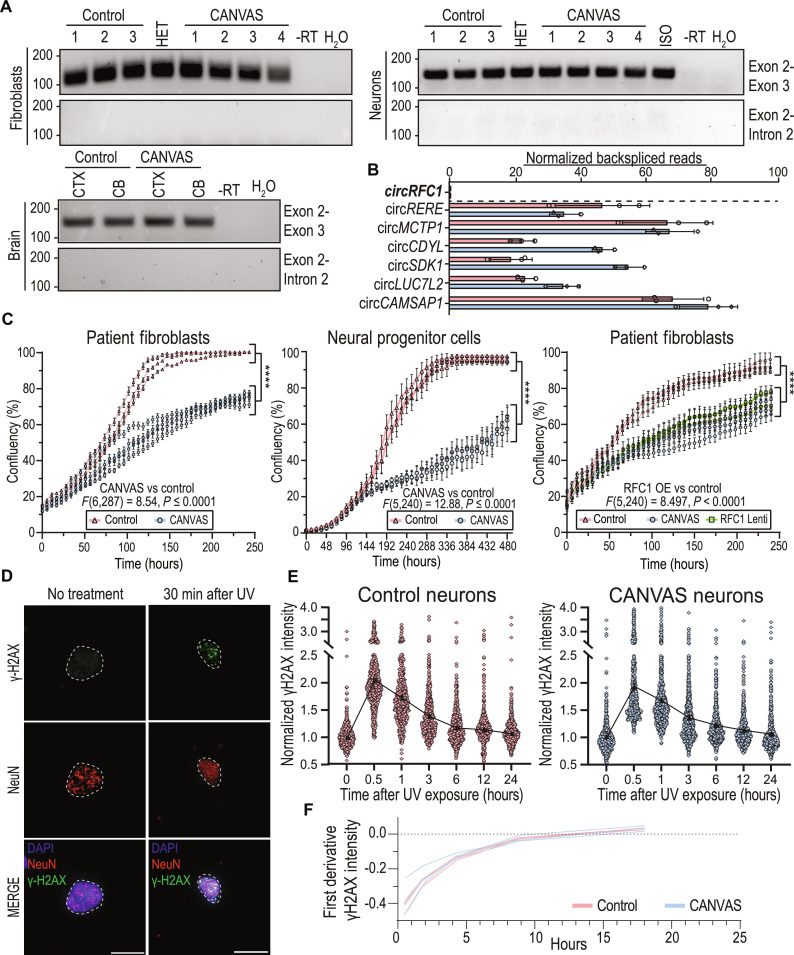
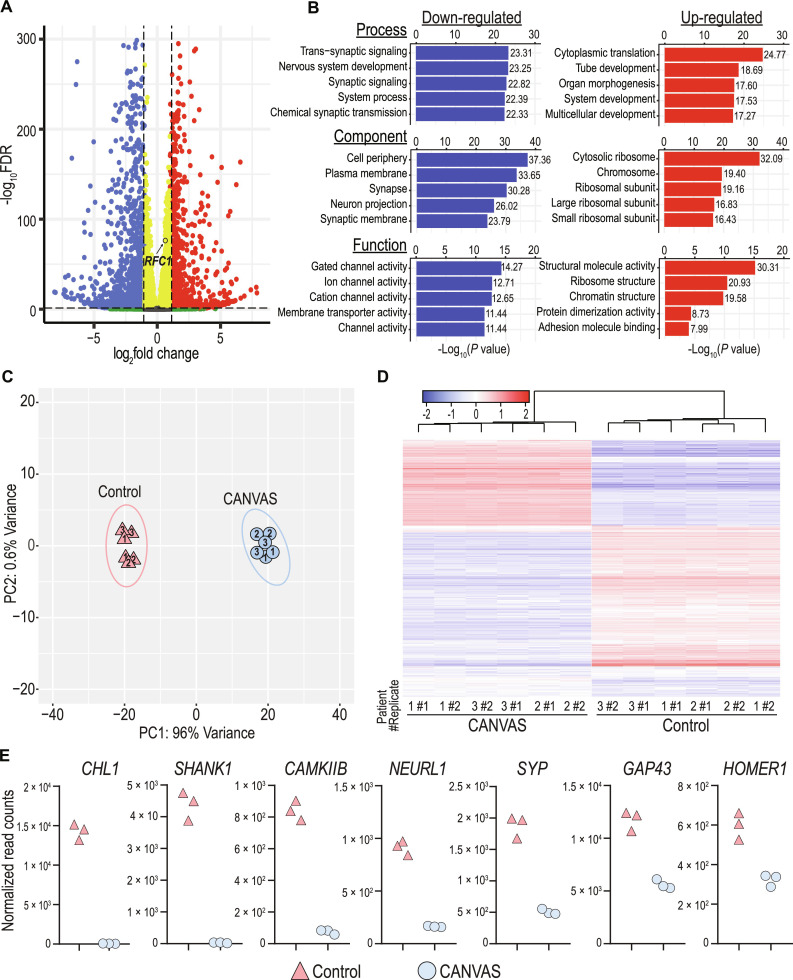
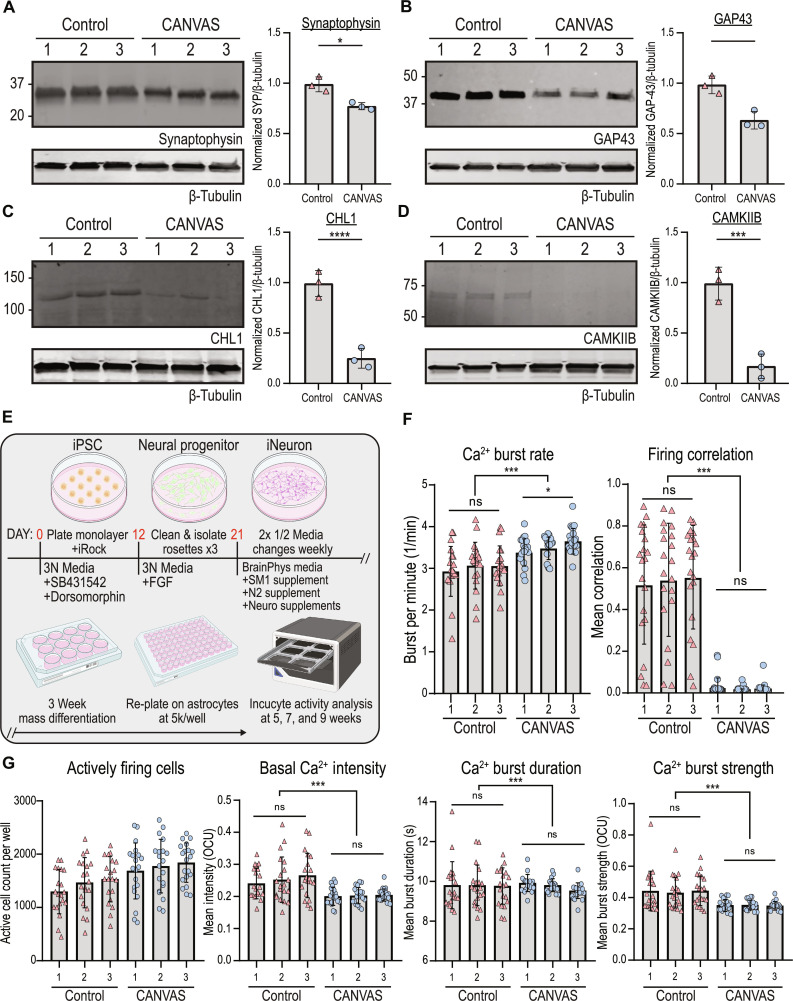
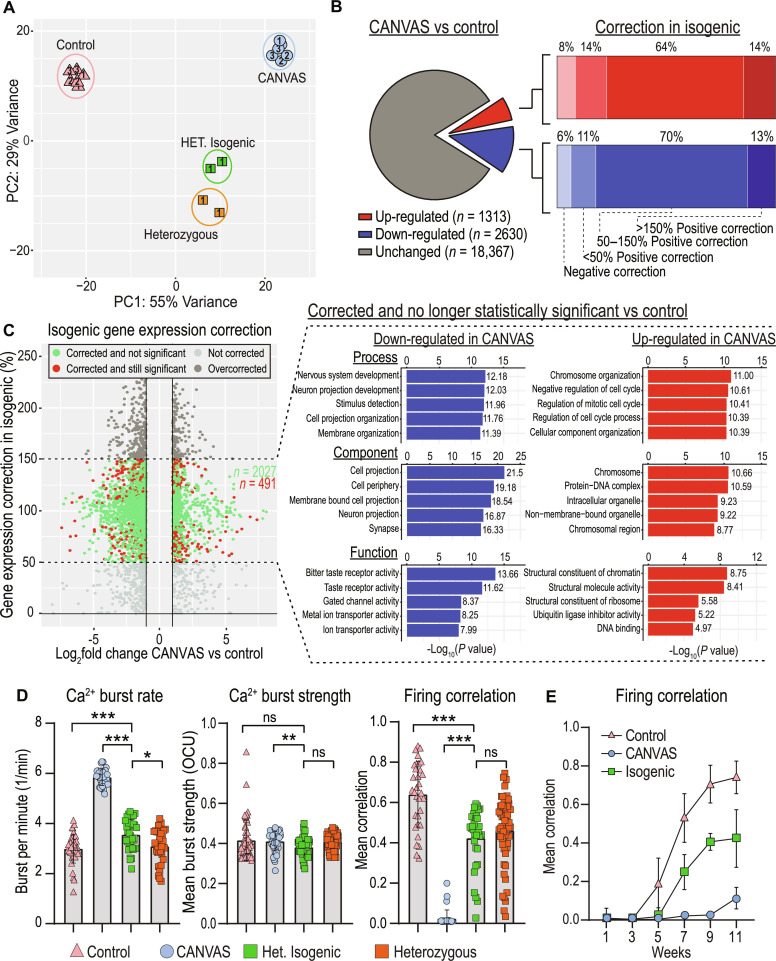
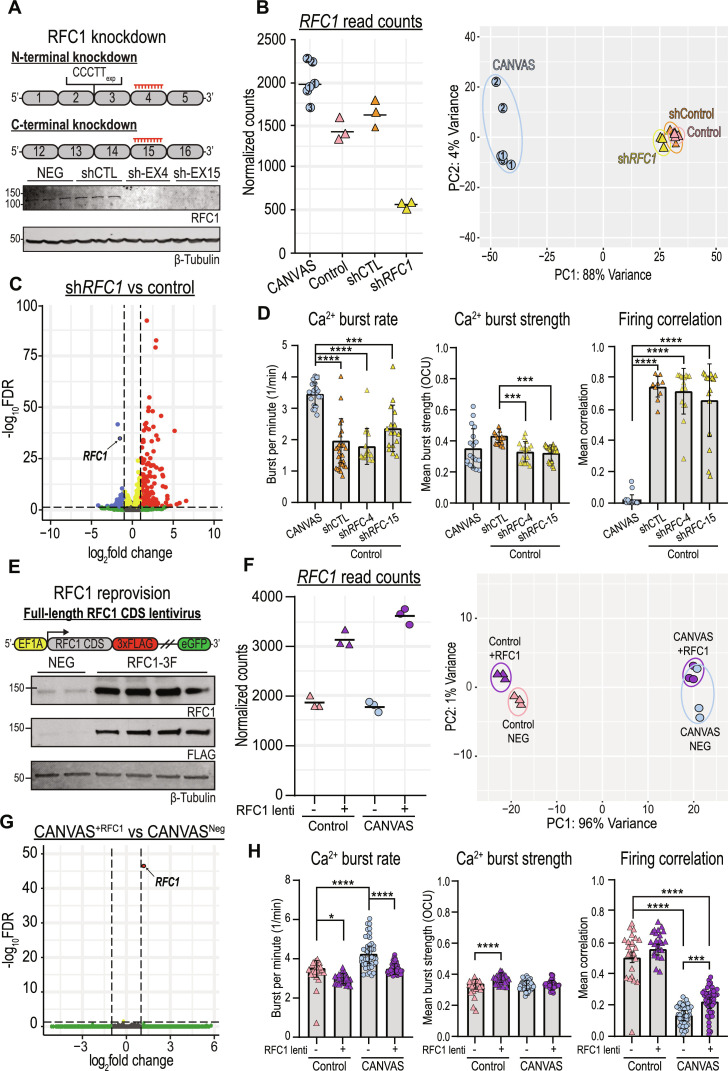
Cerebellar ataxia with neuropathy and vestibular areflexia syndrome (CANVAS) is a recessively inherited neurodegenerative disorder caused by intronic biallelic, nonreference CCCTT/AAGGG repeat expansions within RFC1. To investigate how these repeats cause disease, we generated patient induced pluripotent stem cell-derived neurons (iNeurons). CCCTT/AAGGG repeat expansions do not alter neuronal RFC1 splicing, expression, or DNA repair pathway function. In reporter assays, AAGGG repeats are translated into pentapeptide repeat proteins. However, these proteins and repeat RNA foci were not detected in iNeurons, and overexpression of these repeats failed to induce neuronal toxicity. CANVAS iNeurons exhibit defects in neuronal development and diminished synaptic connectivity that is rescued by CRISPR deletion of a single expanded AAGGG allele. These deficits were neither replicated by RFC1 knockdown in control iNeurons nor rescued by RFC1 reprovision in CANVAS iNeurons. These findings support a repeat-dependent but RFC1 protein-independent cause of neuronal dysfunction in CANVAS, with implications for therapeutic development in this currently untreatable condition.


Figures

Fig. 1.
Fig. 1.. Repeat characterization and heterozygous correction of CANVAS patient–derived iPSC lines.
(A) Schematic of brain, central and peripheral nervous system regions affected in CANVAS (left), and potential mechanisms of repeat toxicity in CANVAS (right). (B) Repeat architecture of the expanded locus and CRISPR gRNA design to remove the AAGGG/CCCTT repeat expansion by nonhomologous end joining (NHEJ). (C) Endpoint PCR of gDNA extracted from CANVAS patient– and control-derived iPSC lines and CANVAS and control cerebellum tissue utilizing the primer pair outlined in (B) to screen for the presence of WT repeat, mutant repeat expansion, or deletion of expanded repeat. (D) Chromatogram of Sanger sequencing identifying AAGGG/CCCTT allele deletion in heterozygous isogenic line indicating the expected NHEJ join point compared to the control iPSC line. (E) Schematic outlining the repeat copy number per allele for each of the patient-derived iPSC lines used as identified by Oxford Nanopore gDNA targeted long-read sequencing. Green, sub-pathogenic repeat length; Red, pathogenic repeat length. Error bars indicate confidence in exact copy number calls. The “*” indicates lower boundary for repeat copy number from the longest read observed due to the absence of reads spanning the full repeat.
Fig. 2.
Fig. 2.. Translated AAGGG repeat products are detected in brains of patients with CANVAS.
(A) Schematic of potential peptide products from sense and antisense strand of the repeat expansion locus. (B) Quantification of foci positive neurons for control (n = 3) and CANVAS (n = 3) patient iPSC-derived neurons (1100 to 2000 cells per group per probe). n = 2 biological replicates from three independent patient-derived cell lines. Representative confocal images are shown in fig. S2B. (C) Immunoblot from HEK293 cells expressing plasmids encoding intronic sense or antisense AAGGG/CCCTT repeat reporters in the +0/+1/+2 reading frames (left) and Nano-luciferase expression assay quantification (right). n = 7 biological replicates. Data were analyzed by one-way ANOVA with Sidak’s post hoc multiple comparison tests. (D) ICC of HEK293 cells transfected with plasmids encoding intronic sense or antisense AAGGG/CCCTT repeat reporters with C-terminal triple tags in the +0/+1/+2 reading frames. (E) Expression analysis of lysates from HEK293 cells transfected with control plasmid +2 Sense (AAGGG)61 plasmid using anti-FLAG M2 (1:1000) and anti-KGREG (1:100) antibodies (left). (F) Left: IHC of control and RFC1 expansion CANVAS patient postmortem cerebellar vermis tissue stained with sense anti-KGREG antibody (1:100, acid AR). Scale bars, 500 μm (4×), 50 μm (60×), and 20 μm (inset). Right: Rater blinded quantification of all 20 postmortem tissues (tissue images and quantification for each sample in fig. S4). (G) Cumulative hazard plot for rat cortical neurons expressing CGG100 (positive control) or CANVAS intronic expression plasmids containing 61 repeats of the indicated type over 10 days. Results from eight technical replicates/three biological replicates; n = numbers of cells assessed per condition. ns, not significant. *hazard ratio = 1.339, P = 0.025, Cox proportional hazards analysis.
Fig. 3.
Fig. 3.. Canonical functions and expression of RFC1 are normal in cells derived from patients with CANVAS.
(A) Endpoint RT-PCR utilizing primer sets spanning RFC1 exon 2–exon 3 or exon 2–intron 2 in CANVAS fibroblasts (top, left), iPSC-derived neurons (top, right), and CANVAS postmortem brain (bottom, left). (B) Quantification of normalized circular back-spliced read counts for RFC1 and other known circRNA species in CANVAS patient iPSC–derived neurons by paired-end RNA-seq analysis. (C) Ten-day time-course analysis of the rate of cellular division and proliferation in CANVAS (n = 4) and control (n = 3) fibroblast lines (left, F6,287 = 8.54, P < 0.0001), CANVAS (n = 3) and control (n = 3) NPC lines (center, F5,240 = 12.88, P < 0.0001), and CANVAS fibroblast lines (n = 3) mock-treated or treated with RFC1 overexpression lentivirus (right, F5,240 = 2.358, P = 0.245). n = 3 biological replicates from three to four independent patient cell lines. Data were analyzed by one-way ANOVA with Sidak’s post hoc multiple comparison tests. (D and E) Analysis of recovery after discrete UV exposure and DNA damage in CANVAS patient iPSC–derived neurons. (D) Representative images of γ-H2AX staining of iPSC-derived neurons before and after 60 mJ/cm2 UV exposure (scale bar, 10 μm). (E) Quantification of mean γ-H2AX staining in CANVAS patient (n = 3) and control (n = 3) iPSC–derived NeuN+ neuronal nuclei over a 24-hour period after 60 mJ/cm2 UV exposure (n = 16,569 NeuN+ nuclei total). Data were analyzed by one-way ANOVA with post hoc multiple comparison tests. (F) First-derivative DNA damage recovery rate curves for CANVAS (n = 3) and control (n = 3) patient iPSC–derived neurons. Error = SD.
Fig. 4.
Fig. 4.. Synaptic genes are down-regulated in CANVAS neurons.
(A) Volcano plot of differentially expressed genes in CANVAS patient versus control iPSC–derived neurons, blue = significantly down-regulated, red = significantly up-regulated, RFC1 labeled. (B) Gene Ontology (GO) pathway analysis of the top five up-/down-regulated biological process, cellular component, and molecular function in CANVAS (n = 3) versus control (n = 3) patient iPSC–derived neurons. (C) Principal components analysis (PCA) of CANVAS (n = 3) versus control (n = 3) patient iPSC–derived neurons, patient number indicated within shapes identify technical replicates. (D) Heatmap of normalized expression for the top 1000 genes differentially expressed in CANVAS patient versus control iPSC–derived neurons. (E) Normalized gene counts for the top seven down-regulated synaptic-associated genes in CANVAS patient versus control iPSC–derived neurons.
Fig. 5.
Fig. 5.. CANVAS patient–derived neurons exhibit synaptic dysfunction and reduced connectivity.
(A to D) Protein expression (left) and normalized quantification (right) of selected synaptic genes identified as down-regulated in CANVAS patient iPSC–derived neurons by transcriptomic analysis: (A) synaptophysin, (B) GAP43, (C) CHL1, and (D) CAMKIIB. n = 3 per group. Data were analyzed by one-way ANOVA with Sidak’s post hoc multiple comparison tests. (E) Schematic outlining experimental workflow for generating patient iPSC–derived neurons for calcium imaging analysis. (F) Analysis of Ca2+ imaging metrics for control (n = 3) and CANVAS (n = 3) patient iPSC–derived neurons at 9 weeks after differentiation. Burst rate (F5,114 = 8.268, P < 0.0001) and firing correlation (F5,114 = 45.62, P < 0.0001). (G) Analysis of Ca2+ imaging metrics for control (n = 3) and CANVAS (n = 3) patient iPSC–derived neurons. Basal intensity (F5,114 = 7.075, P < 0.0001), burst duration (F5,114 = 0.5371, P = 0.745), and burst strength (F5,114 = 7.573, P < 0.0001). Each data point represents the mean of ~1000 to 3000 active cells per well. Data were analyzed by one-way ANOVA with Sidak’s post hoc multiple comparison tests. Error = SD.
Fig. 6.
Fig. 6.. Heterozygous isogenic correction of CANVAS neurons corrects transcriptomic and synaptic functional deficits.
(A) PCA of CANVAS (n = 3), control (n = 3), heterozygous (n = 1), and CANVAS heterozygous isogenic (n = 1) patient iPSC–derived neurons. Patient number indicated within shapes identify technical replicates. (B) Schematic illustrating the total number of genes dysregulated (up and down) in CANVAS versus control (left), with the percentage of these up- or down-dysregulated genes that show negative correction, partial correction, or full correction of expression upon heterozygous isogenic correction of CANVAS patient iPSC–derived neuron line. (C) Scatter plot of Log2FoldChange (CANVAS versus control) versus gene expression correction per gene in the heterozygous isogenic patient iPSC–derived neurons (left), and GO pathway analysis of the top five up-/down-regulated biological process, cellular component, and molecular function for the genes that show 50 to 150% gene expression in isogenic correction versus CANVAS and are nonstatistically significant in isogenic versus control conditions. (D) Analysis of Ca2+ imaging metrics for control (n = 3), CANVAS (n = 3), heterozygous (n = 1), and heterozygous isogenic (n = 1) patient iPSC–derived neurons. Burst rate (F2,165 = 279.4, P < 0.0001), burst strength (F2,165 = 4.034, P = 0.019), and firing correlation (F2,165 = 185.9, P < 0.0001). Each data point represents the mean of ~1000 to 3000 active cells per well (fig. S8). Data were analyzed by one-way ANOVA with Sidak’s post hoc multiple comparison tests. (E) Mean firing correlation of control (n = 3), CANVAS (n = 3), and heterozygous isogenic (n = 1) patient iPSC–derived neurons across 10 weeks of differentiation from week 1 to week 11. Error = SD.
Fig. 7.
Fig. 7.. Altering RFC1 expression neither recapitulates nor corrects CANVAS patient neuron dysfunction.
(A) Schematic of RFC1 knockdown using RFC1 N or C terminus targeting shRNA lentiviruses (top) and RFC1 expression after knockdown in control iPSC–derived neurons (bottom). (B) Normalized read counts for RFC1 transcripts (left) and PCA (right) in CANVAS (n = 3), control (n = 3), control mock-treated (n = 3), and control shRFC1-treated (n = 3) patient iPSC–derived neurons. (C) Volcano plot of RFC1 knockdown versus control, RFC1 labeled. (D) Ca2+ imaging metrics of CANVAS (n = 3) and control (n = 3) patient iPSC–derived neurons treated with shControl or shRFC1 lentiviruses. Burst rate (F3,78 = 29.6, P < 0.0001), burst strength (F3,78 = 8.265, P < 0.0001), and firing correlation (F3,78 = 100.6, P < 0.0001). (E) Schematic of RFC1 overexpression in CANVAS patient iPSC–derived neurons (top) and analysis of RFC1 expression in patient iPSC–derived neurons upon lentiviral transduction (bottom). (F) Normalized read counts for RFC1 transcripts (left) and PCA of CANVAS and control iPSC–derived neurons transduced either full-length RFC1 CDS or control lentivirus (n = 3 per group) (right). (G) Volcano plot of CANVAS patient–derived neurons transduced with either full-length RFC1 CDS or control lentivirus (n = 3 per group), RFC1 labeled. (H) Ca2+ imaging metrics of control (n = 3) and CANVAS (n = 3) patient iPSC–derived neurons treated with control or RFC1-overexpression lentivirus. Burst rate (F3,135 = 31.01, P < 0.0001), burst strength (F3,135 = 16.74, P < 0.0001), and firing correlation (F3,135 = 147.3, P < 0.0001). Firing correlation two-way ANOVA treatment versus genotype: F1,135 = 41.25, P < 0.0001 and F1,135 = 36.64, P < 0.0001, respectively. Each data point represents the mean of ~1000 to 3000 active cells per well (fig. S5). Data were analyzed by one-way ANOVA with Sidak’s post hoc multiple comparison tests. Patient numbers indicated identify technical replicates. Error = SD.

Update of

References

    1. Cortese A., Curro' R., Vegezzi E., Yau W. Y., Houlden H., Reilly M. M., Cerebellar ataxia, neuropathy and vestibular areflexia syndrome (CANVAS): Genetic and clinical aspects. Pract. Neurol. 22, 14–18 (2022). - PubMed
    1. Szmulewicz D. J., Roberts L., McLean C. A., MacDougall H. G., Michael Halmagyi G., Storey E., Proposed diagnostic criteria for cerebellar ataxia with neuropathy and vestibular areflexia syndrome (CANVAS). Neurol. Clin. Pract. 6, 61–68 (2016). - PMC - PubMed
    1. Paisán-Ruiz C., Jen J. C., CANVAS with cerebellar/sensory/vestibular dysfunction from RFC1 intronic pentanucleotide expansion. Brain 143, 386–390 (2020). - PubMed
    1. Ishai R., Seyyedi M., Chancellor A. M., Lean C. A. M., Rodriguez M. L., Halmagyi G. M., Nadol J. B. Jr., Szmulewicz D. J., Quesnel A. M., The pathology of the vestibular system in CANVAS. Otol. Neurotol. 42, e332–e340 (2021). - PMC - PubMed
    1. Szmulewicz D. J., Roberts L., McLean C. A., MacDougall H. G., Chancellor A. M., Mossman S., Lamont D., Storey E., Halmagyi G. M., Clinico-pathological correlates in cerebellar ataxia with neuronopathy and vestibular areflexia syndrome (CANVAS). J. Neurol. Sci. 333, e632 (2013).

Publication types

MeSH terms

LinkOut - more resources