. 2024 Sep 6;10(36):eadn3259.
doi: 10.1126/sciadv.adn3259. Epub 2024 Sep 4.

Cerebrospinal fluid flow extends to peripheral nerves further unifying the nervous system

Affiliations

Cerebrospinal fluid flow extends to peripheral nerves further unifying the nervous system

Alexander P Ligocki et al. Sci Adv. .

Abstract

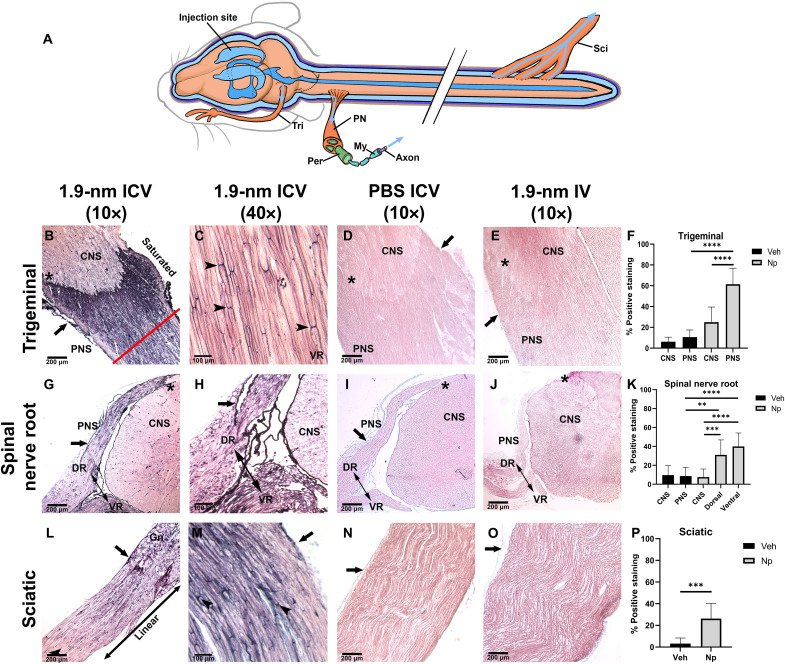
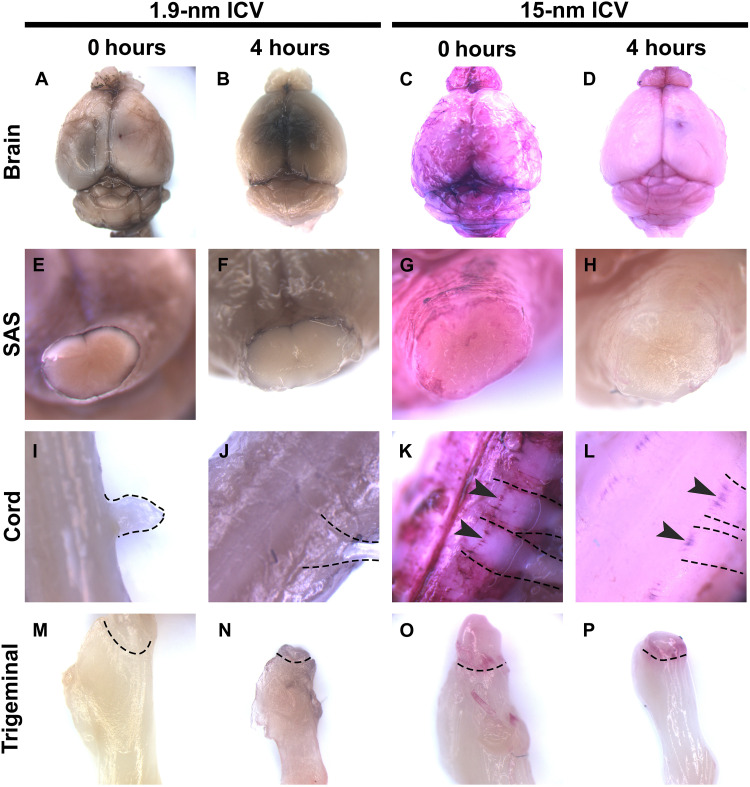
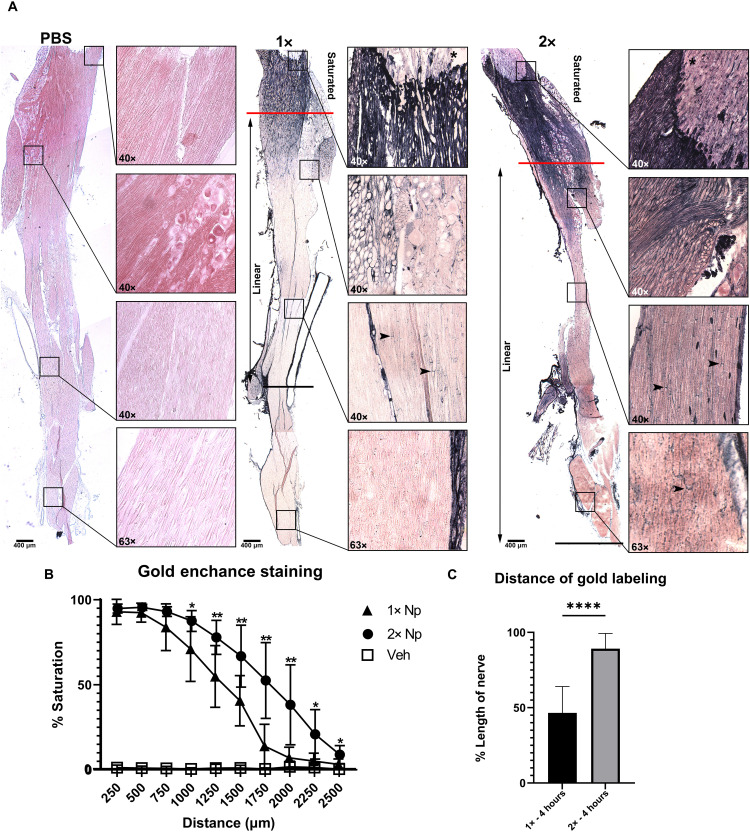
Cerebrospinal fluid (CSF) is responsible for maintaining brain homeostasis through nutrient delivery and waste removal for the central nervous system (CNS). Here, we demonstrate extensive CSF flow throughout the peripheral nervous system (PNS) by tracing distribution of multimodal 1.9-nanometer gold nanoparticles, roughly the size of CSF circulating proteins, infused within the lateral cerebral ventricle (a primary site of CSF production). CSF-infused 1.9-nanometer gold transitions from CNS to PNS at root attachment/transition zones and distributes through the perineurium and endoneurium, with ultimate delivery to axoplasm of distal peripheral nerves. Larger 15-nanometer gold fails to transit from CNS to PNS and instead forms "dye-cuffs," as predicted by current dogma of CSF restriction within CNS, identifying size limitations in central to peripheral flow. Intravenous 1.9-nanometer gold is unable to cross the blood-brain/nerve barrier. Our findings suggest that CSF plays a consistent role in maintaining homeostasis throughout the nervous system with implications for CNS and PNS therapy and neural drug delivery.


Figures

Fig. 1.
Fig. 1.. CSF-infused nanoprobe travels to peripheral nerves.
Peripheral nerves were collected 4 and 6 hours after infusion of nanoprobe (B, C, G, H, L, and M), IV infusion (E, J, and O), and ICV of PBS (D, I, and N). Sections from the trigeminal nerve [(B) to (E)], spinal cord [(G) to (J)], and sciatic nerve [(L) to (O)] were developed with GoldEnhance for visualization; enhanced gold appears as black precipitate. Average nanogold (Np) staining of PNS compared to the CNS and PBS (Veh) controls (F, K, and P). CNS-PNS transition is marked by “*” in all panels. (A) Schematic of established CSF reservoirs; peripheral nerve (PN), axon (Ax), myelin (My), perineurium (Peri), and endoneurium (Endo). [(B) and (C)] Trigeminal nerve 4 hours after nanoprobe injection. (B) Staining is enhanced at the CNS-PNS transition. Perineurium is demarcated by closed arrow in all panels; arrowheads mark nodes of Ranvier. (C) High magnification of trigeminal endoneurial staining. (D) PBS-injected control. (E) Trigeminal nerve from IV animal 6 hours after nanoprobe infusion. [(F) and (G)] Cervical spinal nerve roots (NR)(double-sided arrow) showing dorsal root (DR) and ventral root (VR) from nanoprobe-infused animals. Closed arrow marks the subarachnoid angle of the dorsal root. (G) High-magnification image of subarachnoid angle. (H) Spinal cord from PBS-injected control. (I) Spinal cord from IV-injected animal 6 hours postnanoprobe infusion. Sciatic nerve taken at the ganglion 4 hours after nanoprobe injection (L) and high magnification 6 hours after nanoprobe injection (M). (N) PBS-injected control sciatic nerve. (O) Sciatic nerve from IV-injected animal 6 hours after nanoprobe infusion. (**P < 0.01, ***P < 0.001, and ****P < 0.0001). Panels have a minimum N = 4.
Fig. 2.
Fig. 2.. Larger probe forms cuffing at CNS-PNS transitions.
Aurovist 1.9- or 15-nm probes were infused into the lateral cerebral ventricle of fully anesthetized mice. CNS and PNS tissues were harvested 0 hours or 4 hours after probe infusion and imaged without gold enhancement. Whole brains were imaged with 1.9 nm (A) 0 hours or (B) 4 hours postinfusion. Brains infused with 15-nm probe for (C) 0 hours or (D) 4 hours. SAS of the brain stem following 1.9-nm probe infusion for (E) 15 min or (F) 4 hours. The SAS of brainstems following 15-nm probe infusion of (G) 0 hours or (H) 4 hours. Spinal cords with protruding nerve roots from animals injected with 1.9 nm (I) 0 hours or (J) 4 hours postinfusion. Spinal cords with protruding nerve roots from animals injected with 15-nm nanoprobe (K) 0 hours or (L) 4 hours postinfusion. Dotted lines mark nerve roots. Arrowheads mark ink cuffs. Trigeminals (M) 0 hours or (N) 4 hours postinfusion of 1.9-nm nanoprobe. Trigeminals (O) 0 hours or (P) 4 hours after 15-nm nanoprobe infusion. Dotted lines mark ink cuffs. Panels have a minimum N = 3.
Fig. 3.
Fig. 3.. CSF flow route is dependent on probe size.
The 1.9- or 15-nm nanogold tracers were infused into the lateral cerebral ventricle of fully anesthetized mice. CNS and PNS tissues were harvested 15 min or 4 hours after probe infusion and processed with GoldEnhance. Coronal sections of brain from animals injected with 1.9 nm (A) 0 hours or (B) 4 hours postinfusion. Coronal sections of brain from animals injected with 15-nm nanoprobe (C) 15 min or (D) 4 hours postinfusion. Arrowheads mark positively staining brain tissue. Spinal cords from animals injected with 1.9 nm (E) 0 hours or (F) 4 hours postinfusion. Spinal cords with protruding nerve roots from animals injected with 15-nm nanoprobe (G) 0 hours or (H) 4 hours postinfusion. Arrowheads mark meninges. “*” marks CNS to PNS transition in all images. (I) Trigeminal nerve from 1.9-nm infused animals. High-magnification image of (J) dorsal nerve root and (K) ventral nerve root from (L). (L) Spinal nerve roots from 1.9-nm nanoprobe-infused animals. (M) Sciatic nerve from 1.9-nm nanoprobe-infused animal. (N to R) Peripheral nerves taken from animals 4 hours after 15-nm nanoprobe infusion. “*” marks CNS to PNS transition in all images. (N) Trigeminal nerve from 15-nm infused animals. High-magnification image of (O) dorsal nerve root and (P) ventral nerve root from (Q). (Q) Spinal nerve roots from 15-nm nanoprobe-infused animals. (R) Sciatic nerve from 15-nm nanoprobe-infused animal. Gn, ganglion. Panels have a minimum N = 3.
Fig. 4.
Fig. 4.. CSF flow of nanogold is concentration dependent.
The 1 mg (1×) and 2 mg (2×) of nanogold was infused into the lateral cerebral ventricle. Trigeminal nerves were harvested 4 hours after infusion and stained with gold enhancement for 20 min. The 5× images were placed together to show the distance of saturated staining (red line) [(A) and (B)]. The distance of CSF flow was determined by measuring the distance for the last nodal labeling seen from the transition marked by a black line [(A) and (C)]. The linear zone marks the decrease in concentration of nanoprobe from the end of the saturated zone to the last nodal labeling seen [(A) and (B)]. For each concentration, 40× and 63× inlays show representative staining at four distances. (A) PBS-infused nerves only exhibit background staining through the length of the nerve. (B) The saturated zone on 1× concentration nerves reaches approximately 750 μm from the transition, and the last nodal staining was seen on average halfway along the nerve. The saturated zone on 2× concentration nerves was on average 1000 μm from the transition. (C) Nodal staining was seen for the length of the 2× nerve. Unpaired t test was performed to determine statistical significance (*P < 0.05, **P < 0.01, and ****P < 0.0001) Panels have a minimum N = 4.
Fig. 5.
Fig. 5.. CSF flows through peripheral nerves in a time- and distance-dependent manner.
The 1.9-nm nanogold. Tracer was infused into cerebral lateral ventricle. CNS and PNS tissues were harvested 0, 2, 4, or 6 hours postinfusion, and then cryosections were GoldEnhanced. (A) Schematic of gold diffusion through central and PNS tissues; intensity of black is representative of relative amounts of nanogold and depicts progressive dilution of probe. (B to F) Trigeminal nerves from animals (B) 0 hours, (C) 2 hours, (D) 4 hours, or (E) 6 hours after nanoprobe injection. (G to K) Cervical spinal nerve roots of Aurovist-injected animals (G) 0 hours, (H) 2hours, (I) 4 hours, or (J) 6 hours postinjection; an “*” marks the transition from CNS to PNS in all panels. (L to P) Sciatic nerves of Aurovist-injected animals (L) 0 hours, (M) 2 hours, (N) 4 hours, or (O) 6 hours postinjection. Gn, ganglion. [(F), (K), and (P)] Average positive pixel density measured in trigeminal (F), spinal nerve root (K), and sciatic nerve (P) at each time point. (Q to T) Overall staining at each time point was quantified and compared in each tissue. Trigeminal nerve had the highest overall staining seen at each time point. Unpaired t test was performed to determine statistical significance (*P < 0.05, **P < 0.01, ***P < 0.001, and **** P < 0.0001). Panels have a minimum N = 4. ns, not significant.
Fig. 6.
Fig. 6.. CSF solute enters PNS at nerve RAZ.
The 1.9-nm nanogold tracer was infused into the lateral cerebral ventricle of fully anesthetized mice. CNS and PNS tissues were harvested (A) 0 hours or (B) 6 hours postinfusion and processed with GoldEnhance. (C) Schematic of CNS/PNS spinal junction with structures labeled as PM, pia mater; Ar, arachnoid mater; DM, dura mater; SA, subarachnoid angle; RS, root sheath; Endo, endoneurium/endoneurial region; Gn, ganglion.
Fig. 7.
Fig. 7.. CSF solute accumulates in PNS at CNS/PNS junction.
The 1.9-nm nanogold tracer was infused into the cerebral lateral ventricle. PNS tissues were collected at 0 hours, 2, 4, or 6 hours postinfusion, and then cryosections were GoldEnhanced. (A to D) Trigeminal nerves from animals (B) 0 hours, (C) 2 hours, (D) 4 hours, or (E) 6 hours after nanoprobe injection; gold accumulates at CNS-PNS transition as demarcated with red dotted line. (E to H) Low-magnification images of trigeminal nerves (E) 0 hours, (F) 2 hours, (G) 4 hours, or (H) 6 hours after nanoprobe injection. CNS to PNS junction is demarcated by “*.” (I to L) Dorsal thoracic nerve root from animals (I) 0 hours, (J) 2 hours, (K) 4 hours, or (L) 6 hours after nanoprobe injection after ventricular injection. Probe is concentrated in nerve roots. Closed arrow marks CNS meninges and PNS connective tissue coverings. (M to P) Ventral spinal nerves roots (M) 0 hours, (N) 2 hours, (O) 4 hours, or (P) 6 hours after nanoprobe injection. Nanogold is present within the endoneurium, revealing nodes of Ranvier (open arrowheads). Panels have a minimum N = 4.
Fig. 8.
Fig. 8.. Nanoprobe clearance is delayed in nanogold-injected animals.
CSF is thought to be effluxed from the CNS predominately through the lymphatic system with subsequent efflux to the vascular system; final clearance from the body occurs through excretion in the urinary system. To assess clearance of nanogold from the CSF, C57BL/6 mice were injected with 1.9-nm nanogold tracer (0.1 mg/μl) into the ICV (A to D), IV (E to H) through the tail vein, compared to animals injected with an equal volume of PBS into the lateral cerebral ventricle (I to L). Tissues were harvested at 6 hours postinfusion, cyrosectioned, and GoldEnhanced. (A) Lymph nodes (LN), (B) spleen [red pulp (RP) and white pulp (WP)], (C) kidney, and bladder (D) of tissues from ICV-infused animals. (E) Lymph nodes, (F) spleen, (G) kidney, and bladder (H) of tissues from IV-infused animals. (I) Lymph nodes, (J) spleen, (K) kidney, and bladder (L) of tissues from animals infused with PBS into lateral cerebral ventricle. Panels have a minimum N = 4.
Fig. 9.
Fig. 9.. Electron microscopy identifies CSF flows in the connective tissue coverings of peripheral nerves.
(A) Schematic of peripheral nerve (PN) that contains multiple fascicles enclosed by the perineurium (Per), which bundles multiple axons (Ax) and their surrounding Schwann cells (Sch); individual axons are located within the endoneurium (En). (B) Cross section of trigeminal nerve 4 hours after infusion of 2-mg gold nanoprobe into the cerebral lateral ventricle. Nanogold is visible as black particles in fibroblasts (white outline; arrow) within the perineurium of the trigeminal after gold enhancement; an adjacent a perineurial cell (black outline; open arrowhead) contains little gold. (C) Trigeminal perineurial fibroblast (white outline; arrow) with large nanogold deposits. (D) Endoneurial fibroblasts (arrow) in the lumbar nerve root with intracellular nanogold visible following gold enhancement (arrowhead). (E to G) Endoneurial nanogold located in the endoneurial space surrounding myelinated (My) and unmyelinated (Unmy) axons of (E) trigeminal, (F) lumbar nerve root, and (G) sciatic nerves. The endoneurial space is demarcated with dashed lines. Nanogold deposition is seen among collagen fibers in the endoneurium [(F) and (G)].
Fig. 10.
Fig. 10.. CSF penetrates Schwann cells, down to the axonal level.
(A) Schematic of peripheral nerve (PN) that contains multiple fascicles enclosed by the perineurium (Per), which bundles multiple axons (Ax) and their surrounding Schwann cells (Sch). Arrowheads mark examples of nanogold labeling in all panels. Examples of nanogold located in the Schwann cell (open arrowheads) and axon (closed arrowheads). (B to D) Nanogold found in the cytoplasm of Schwann cells found in the trigeminal [(B) and (C)] and Sciatic nerve (D). (E to J) Nanogold infused into the CSF of mice is found at the axonal level, located among the neurofilament of trigeminal nerves [(E) and (F)], lumbar nerve roots [(H) and (K)], and sciatic nerves [(G), (I), (J), (L), and (M)]. Halo’s produced by electron refraction was used to verifying nanogold within peripheral axons [(H) to (J)] and corresponding halos (K to M).

Update of

References

    1. Weed L., Studies on cerebro-spinal fluid. No. IV: The dual source of cerebro-spinal fluid. J. Med. Res. 31, 93–118.11 (1914). - PMC - PubMed
    1. Proulx S., Cerebrospinal fluid outflow: A review of the historical and contemporary evidence for arachnoid villi, perineural routes, and dural lymphatics. Cell. Mol. Life Sci. 78, 2429–2457 (2021). - PMC - PubMed
    1. Louveau A., Plog B., Antila S., Alitalo K., Nedergaard M., Kipnis J., Understanding the functions and relationships of the glymphatic system and meningeal lymphatics. J. Clin. Invest. 127, 3210–3219 (2017). - PMC - PubMed
    1. Sakka L., Coll G., Chazal J., Anatomy and physiology of cerebrospinal fluid. Eur. Ann. Otorhinolaryngol. Head Neck Dis. 128, 309–316 (2011). - PubMed
    1. Iliff J., Wang M., Liao Y., Plogg B., Peng W., Gundersen G., Benveniste H., Vates G., Deane R., Goldman S., Nagelhus E., Nedergaard M., A paravascular pathway facilitates CSF flow through the brain parenchyma and the clearance of interstitial solutes, including amyloid β. Sci. Transl. Med. 4, 147ra111 (2012). - PMC - PubMed

LinkOut - more resources