

Plasmin generation analysis in patients with bleeding disorder of unknown cause
- PMID: 39231312
- PMCID: PMC11564053
- DOI: 10.1182/bloodadvances.2024012855
Plasmin generation analysis in patients with bleeding disorder of unknown cause
Abstract
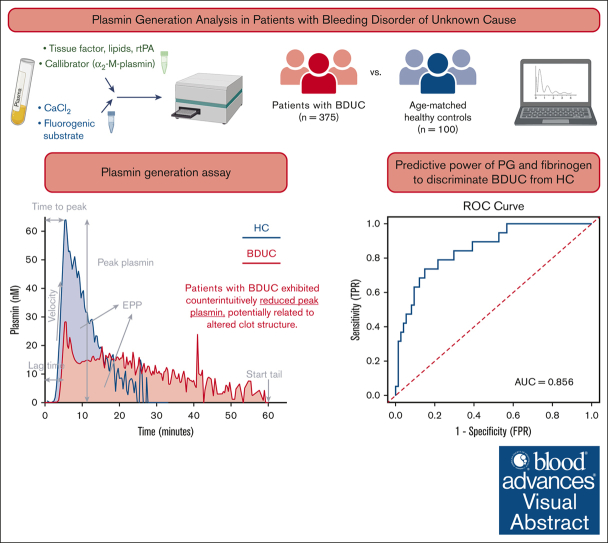
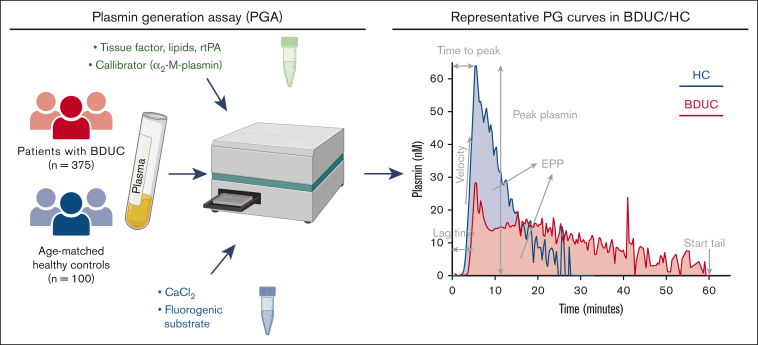
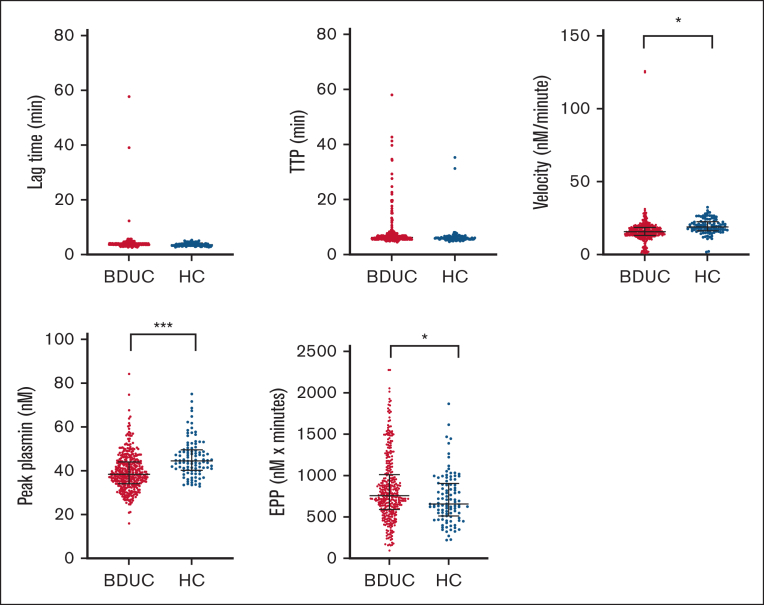
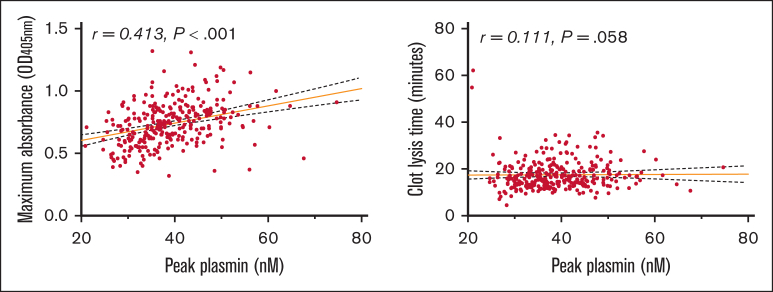
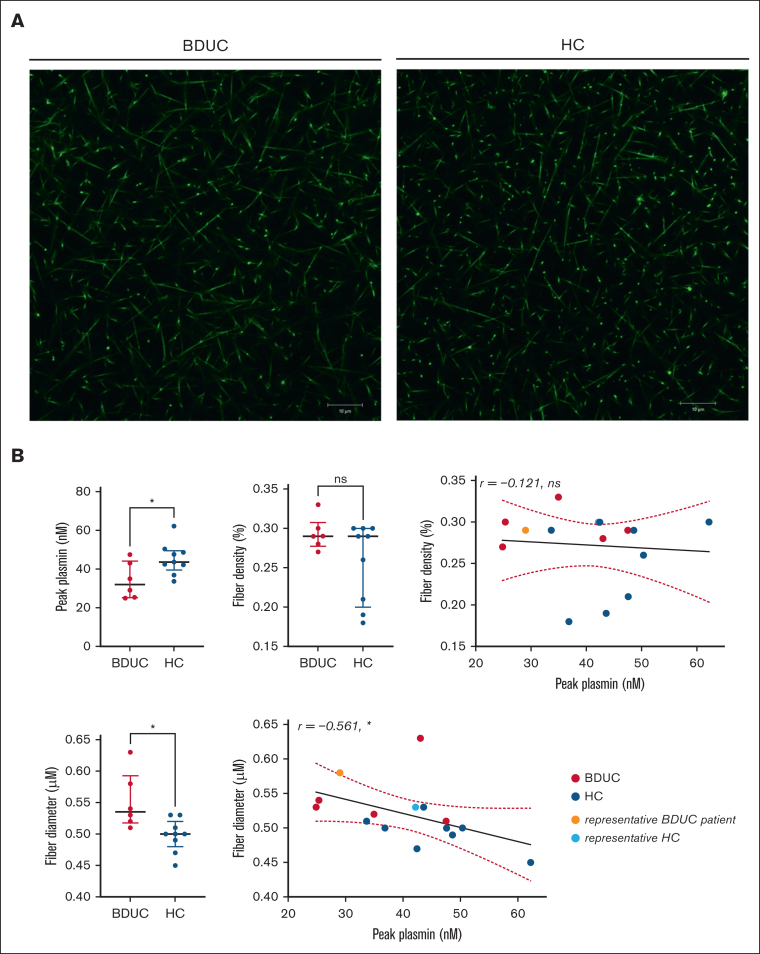
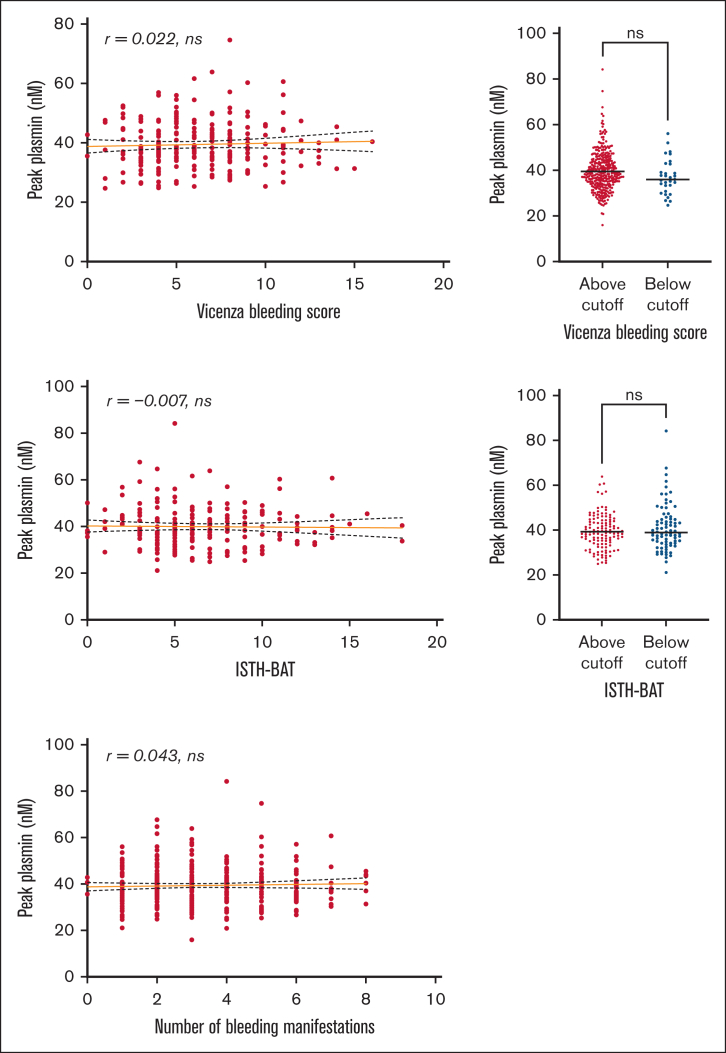
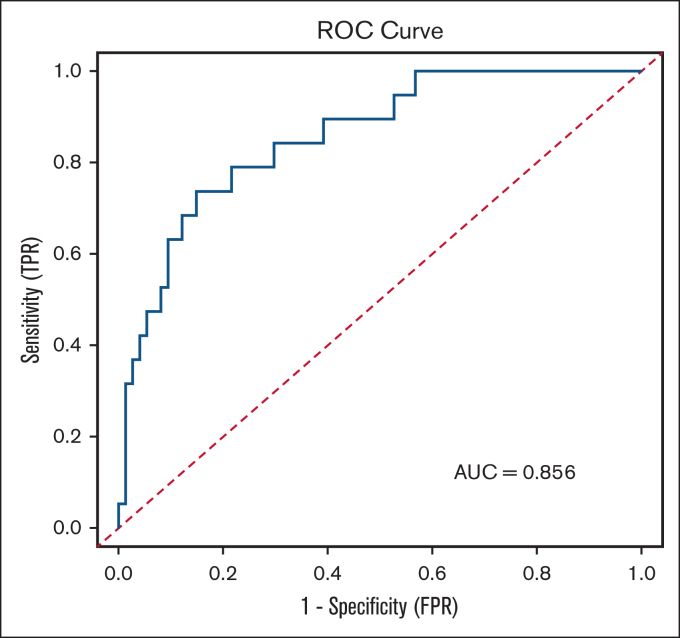
Bleeding disorder of unknown cause (BDUC) is a diagnosis of exclusion after evaluation of plasma coagulation and platelet function. Patients with BDUC (n = 375) recorded in the Vienna Bleeding Biobank were analyzed in comparison with healthy controls (HCs; n = 100) in this case-control study. Plasmin generation (PG) parameters were analyzed using calibrated fluorescence detection in citrated plasma. Turbidimetric plasma clot formation/lysis of 293 (78%) patients with BDUC and confocal microscopy of clots from representative patients with BDUC (n = 6) and HCs (n = 9) were assessed. In the PG analysis, patients with BDUC exhibited lower velocity and peak plasmin levels but a higher endogenous plasmin potential than HCs. Peak plasmin levels correlated with maximum clot absorbance but not with clot lysis time. Clot absorbance is an indicator of clot fiber density. Confocal microscopy analysis revealed a tendency towards thicker fibers in clots of patients with BDUC, which negatively correlated with peak plasmin (r = -0.561; P = .030). Peak plasmin correlated weakly with factor XIII, but not with other fibrinolytic factors (alpha2-antiplasmin, thrombin activatable fibrinolysis inhibitor, or plasminogen activator inhibitor 1) or bleeding severity. A model comprising fibrinogen and parameters of PG yielded high predictive power in discriminating between patients with BDUC and HCs across a fivefold stratified cross validation (80% of data; mean area under the curve [AUC], 0.847). The model generalized well to unseen data (20% of data; AUC, 0.856). Overall, patients with BDUC counterintuitively exhibited reduced peak plasmin levels, potentially related to altered clot structure.
© 2024 by The American Society of Hematology. Licensed under Creative Commons Attribution-NonCommercial-NoDerivatives 4.0 International (CC BY-NC-ND 4.0), permitting only noncommercial, nonderivative use with attribution. All other rights reserved.
Conflict of interest statement
Conflict-of-interest disclosure: D.M. reports receiving honoraria for advisory board meetings and lectures from CSL Behring. C.A. reports receiving honoraria from Bayer, CSL Behring, Novo Nordisk, Pfizer, Roche, Sobi, and Takeda for lectures and/or participation in advisory board meetings. I.P. reports receiving honoraria from Bayer, CSL Behring, Novo Nordisk, Pfizer, Roche, Sobi, and Takeda for lectures and advisory board meetings. A.S.W. reports receiving honoraria and/or participating in advisory board meetings for Takeda. J.G. reports receiving honoraria for lectures and advisory board meetings and receiving research funding for the Medical University of Vienna from CSL Behring, Novartis, Amgen, Sobi, and Takeda. B.d.L. reports being employed by Synapse Research Institute and being a member of the Stago Diagnostic group that produces calibrated automated thrombography for thrombin generation measurements in plasma. The remaining authors declare no competing financial interests.
Figures
Similar articles
-
Fibrinolysis is impaired in patients with primary immune thrombocytopenia.J Thromb Haemost. 2024 Nov;22(11):3209-3220. doi: 10.1016/j.jtha.2024.07.034. Epub 2024 Aug 28. J Thromb Haemost. 2024. PMID: 39214313
-
Thrombin-generating potential, plasma clot formation, and clot lysis are impaired in patients with bleeding of unknown cause.J Thromb Haemost. 2019 Sep;17(9):1478-1488. doi: 10.1111/jth.14529. Epub 2019 Jul 15. J Thromb Haemost. 2019. PMID: 31177606 Free PMC article.
-
Utility of Global Hemostatic Assays in Patients with Bleeding Disorders of Unknown Cause.Hamostaseologie. 2024 Oct;44(5):358-367. doi: 10.1055/a-2330-9112. Epub 2024 Jul 1. Hamostaseologie. 2024. PMID: 38950624 Review.
-
A direct oral anticoagulant edoxaban accelerated fibrinolysis via enhancement of plasmin generation in human plasma: dependent on thrombin-activatable fibrinolysis inhibitor.J Thromb Thrombolysis. 2019 Jul;48(1):103-110. doi: 10.1007/s11239-019-01851-8. J Thromb Thrombolysis. 2019. PMID: 30972711
-
Thrombin-activatable fibrinolysis inhibitor.Curr Med Chem. 2004 Sep;11(17):2335-48. doi: 10.2174/0929867043364586. Curr Med Chem. 2004. PMID: 15379716 Review.
Cited by
-
Targeting hemostatic enzymes: from mechanistic insights to therapeutic frontiers.Curr Opin Hematol. 2025 Sep 1;32(5):253-260. doi: 10.1097/MOH.0000000000000884. Epub 2025 Jul 14. Curr Opin Hematol. 2025. PMID: 40662421 Review.
-
Altered clot structure in pregnant women who will develop postpartum hemorrhage.Res Pract Thromb Haemost. 2025 Jan 16;9(1):102683. doi: 10.1016/j.rpth.2025.102683. eCollection 2025 Jan. Res Pract Thromb Haemost. 2025. PMID: 40007867 Free PMC article. No abstract available.
References
-
- Baker RI, Choi P, Curry N, et al. Standardization of definition and management for bleeding disorder of unknown cause: communication from the SSC of the ISTH. J Thromb Haemostasis. 2024;22(7):2059–2070. - PubMed
-
- Mehic D, Neubauer G, Janig F, et al. Risk factors for future bleeding in patients with mild bleeding disorders: longitudinal data from the Vienna Bleeding Biobank. J Thromb Haemostasis. 2023;21(7):1757–1768. - PubMed
-
- Gebhart J, Hofer S, Panzer S, et al. High proportion of patients with bleeding of unknown cause in persons with a mild-to-moderate bleeding tendency: results from the Vienna Bleeding Biobank (VIBB) Haemophilia. 2018;24(3):405–413. - PubMed
-
- Gebhart J, Hofer S, Kaider A, Rejtö J, Ay C, Pabinger I. The discriminatory power of bleeding assessment tools in adult patients with a mild to moderate bleeding tendency. Eur J Intern Med. 2020;78:34–40. - PubMed
Publication types
MeSH terms
Substances
Grants and funding
LinkOut - more resources
Full Text Sources
