. 2024 Nov;11(41):e2404186.
doi: 10.1002/advs.202404186. Epub 2024 Sep 4.

Broad Adaptability of Coronavirus Adhesion Revealed from the Complementary Surface Affinity of Membrane and Spikes

Affiliations

Broad Adaptability of Coronavirus Adhesion Revealed from the Complementary Surface Affinity of Membrane and Spikes

Aritz B García-Arribas et al. Adv Sci (Weinh). 2024 Nov.

Abstract

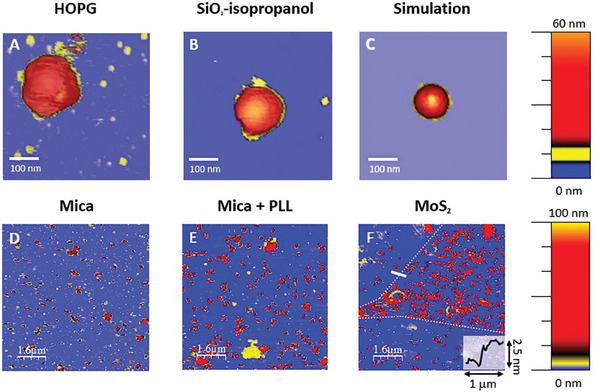
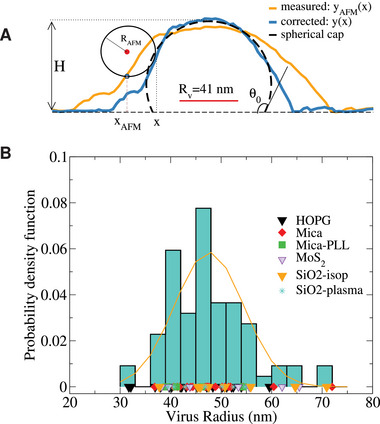
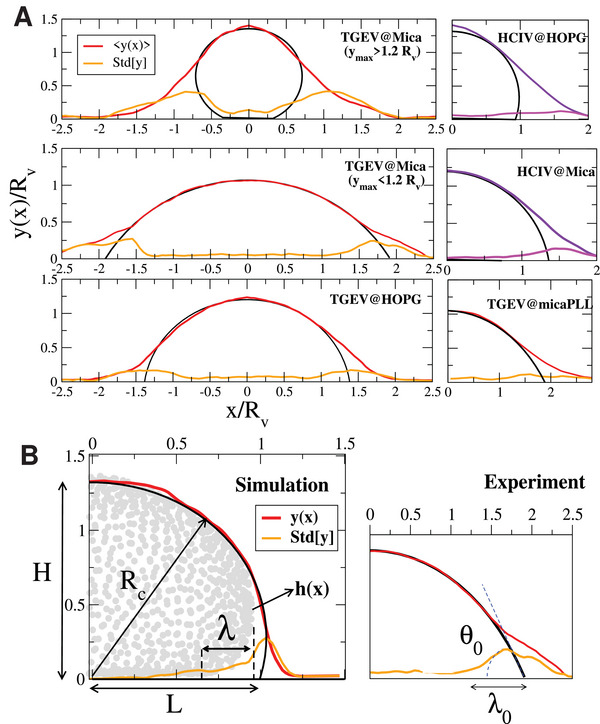
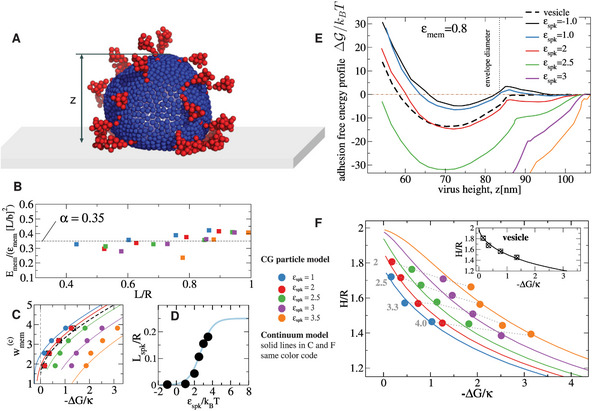
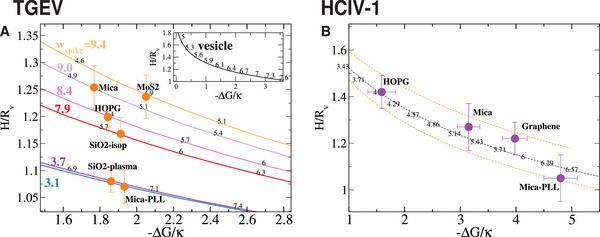
Coronavirus stands for a large family of viruses characterized by protruding spikes surrounding a lipidic membrane adorned with proteins. The present study explores the adhesion of transmissible gastroenteritis coronavirus (TGEV) particles on a variety of reference solid surfaces that emulate typical virus-surface interactions. Atomic force microscopy informs about trapping effectivity and the shape of the virus envelope on each surface, revealing that the deformation of TGEV particles spans from 20% to 50% in diameter. Given this large deformation range, experimental Langmuir isotherms convey an unexpectedly moderate variation in the adsorption-free energy, indicating a viral adhesion adaptability which goes beyond the membrane. The combination of an extended Helfrich theory and coarse-grained simulations reveals that, in fact, the envelope and the spikes present complementary adsorption affinities. While strong membrane-surface interaction lead to highly deformed TGEV particles, surfaces with strong spike attraction yield smaller deformations with similar or even larger adsorption-free energies.

Keywords: atomic‐force‐microscopy; coarse‐graining models; coronavirus; elastic theory; surface‐affinity.


Conflict of interest statement

The authors declare no conflict of interest.

Figures

Figure 1
Figure 1
Examples of AFM topographical images of TGEV on various substrates. Panels A (HOPG) and B (SiO2‐isopropanol) illustrate single virus partiles highlighting their nearly spherical shape due to lipid envelopes. The image size is ≈500 × 500 nm2. Viruses still may differ in size due to pleomorphism and present different degrees of attachment to the surfaces, which will be the main focus of our analysis later. Panels A and B correspond to real virus with radii 53 and 50 nm, respectively. Panel C shows the virtual AFM image of a coarse‐grained virus model (with average radius R v  ≈ 43 nm). In panel C the structural details in yellow are the adsorbed viral spikes. Panels D (mica), E (mica + PLL) and F (MoS2) exhibit images with a 1/30 viral dilution on each surface (see also Supporting Information). AFM images for the same dilution of viruses attached to the other surfaces under study are displayed in Figure S1 (Supporting Information). Panel F includes a dotted white line to highlight MoS2 ‐ SiO2 boundaries, which can be easily seen by optical microscopy Figure S4 (Supporting Information), and the inlet caption shows a cross section of the solid white line, displaying the ≈2.5 nm thickness of the MoS2 flake.
Figure 2
Figure 2
A) Measured AFM profile (orange line) and corrected profile taking into account AFM tip dilation and compression. The AFM tip is illustrated as a sphere of ≈25 nm. Results correspond to one TGEV particle on mica. The contour of the corrected profile y(x) is used in Equation (1) to provide the bare radius of the individual virus particle (R v  = 41 nm in this case, indicated with a red line). The black dashed line fits the corrected profile to a spherical cap, from which the contact angle θ0 is obtained. B) Probability density function of virus radii obtained from all the analyzed samples (colored symbols below indicate the lack of bias with different surfaces). The orange line indicates a Gaussian fit with average 47 nm and standard deviation 7 nm.
Figure 3
Figure 3
A) Average profiles and standard deviation Std[y] for TGEV (left) and HCIV‐1 vesicles (right) obtained from a collection of ≈20 AFM images. We illustrate the heterogeneity of TGEV profiles in mica, showing conditional averages for deflated particles with y max < 1.2R v and less deformed particles with y max > 1.2R v . The spherical cap approximation is shown with black lines. B) The right panel shows a virtual‐AFM profile from the virus CG‐model (Experimental Section and Supporting Information). The circles indicate the location of the CG beads. The relation between the Std[y](x) profile and the extrapolation length λ=κ/(2W) is indicated. The right panel shows an experimental AFM profile, illustrating the determination of λ0 and contact angle θ0 from the spherical cap approximation (black line).
Figure 4
Figure 4
Hill–Langmuir adsorption isothermal showing the adsorbed viral particles per µm2 (VC) against the concentration of virus in bulk c v. Dashed lines are fits to the linear (Henry) regime. The error bars correspond to the standard error from data obtained from n = 6 images at each concentration.
Figure 5
Figure 5
A) Illustration of the CG virus model. The membrane is composed by self‐aggregating mobile polar beads of radius b ≈ 2 nm and the spike is an elastic‐network with realistic values of flexibility and diffusivity (Experimental Section and Supporting Information). The adhesion energy per bead is noted as εmem (blue) for the envelope and εspk for the spikes (red) (the figure corresponds to ε spk  = 3.0 k B T and ε mem  = 0.8 k B T). B) Average membrane adhesion energy scaled with πL 2εmem/(πb 2); the dashed line corresponds to the mean value α = 0.35. The color‐coded filled circles indicate the energy of the spike CG beads εspk (in k B T units). C) Envelope non‐dimensional adhesion energy at contact w (c) = εmem R 2/(πb 2κ) against the total adsorption free energy. D) Effective spike adsorption length ℓspkL spk/R = E spk/[2εspk LR/b 2]; where E spk is the total spike adhesion energy. The solid line is a fit to the adsorbed population of a Hill model ℓspk = ℓmax p/(1 + p) with ℓmax = 0.25 and p=en([εspk]μ0)/kBT with Hill index n = 1.2 and chemical potential for unbounded spikes μ0 = −3.3  k B T. E) Free energy profiles ΔG(z) associated to the envelope maximum height z (see A), obtained from umbrella sampling (εmem = 0.8k B T). F) The CG virus height H/R against the unbounded‐bounded net free energy difference −ΔG/κ scaled with the CG‐model bending rigidity κ ≈ 40k B T (Supporting Information). The inset corresponds to the CG‐vesicle (no spikes). Lines in (B) and (E) corresponds to the theoretical model in Equation (2). In (F) the gray figures (and dotted lines) indicate the isolines of wmem(c)=R2Wmem(c)/κ.
Figure 6
Figure 6
Scaled particle height against the scaled adsorption‐free energy (ΔG/κ < 0). A) Experimental results for ΔG for TGEV (circles) are scaled with κ = 10 k B T. Lines correspond to the theoretical model in Equation (2) using c 0 = 1 and κ p  = 3. Values of Wmem(c)R2/κ are indicated with small black figures and Wspk(c)R2/κ indicated with large colored figures. The inset shows the corresponding theoretical prediction for Wspk(c)=0, i.e. no spikes (a vesicle), over the range of adhesion energy density predicted for the virus. B) Experimental results for HCIV‐1. Lines correspond to Equation (2) using c 0 = 0.1 and κ p  = 6.5 (black) (results for κ p  = 6.0 and 7.5 are indicated with orange lines, respectively below and above). In B the values for −ΔG/κ are estimated from the scaled adhesion energy Wmem(c)R2/κ measured from the contact angles obtained from the AFM indentation profiles. Error bars for H/R v corresponds to the standard error of (A) samples of n = 20 viruses (except for mica‐PLL and SiO2‐plasma, n = 10) and (B) samples of n = 20 viruses.
Figure 7
Figure 7
Illustration of the different conformations of the coronavirus according to the spike and membrane adhesion at each surface. A) Experimentally measured adhesion free energy −ΔG/k B T. B) Circles indicate the values of wspk(c) and wmem(c) derived from Equation (2) which match the experimental values of H and ΔG, as shown in Figure 6. Squares correspond to wmem(c) derived from the analysis of AFM profiles (Table 1). Dashed lines, drawn to guide the eye, highlight the opposite trends for wspk(c) and wmem(c). C) CG simulations for a case with large membrane adhesion (left), large spike adhesion (right) and similar adhesion (middle). The dynamics of these three cases are illustrated in Videos S1, S2, and S3 (Supporting Information).

Similar articles

Cited by

References

    1. Castaño N., Cordts C. S., Jalil M. K., Zhang K. S., Koppaka S., Bick A. D., Paul R., Tang S. K. Y., ACS Omega 2021, 6, 6509. - PMC - PubMed
    1. Zhang G., Cong Y., Liu F.‐L., Sun J., Zhang J., Cao G., Zhou L., Yang W., Song Q., Wang F., Liu K., Qu J., Wang J., He M., Feng S., Baimanov D., Xu W., Luo R.‐H., Long X.‐Y., Liao S., Fan Y., Li Y.‐F., Li B., Shao X., Wang G., Fang L., Wang H., Yu X.‐F., Chang Y.‐Z., Zhao Y., et al., Nat. Nanotechnol. 2022, 17, 993. - PubMed
    1. Joonaki E., Hassanpouryouzband A., Heldt C. L., Areo O., Chem 2020, 6, 2135. - PMC - PubMed
    1. Zeng C., Hernando‐Pérez M., Dragnea B., Ma X., van der Schoot P., Zandi R., Phys. Rev. Lett. 2017, 119, 038102. - PubMed
    1. Lipowsky R., Seifert U., Mol. Cryst. Liq. Cryst. 1991, 202, 17.

LinkOut - more resources