. 2024 Sep:8:e2400216.
doi: 10.1200/PO.24.00216.

Early Circulating Tumor DNA Shedding Kinetics for Prediction of Platinum Sensitivity in Patients With Small Cell Lung Cancer

Affiliations

Early Circulating Tumor DNA Shedding Kinetics for Prediction of Platinum Sensitivity in Patients With Small Cell Lung Cancer

Yonina R Murciano-Goroff et al. JCO Precis Oncol. 2024 Sep.

Abstract

Purpose: Small cell lung cancer (SCLC) is characterized by rapid progression after platinum resistance. Circulating tumor (ctDNA) dynamics early in treatment may help determine platinum sensitivity.

Materials and methods: Serial plasma samples were collected from patients receiving platinum-based chemotherapy for SCLC on the first 3 days of cycle one and on the first days of subsequent cycles with paired samples collected both before and again after infusions. Tumor-informed plasma analysis was carried out using CAncer Personalized Profiling by deep Sequencing (CAPP-Seq). The mean variant allele frequency (VAF) of all pretreatment mutations was tracked in subsequent blood draws and correlated with radiologic response.

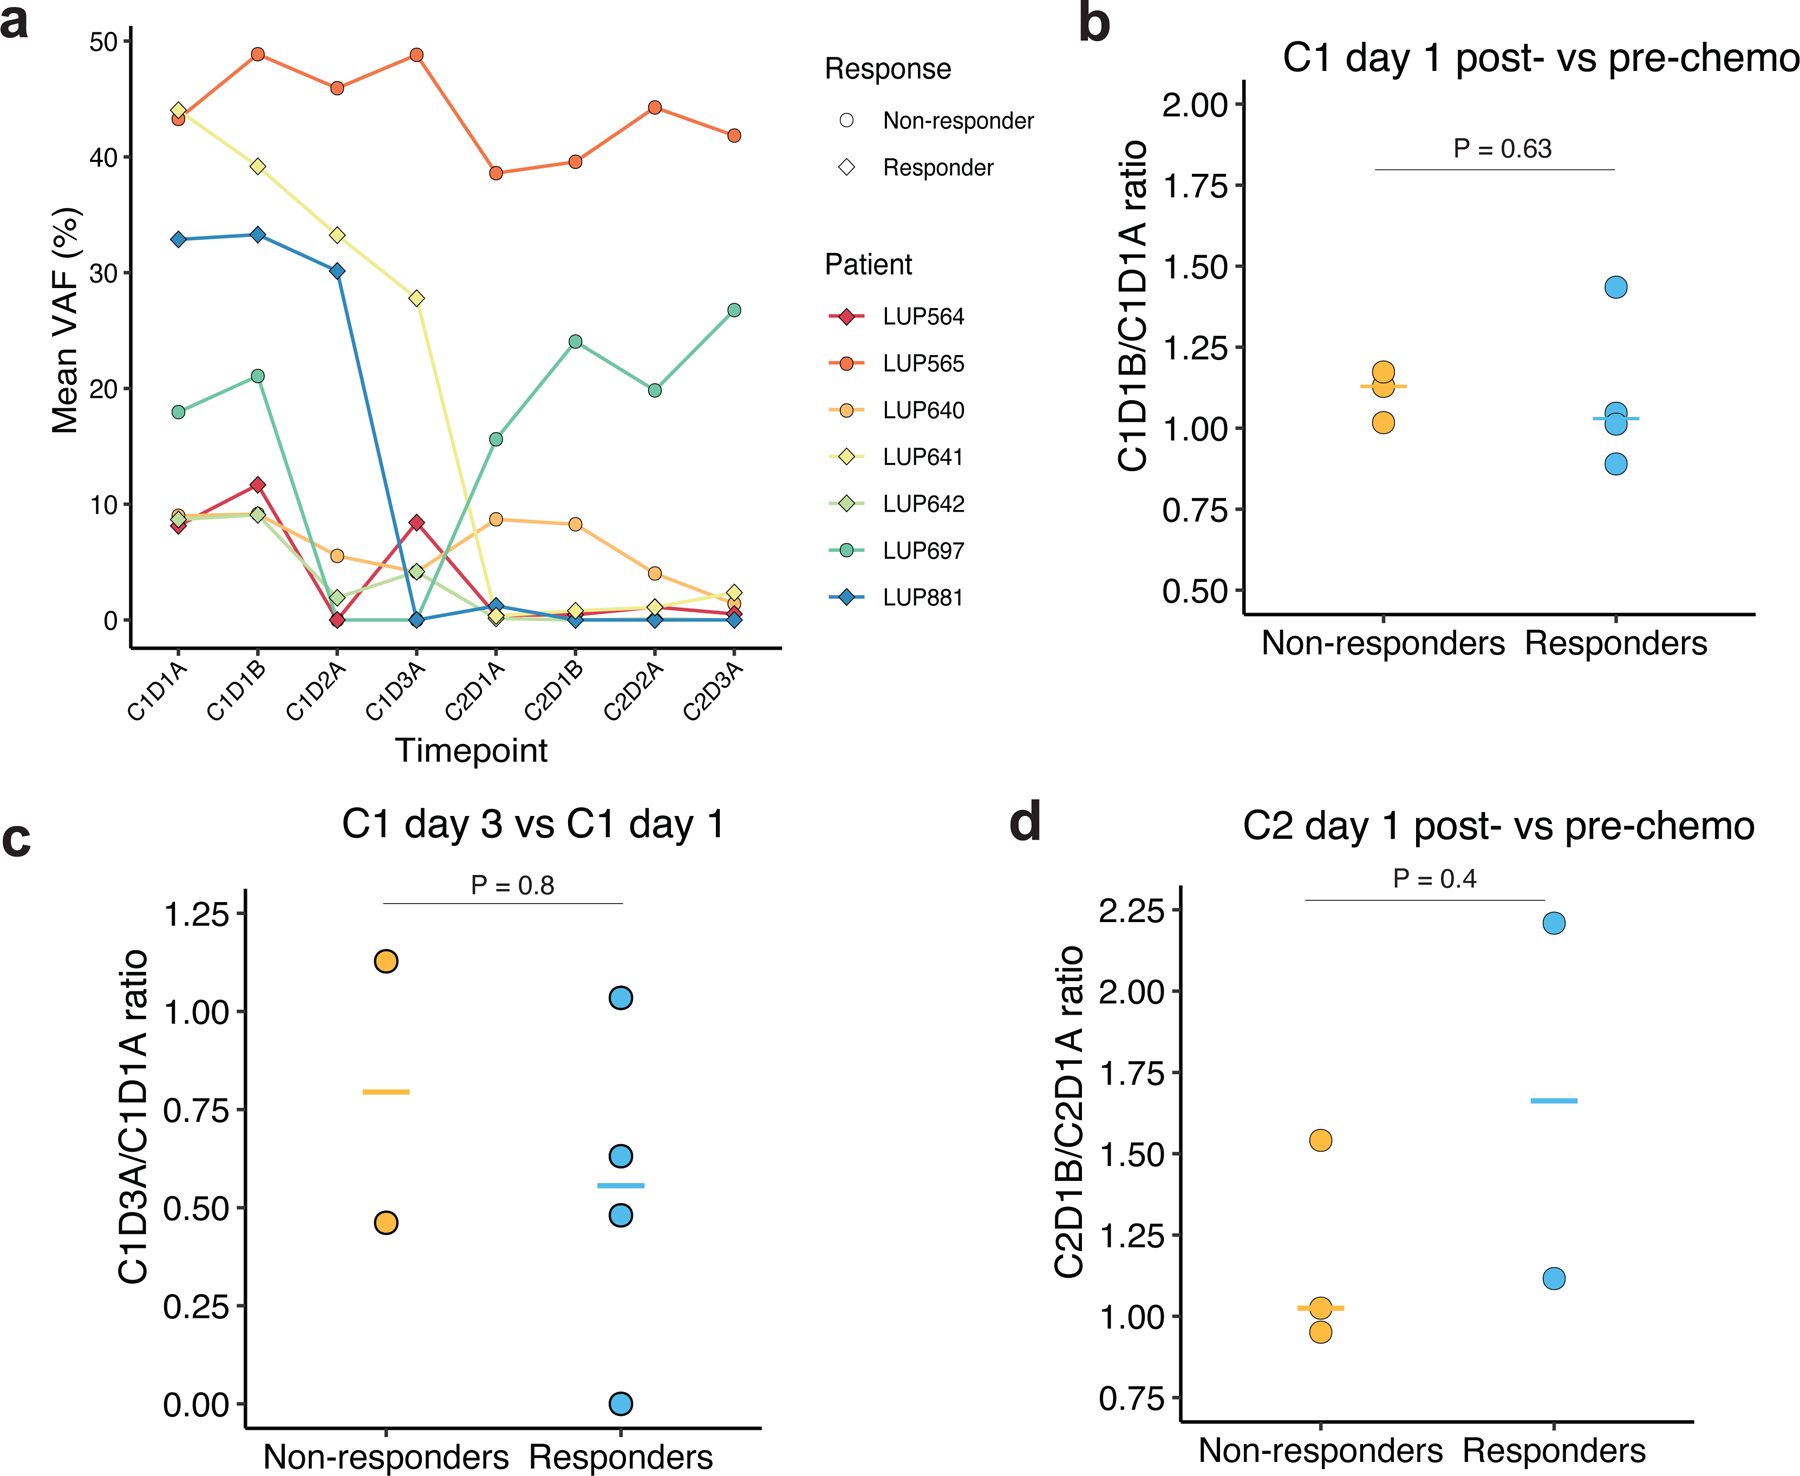
Results: ctDNA kinetics were assessed in 122 samples from 21 patients. Pretreatment VAF did not differ significantly between patients who did and did not respond to chemotherapy (mean 22.5% v 4.6%, P = .17). A slight increase in ctDNA on cycle 1, day 1 immediately post-treatment was seen in six of the seven patients with available draws (fold change from baseline: 1.01-1.44), half of whom achieved a response. All patients who responded had a >2-fold decrease in mean VAF on cycle 2 day 1 (C2D1). Progression-free survival (PFS) and overall survival (OS) were significantly longer in patients with a >2-fold decrease in mean VAF after one treatment cycle (6.8 v 2.6 months, log-rank P = .0004 and 21.7 v 6.4 months, log rank P = .04, respectively).

Conclusion: A >2-fold decrease in ctDNA concentration was observed by C2D1 in all patients who were sensitive to platinum-based therapy and was associated with longer PFS and OS.


Conflict of interest statement

Conflict of interest statement:

Y.R.M.-G. reports travel, accommodation, and expenses from AstraZeneca and Loxo Oncology/ Eli Lilly. She acknowledges honoraria from Virology Education and Projects in Knowledge (for a CME program funded by an educational grant from Amgen). She has been on an advisory board for Revolution Medicines. She acknowledges associated research funding to the institution from Mirati Therapeutics, Bristol Myers Squibb, Loxo Oncology at Eli Lilly, Elucida Oncology, Taiho Oncology, Hengrui USA, Ltd/ Jiangsu Hengrui Pharmaceuticals, Luzsana Biotechnology, Endeavor Biomedicines, and AbbVie. She is an employee of Memorial Sloan Kettering Cancer Center, which has an institutional interest in Elucida. She acknowledges royalties from Rutgers University Press and Wolters Kluwer. She acknowledges food/beverages from Endeavor Biomedicines. Y.R. Murciano-Goroff acknowledges receipt of training through an institutional K30 grant from the NIH (CTSA UL1TR00457). She has received funding from a Kristina M. Day Young Investigator Award from Conquer Cancer, the ASCO Foundation, endowed by Dr. Charles M. Baum and Carol A. Baum. She is also funded by the Fiona and Stanley Druckenmiller Center for Lung Cancer Research, the Andrew Sabin Family Foundation, the Society for MSK, the Squeri Grant for Drug Development, and a Paul Calabresi Career Development Award for Clinical Oncology (NIH/NCI K12 CA184746) as well as through NIH/NCI R01 CA279264.

Figures

Figure 1.
Figure 1.. Summary of patient characteristics and tumor variants detected in SCLC pretreatment plasma samples.
a. Clinical and molecular features of patients with SCLC included in this study. Each column represents an individual patient. Boxes are color coded for stage, treatment, RECIST, smoking status, tumor genotyping approach, and mutation type as indicated. Nonsynonymous mutations and indels in genes recurrently mutated in the cohort are shown in descending order of prevalence. Mutation recurrence rate in the cohort is depicted by bar graphs to the right. Carbo = carboplatin; etop = etoposide; pembro = pembrolizumab; atezo = atezolizumab. Best overall response to therapy was determined using RECIST PR = partial response; SD = stable disease; PD = progression of disease. b. Mean variant allele frequency (VAF%) of all mutations in responders vs. non-responders. c. Number of mutations detected in responders vs. non-responders. No differences were observed in either the mean VAF% (p=0.105) or number of mutations (p=0.11) detected in the baseline plasma sample between the two groups of patients.
Figure 2.
Figure 2.. Comparison of tumor-informed and tumor-naïve ctDNA detection.
a. Percent of patients with tumor variants covered by both MSK-IMPACT and CAPP-Seq panels in whom ctDNA was detected in baseline plasma samples using either the tumor-informed or tumor-naïve ctDNA detection modes of CAPP-Seq. b. Comparisons of VAFs in tumor tissue and pre-treatment plasma for five patients in whom tumor-naïve CAPP-Seq identified mutations in plasma that were also present on MSK-IMPACT tumor analysis.
Figure 3:
Figure 3:. ctDNA fold change after one cycle of chemotherapy stratifies responders and non-responders.
a. Event charts for patients in the present study. Each row represents a patient with circles depicting the time of blood collections relative to scheduled chemotherapy cycles (as annotated at the top of the figure). Arrow heads at the end of bars indicate that the patient has not progressed. Circles are color coded by mean VAF of detected alterations. Stars denote progression of disease by scans. PR = partial response, SD = stable disease; POD = progression of disease. b. Mean VAF in pre-treatment and cycle 2 day 1 plasma samples in responders and non-responders with available plasma at these time points. c. Time courses of ctDNA responses measured by mean VAF in radiologic responders and non-responders. d. Mean VAFs in C1D1A and C2D1A plasma samples and ctDNA fold change normalized to C1D1A VAFs in responders and non-responders with available plasma at these time points.
Figure 4.
Figure 4.. Patient vignettes for a representative responder and non-responder.
a. Changes in ctDNA mean VAF (left y-axis, indicated by green line) in a patient who achieved radiologic response. The black dotted line shows percent change in tumor burden by RECIST sum of lesion diameters (SLD; right y-axis) at days 85 and 138 days post treatment. Scans done on day 40 showed a 44.7% decrease in tumor burden by RECIST. B: Changes in ctDNA mean VAF (pink line) in a non-responder, with black dotted line showing no change in tumor burden by RECIST SLD on days 37 and 77 post treatment. Persistence of tumors was shown on scans done on day 37. The patient was classified as having RECIST progression on scans performed on day 77.
Figure 5.
Figure 5.. ctDNA fold changes during the days of the first or second cycles of chemotherapy are not associated with radiologic response.
a. Time courses of ctDNA responses measured by mean VAF in patients with multiple same day plasma samples collected during the first two cycles of chemotherapy. b. Ratio of ctDNA concentration as measured by mean VAF in C1D1B (post-chemotherapy on cycle 1, day 1) compared to baseline plasma samples C1D1A (pre-chemotherapy on cycle 1, day 1). c: Ratio of ctDNA concentration as measured by mean VAF before chemotherapy on the third day of treatment in cycle 1 (C1D3A) compared to baseline, prior to start of cycle 1. d: Ratio of ctDNA concentration as measured by mean VAF in C2D1B (post-chemotherapy on cycle 2, day 1) compared to C2D1A plasma samples (pre-chemotherapy on cycle 2, day 1).
Figure 6.
Figure 6.. Fold change in relative ctDNA concentration after one cycle of chemotherapy is associated with patient outcomes.
a. Progression free survival of patients grouped according to whether they achieved a ≥2 fold-decrease in mean VAF comparing C2D1A to baseline plasma samples. The lower graph shows follow-up time, with the grey line representing median PFS (6.8 months versus 2.6 months, p=0.0004). b. Overall survival of patients grouped according to whether they achieved a ≥2 fold-decrease in mean VAF comparing C2D1A to baseline plasma samples. The lower graph shows follow-up time, with the grey line representing median OS (21.7 months versus 6.4 months, p=0.039).

References

    1. Govindan R, Page N, Morgensztern D, et al. : Changing epidemiology of small-cell lung cancer in the United States over the last 30 years: analysis of the surveillance, epidemiologic, and end results database. J Clin Oncol 24:4539–44, 2006 - PubMed
    1. Poirier JT, George J, Owonikoko TK, et al. : New Approaches to SCLC Therapy: From the Laboratory to the Clinic. J Thorac Oncol 15:520–540, 2020 - PMC - PubMed
    1. Byers LA, Rudin CM: Small cell lung cancer: where do we go from here? Cancer 121:664–72, 2015 - PMC - PubMed
    1. Sabari JK, Lok BH, Laird JH, et al. : Unravelling the biology of SCLC: implications for therapy. Nat Rev Clin Oncol 14:549–561, 2017 - PMC - PubMed
    1. George J, Lim JS, Jang SJ, et al. : Comprehensive genomic profiles of small cell lung cancer. Nature 524:47–53, 2015 - PMC - PubMed