Review
. 2024 Sep 27;9(9):4450-4468.
doi: 10.1021/acssensors.4c01391. Epub 2024 Sep 4.

Electroanalytical Strategies for Local pH Sensing at Solid-Liquid Interfaces and Biointerfaces

Affiliations
Review

Electroanalytical Strategies for Local pH Sensing at Solid-Liquid Interfaces and Biointerfaces

Isabell Wachta et al. ACS Sens. .

Abstract

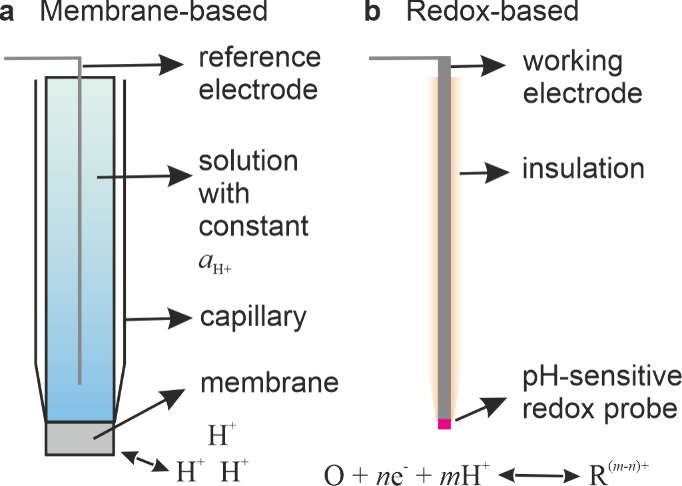
Obtaining analytical information about chemical species at interfaces is fundamentally important to improving our understanding of chemical reactions and biological processes. pH at solid-liquid interfaces is found to deviate from the bulk solution value, for example, in electrocatalytic reactions at surfaces or during the corrosion of metals. Also, in the vicinity of living cells, metabolic reactions or cellular responses cause changes in pH at the extracellular interface. In this review, we collect recent progress in the development of sensors with the capability to detect pH at or close to solid-liquid and bio interfaces, with spatial and time resolution. After the two main principles of pH detection are presented, the different classes of molecules and materials that are used as active components in these sensors are described. The review then focuses on the reported electroanalytical techniques for local pH sensing. As application examples, we discuss model studies that exploit local pH sensing in the area of electrocatalysis, corrosion, and cellular interfaces. We conclude with a discussion of key challenges for wider use of this analytical approach, which shows promise to improve the mechanistic understanding of reactions and processes at realistic interfaces.

Keywords: corrosion; electrified interface; electrocatalysis; extracellular pH; ion selective electrode; pH sensor; potentiometry; scanning electrochemical microscopy; ultramicroelectrode; voltammetry.


Conflict of interest statement

The authors declare no competing financial interest.

Figures

Figure 1
Figure 1
Typical layouts for (a) a membrane-based pH electrode consisting of a reference electrode and a membrane that separates the inner solution from the analysis solution, where the H+ activity needs to be measured, and (b) a redox-based pH electrode consisting of a working electrode modified with a pH-sensitive electroactive species at the end and otherwise passivated with an insulating layer.
Figure 2
Figure 2
Chemical structures of two exemplary ionophores reported for local pH sensing. The position of proton exchange is indicated with a red H.
Figure 3
Figure 3
Chemical structures of selected pH-sensitive redox-active molecules belonging to the three categories: (a) hydroxyphenyl derivatives, (b) phenothiazine derivatives, and (c) others. The molecules are shown in their protonated reduced states. The position of deprotonation upon oxidation is indicated with a red H.
Figure 4
Figure 4
(a) CVs recorded at a gold microelectrode in aqueous solutions with varying HClO4 concentrations. (b) Calibration curve showing the peak position of the gold oxide reduction. Reprinted under Creative Commons License from ref (109). Copyright 2020 Wiley-VCH. (c) CVs at a Pt-UME showing the redox behavior of platinum in KOH solutions with varying concentration. (d) The reduction peaks of platinum oxide are found to shift cathodically with increasing KOH concentration. Reprinted under Creative Commons License from ref (115). Copyright 2021 Wiley-VCH.
Figure 5
Figure 5
Calibration curves showing the measured open-circuit potential (OCP) as a function pH for selected potentiometric pH sensors: (a) a Pt/hydrous-IrOx (25 μm diameter) sensor with a sensitivity of 71.1 ± 2 mV/pH. The red curve shows that the sensitivity is nearly unaffected even in the presence of the interferent H2O2. Reprinted from ref (71). Copyright 2023 American Chemical Society. (b) A polymer redox sensor based on polyaniline-coated gold UME (340–600 nm diameter) showing a near-Nernstian sensitivity (56 mV/pH) in the pH range of 4–12. EMF: Electromotive Force = OCP. Reprinted with permission from ref (98) Copyright 2013 Electrochemical Society.
Figure 6
Figure 6
(a) CVs recorded at a syringaldazine-modified carbon nanoelectrode (50 nm diameter, pH range: 2.01–11.97). (b) Calibration curve showing the midpeak potential as a function of pH. Reprinted from ref (49). Copyright 2015 American Chemical Society. (c) CVs measured at a 4-HATP-modified Au-UME (50 μm diameter, pH range: 1.79–9.18). (d) Calibration curve of the corresponding peak potentials obtained in solutions saturated with Ar or H2. As the aim was to study hydrogen evolution, the tip was also tested in H2-saturated solution to demonstrate the stability of the sensor against H2. Reprinted from ref (50). Copyright 2020 American Chemical Society. (e) DPVs measured at a carbon fiber microelectrode modified with graphene oxide and polymelamine. Data obtained in buffer solutions of varying pH from 4.0 to 9.0. The peak at around −0.22 V corresponds to the pH-independent redox of graphene oxide, while the second peak in positive potentials is due to the pH-dependent redox of polymelamine. (f) Calibration curve showing the peak spacing as a function of solution pH. Reprinted from ref (100). Copyright 2022 American Chemical Society.
Figure 7
Figure 7
Ionophore-based single-pH-probes. (a) Schematic showing the fabrication of a membrane in a nanopore at the end of a nanocapillary. The membrane comprises the enzyme glucose oxidase and poly(lysine). (right bottom) SEM image of the end of the nanocapillary showing the dried membrane close to the end of the capillary. Scale bar 500 nm. Reprinted under Creative Commons License from ref (37). Nature Publishing Group. (b) Schematic of a pH microprobe using a solid contact between a carbon paste and the proton selective membrane. DOS: dioctyl sebacate. Reprinted from ref (41). Copyright 2017 American Chemical Society.
Figure 8
Figure 8
(a) Schematic showing the fabrication protocol for metal UMEs: Sodalime glass capillaries are heated, while a pulling force is applied to the ends using a P-2000 micropipette laser puller, resulting in tapered micropipette tips. A metal wire is inserted into the pulled micropipette tip and sealed using a heating a coil. Finally, the micropipette tip is assembled with external electrical connections. Subsequently, the tip is polished to expose the embedded metal wire (not shown). (b, c) Side view and end view of typical pulled capillaries resulting in disk UMEs—Au wire of 10 μm diameter (b) and carbon nanofiber with diameter of 7 μm (c). Scale bar 25 μm. Reprinted from ref (135). Copyright 2015 American Chemical Society.
Figure 9
Figure 9
CVs measured at the metal and carbon disk UMEs described in Figure 8. The diameters of the electrodes are as indicated. The CVs were obtained in 1 mM ferrocenemethanol in 0.1 M KCl at 10 mV/s. Reprinted from ref (135). Copyright 2015 American Chemical Society.
Figure 10
Figure 10
(a-c) Triple Pt-based pH-H2O2 probe. (a) Schematic showing the fabrication of the triple probe tip. (b) Optical images of the surface of the tip before and after modification with Pt black (for H2O2 sensing) and IrOx (for pH sensing). (c) Scheme of the fabricated triple probe tip. Reprinted from ref (71). Copyright 2023 American Chemical Society. (d–f) Dual Au/Pt-based pH probe. (d) Scheme of the dual probe, with the working electrode (WE) used for positioning the probe above the surface and the indicator electrode (IndE) for pH measurement. (e, f) SEM images of the Au/Pt-dual UME before (e) and after (f) electrodeposition of IrOx. Reprinted with permission from ref (74). Copyright 2023 Elsevier.
Figure 11
Figure 11
(a–c) Dual SICM-pH-probe. Schematic showing the principle of carbon deposition in one of the capillaries of a pulled theta/double barrel pipet. (b) Optical and (c) SEM images of a double-barrel pipet after carbon deposition. The carbon electrode is modified with IrOx to realize the pH probe. The unfilled capillary is used for SICM-based height measurement. Reprinted from ref (76). Copyright 2013 American Chemical Society.
Figure 12
Figure 12
RRDE: Photographs showing an RRDE with gold disk and ring (left), after Ir metal deposition on the ring (middle), and after conversion to IrOx (right). Reprinted from ref (73) .Copyright 2022 American Chemical Society.
Figure 13
Figure 13
(a–c) Local pH map at a Pt-UME measured using a syringaldazine-modified carbon nanoelectrode. (a) Layout of the measurement showing the imaging area containing a Pt-disk in the middle. (b) A map of pH recorded 2.5 μm above the 10 μm diameter Pt disk electrode. The electrode is held at a potential of −0.8 V promoting oxygen reduction. (c) Example CVs at the pH electrode at a scan rate of 0.66 V/s, from which the pH is extracted. Reprinted from ref (49). Copyright 2015 American Chemical Society. (d–f) Local pH map at a corroding Zn–Fe couple. (d) Optical image, (e) pH map recorded using a pH membrane UME, and (f) and current density recorded using a vibrating Pt–Ir probe. Reprinted with permission from ref (51). Copyright 2011 Elsevier. (g–i) Mapping of pHe. (g) Fluorescence image, (h) pH map, and (i) SICM-height image of a low-buffered MCF7 breast cancer cell in an estradiol-deprived medium. The pH and SICM-height were obtained using the dual SICM-pH probe shown in Figure 11. Scale bar 20 μm. Reprinted under Creative Commons License from ref (37). 2019 Nature Publishing Group.

Similar articles

References

    1. Sørensen S. P. L. Über die Messung und die Bedeutung der Wasserstoffionenkonzentration bei enzymatischen Prozessen. Biochemische Zeitschrift 1909, (21), 131–200.
    1. Yuqing M.; Jianrong C.; Keming F. New technology for the detection of pH. J. Biochem. Bioph. Methods 2005, 63 (1), 1–9. 10.1016/j.jbbm.2005.02.001. - DOI - PubMed
    1. Yang K.; Kas R.; Smith W. A. In Situ Infrared Spectroscopy Reveals Persistent Alkalinity near Electrode Surfaces during CO2 Electroreduction. J. Am. Chem. Soc. 2019, 141 (40), 15891–15900. 10.1021/jacs.9b07000. - DOI - PMC - PubMed
    1. Zhang F.; Co A. C. Direct Evidence of Local pH Change and the Role of Alkali Cation during CO2 Electroreduction in Aqueous Media. Angew. Chem., Int. Ed. 2020, 59 (4), 1674–1681. 10.1002/anie.201912637. - DOI - PubMed
    1. Figueiredo M. C.; Arán-Ais R. M.; Climent V.; Kallio T.; Feliu J. M. Evidence of Local pH Changes during Ethanol Oxidation at Pt Electrodes in Alkaline Media. ChemElectroChem 2015, 2 (9), 1254–1258. 10.1002/celc.201500151. - DOI

LinkOut - more resources