. 2024 Sep 4;22(9):e3002757.
doi: 10.1371/journal.pbio.3002757. eCollection 2024 Sep.

A flexible loop in the paxillin LIM3 domain mediates its direct binding to integrin β subunits

Affiliations

A flexible loop in the paxillin LIM3 domain mediates its direct binding to integrin β subunits

Timo Baade et al. PLoS Biol. .

Abstract

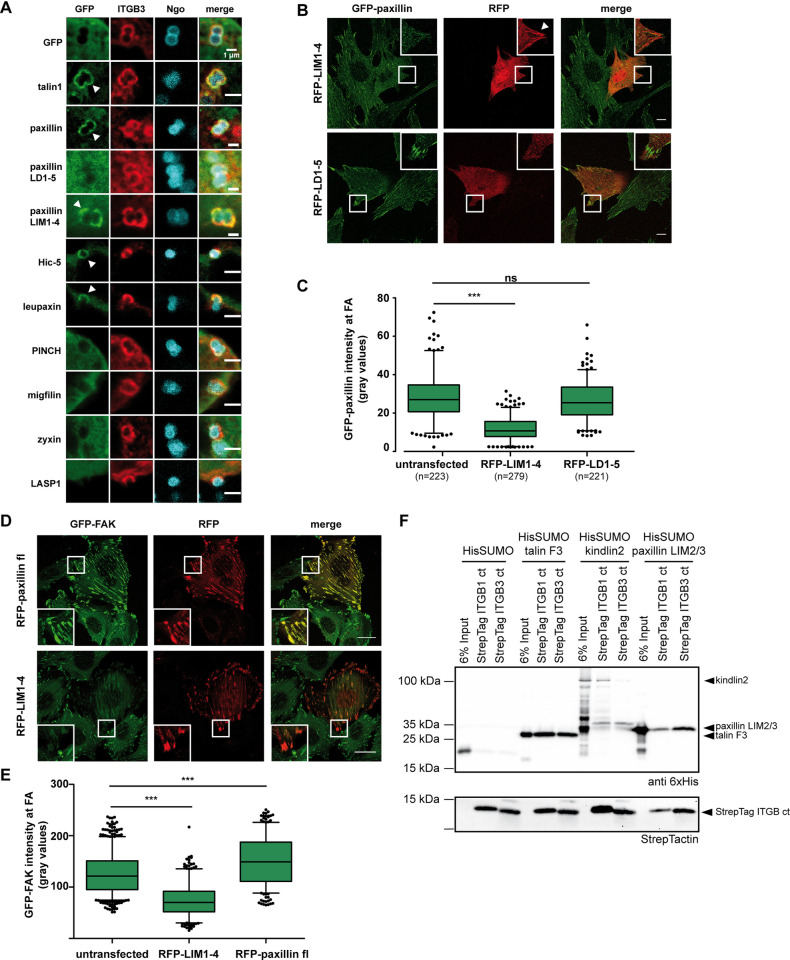
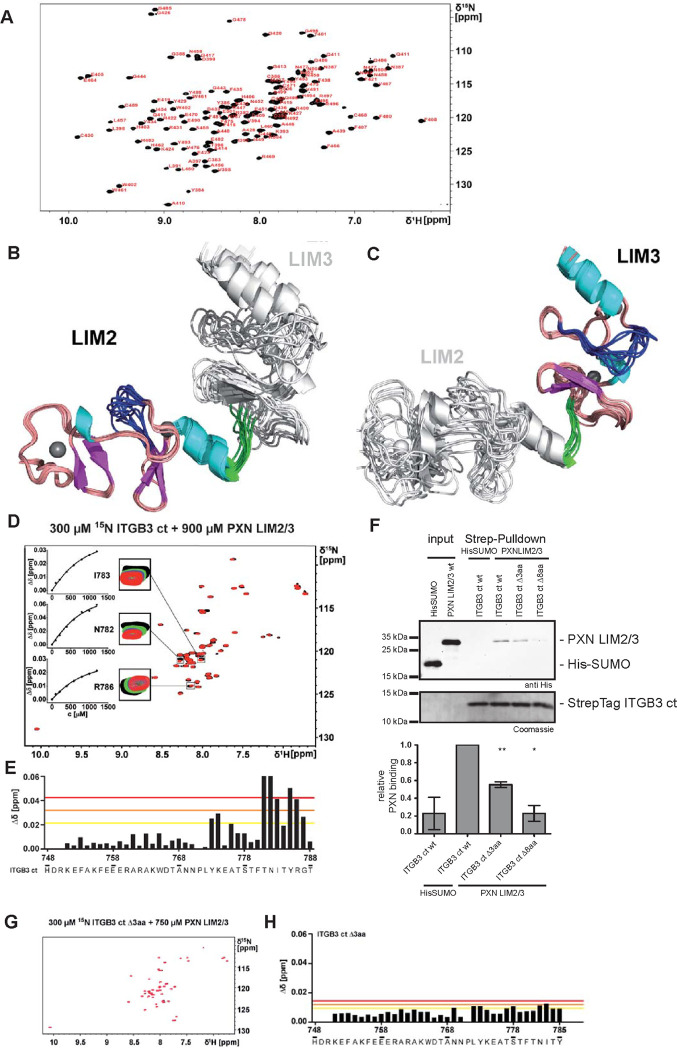
Integrins are fundamental for cell adhesion and the formation of focal adhesions (FA). Accordingly, these receptors guide embryonic development, tissue maintenance, and haemostasis but are also involved in cancer invasion and metastasis. A detailed understanding of the molecular interactions that drive integrin activation, FA assembly, and downstream signalling cascades is critical. Here, we reveal a direct association of paxillin, a marker protein of FA sites, with the cytoplasmic tails of the integrin β1 and β3 subunits. The binding interface resides in paxillin's LIM3 domain, where based on the NMR structure and functional analyses, a flexible, 7-amino acid loop engages the unstructured part of the integrin cytoplasmic tail. Genetic manipulation of the involved residues in either paxillin or integrin β3 compromises cell adhesion and motility of murine fibroblasts. This direct interaction between paxillin and the integrin cytoplasmic domain identifies an alternative, kindlin-independent mode of integrin outside-in signalling particularly important for integrin β3 function.


Conflict of interest statement

The authors have declared that no competing interests exist.

Figures

Fig 1
Fig 1. The LIM2/3 domains direct paxillin to the cytoplasmic tail of integrin β1 and β3.
(A) 293T cells were transiently cotransfected with a CEACAM3-ITGB3 (ITGB3) fusion construct together with GFP or the indicated GFP-labelled proteins. Cells were seeded on poly-L-lysine and incubated for 1 h with Pacific Blue–labelled Neisseria gonorrhoeae (Ngo; blue) to cluster ITGB3 (stained red with α-CEACAM antibody). Recruitment of GFP-fused proteins to the clustered integrin β3 tail is indicated by white arrowheads. Bars represent 2 μm. (B) Stable GFP-paxillin expressing Flp-In 3T3 cells were transiently transfected with RFP-tagged paxillin LIM1-4 or RFP-tagged paxillin LD1-5 domains. Displacement of GFP-paxillin by RFP-LIM1-4, but not RFP-LD1-5, is visible in boxed and enlarged areas. (C) GFP-Paxillin localization at FAs in presence of LIM1-4 or LD1-5 domains as in (B) was evaluated by measuring the GFP fluorescence intensity. Shown are mean values of GFP-paxillin intensity from 3 independent experiments. Total number of analysed FAs is given in brackets under each sample. Error bars represent 5 and 95 percentiles. Significance was calculated using one-way ANOVA, followed by Bonferroni multiple comparison test (*** p < 0.0001, ns = not significant). The data underlying this panel can be found in S1 Data. (D) GFP-FAK expressing MEFs were transiently transfected with RFP-paxillin full-length or RFP-LIM1-4. Displacement of GFP-FAK by RFP-LIM1-4, but not RFP-Paxillin, is visible in boxed and enlarged areas. (E) Calculation of GFP-FAK intensity at FAs was performed as in (C) n = 360 FAs per sample from 3 independent experiments. Significance was calculated using one-way ANOVA, followed by Bonferroni multiple comparison test (*** p < 0.0001). The data underlying this panel can be found in S1 Data. (F) In vitro pulldown using recombinant Strep-tag integrin β1 or β3 cytoplasmic tails and recombinant talin1 F3 domain, full-length kindlin2 or paxillin LIM2/3 domain fused to His-SUMO, or His-SUMO only as negative control.
Fig 2
Fig 2. The paxillin LIM2/3 domains directly interact with C-terminal residues of integrin β3.
(A) Assigned 1H-15N-HSQC spectrum of paxillin LIM2/3. Backbone amide crosspeaks and side-chain amide groups are labeled by amino acid type and position. (B, C) Solution structure of paxillin LIM2/3. The final ensemble of 10 conformers with lowest target function is shown fitted to the LIM2 domain (residues P381 to F438) (B) or fitted to the LIM3-domain (residues P440 to R497) (C), shown in ribbon representations. In the fitted part, α-helices are colored cyan and β-strands magenta. Zinc ions are shown as grey spheres. The linker region between LIM2 and LIM3, residues F438-A439-P440-K441, is colored in green. The flexible loops of the LIM2 domain (residue F415 to F421) and the LIM3 domain (residue T473 to E482) are shown in blue. The domain that was not used for fitting is shown in light grey. (D) 15N-HSQC titration of 300 μM 15N integrin β3 ct (ITGB3 ct) with paxillin LIM2/3. Paxillin was added in concentrations up to 900 μM. Boxes show a selection of signals affected by CSPs (residues I783, N782, and R786) in the presence of 0 μM (black), 150 μM (green), 300 μM (blue), and 900 μM (red) paxillin LIM2/3. Insets show the concentration dependence of combined amide CSPs globally fitted to a one site binding model. (E) Combined amide CSPs of 300 μM 15N integrin β3 ct in the presence of 760 μM paxillin LIM2/3 vs. residue number of integrin β3 ct. Lines indicate average δΔ + 1× s.d. (yellow), δΔ + 2× s.d. (orange), and δΔ + 3× s.d. (red). (F) In vitro pulldown of His-SUMO or His-SUMO-paxillin LIM2/3 (PXN LIM2/3) using the Strep-tag integrin β3 cytoplasmic tail in the wild-type form (wt) or with a truncation of the carboxy-terminal 3 (Δ3aa) or 8 (Δ8aa) amino acids. The bar graph below shows the densitometric quantification of the pulldown experiments (n = 3). Statistical significance was calculated using one-sample t test to calculate if samples mean are significantly different from a hypothetical value of 1 (* p < 0.05, ** p < 0.01). The data underlying this panel can be found in S1 Data. (G) 15N-HSQC titration of 300 μM 15N integrin β3 Δ3aa (ITGB3 Δ3aa) with paxillin LIM2/3 (PXN LIM2/3). Paxillin was added up to a concentration of 750 μM. (H) Combined amide CSPs of 300 μM 15N integrin β3 ct Δ3aa in the presence of 750 μM paxillin LIM2/3 vs. residue number of integrin β3 ct Δ3aa.
Fig 3
Fig 3. A flexible loop in the LIM3 domain mediates binding to the integrin β cytoplasmic tail.
(A) 15N-HSQC titration of 250 μM 15N paxillin LIM2/3 wt (PXN LIM2/3 wt) with integrin β3. ITGB3 ct was added in concentrations up to 2,420 μM. Boxes show a selection of signals affected by CSPs (residues F480 and F481) in the presence of 0 μM (black), 200 μM (green), 600 μM (blue), and 2420 μM (red) integrin β3 ct. (B) Combined amide CSPs of 250 μM 15N paxillin LIM2/3 in the presence of 750 μM integrin β3 vs. residue number of paxillin. Lines indicate average δΔ + 1× s.d. (yellow), δΔ + 2× s.d. (orange), and δΔ + 3× s.d. (red). The amide CSPs were mapped onto the solution structure of paxillin LIM2/3 shown as surface representation from 2 perspectives. Residues showing CSPs larger than average δΔ + 3× s.d. are colored red, residues for which [average δΔ + 3× s.d. < δΔ < average δΔ +2× s.d.] are colored orange, and residues for which [average δΔ + 2× s.d.< δΔ < average δΔ + 1× s.d.] are colored yellow. Residues with δΔ < average + 1× s.d. are colored grey. The boxed region is also shown in stick representation, including the flexible loop of the LIM3 domain using the same color code. Residues experiencing significant CSPs are labelled by amino acid type and position. (C) 15N-HSQC titration of 300 μM 15N paxillin LIM2/3 4A (PXN LIM2/3 4A) with integrin β3. Integrin was added in concentrations up to 1582 μM. Boxes show a selection of signals affected by CSPs (residues F421 and Y453) in the presence of 0 μM (black), 632 μM (green), 1,107 μM (blue), and 1,582 μM (red) PXN LIM2/3 4A. (D) Combined amide CSPs of 250 μM 15N PXN LIM2/3 4A in the presence of 630 μM integrin β3 vs. residue number of paxillin. Lines indicate average Δδ+ 1× s.d. (yellow), Δδ + 2× s.d. (orange), and Δδ + 3× s.d. (red). (E) In vitro pulldown of recombinant His-SUMO PXN LIM2/3 wt or His-SUMO PXN LIM2/3 4A using Strep-Tag ITGB3 ct wt. PXN LIM2/3 4A shows reduced binding to ITGB3. (F) Spreading of paxillin KO cells, stably reexpressing empty vector (PXN KO), GFP-paxillin wt (PXN wt), or paxillin mutants GFP-PXN ΔLIM4 or GFP-PXN-4A. Starved cells were seeded for 30 or 120 min on the integrin β3 ligand vitronectin. The membrane of fixed cells was stained with CellMask Orange to visualize total cell extension. Scale bars represent 20 μm. Below is the quantification of stained area/individual cell at 30 min (orange) and 120 min (blue). Sample sizes are given in brackets. Statistical significance was calculated using one-way ANOVA followed by Bonferroni multiple comparison test (ns: not significant; *** p ≤ 0.001; ** p ≤ 0.01). The data underlying this panel can be found in S1 Data.
Fig 4
Fig 4. The paxillin–integrin β3 interaction allows cell attachment in the absence of kindlins.
(A) Flow cytometric analysis of NIH Flp-In integrin β3 KO and the indicated ITGB3 wt, ITGB3 Δ8aa, or ITGB3 Δ3aa reexpressing cell lines. Cells were left unstained or stained against mouse integrin β3 or with an isotype matched control IgG. (B) WCLs of cell lines in (A) were probed with the indicated antibodies directed against core FA proteins. Tubulin was used as loading control. (C) Serum starved cells as in (A) were seeded onto vitronectin-coated (5 μg/ml) glass slides for 30 min, and cell area was measured. Shown are mean values and 95% confidence intervals of n = 60 cells per sample from 3 independent experiments. Statistical significance was calculated using one-way ANOVA followed by Bonferroni multiple comparison test (*** p ≤ 0.001). The data underlying this panel can be found in S1 Data. (D) Flow cytometric analysis of Kindlin 1/2 flox cells (KindCtrl), Kindlin 1/2 KO (KindKO), or KindKO cells stably transduced with either murine full-length integrin β3, truncated integrin β3 Δ8aa or Δ3aa, or empty vector backbone (mock). Cells were analysed for their surface expression of various integrin subunits using flow cytometry. (E) WCL from cell lines in (D) were analysed by western blotting with antibodies against indicated core FA proteins. Monoclonal α-tubulin antibody was used as loading control. (F) Serum starved cells as in (D) were seeded on glass coverslips coated with 50 μg/ml vitronectin or poly-Lysine for 4 h. Cells were fixed and stained for endogenous paxillin or talin as indicated. Paxillin- and talin-positive cell attachment sites in ITGB3 wt expressing kindlin1/2 KO cells are indicated with black arrowheads.

Similar articles

Cited by

References

    1. Sun Z, Guo SS, Fassler R. Integrin-mediated mechanotransduction. J Cell Biol. 2016;215(4):445–456. doi: 10.1083/jcb.201609037 - DOI - PMC - PubMed
    1. Hynes RO. Integrins: bidirectional, allosteric signaling machines. Cell. 2002;110(6):673–687. doi: 10.1016/s0092-8674(02)00971-6 - DOI - PubMed
    1. Sun Z, Costell M, Fassler R. Integrin activation by talin, kindlin and mechanical forces. Nat Cell Biol. 2019;21(1):25–31. doi: 10.1038/s41556-018-0234-9 - DOI - PubMed
    1. Moser M, Legate KR, Zent R, Fassler R. The tail of integrins, talin, and kindlins. Science. 2009;324(5929):895–899. doi: 10.1126/science.1163865 - DOI - PubMed
    1. Geiger B, Yamada KM. Molecular architecture and function of matrix adhesions. Cold Spring Harb Perspect Biol. 2011;3(5). cshperspect.a005033 [pii] doi: 10.1101/cshperspect.a005033 - DOI - PMC - PubMed

LinkOut - more resources