. 2024 Oct;634(8033):457-465.
doi: 10.1038/s41586-024-07993-x. Epub 2024 Sep 4.

Early intermittent hyperlipidaemia alters tissue macrophages to fuel atherosclerosis

Affiliations

Early intermittent hyperlipidaemia alters tissue macrophages to fuel atherosclerosis

Minoru Takaoka et al. Nature. 2024 Oct.

Abstract

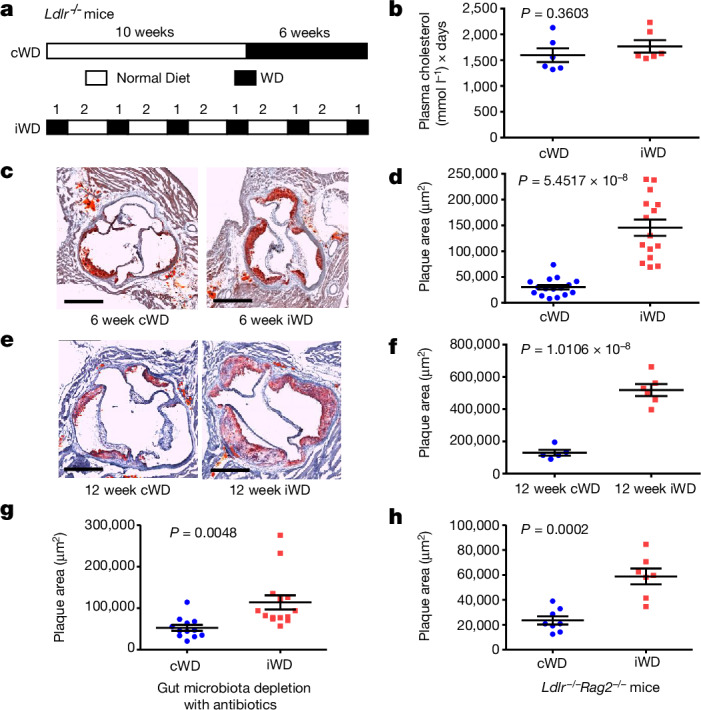
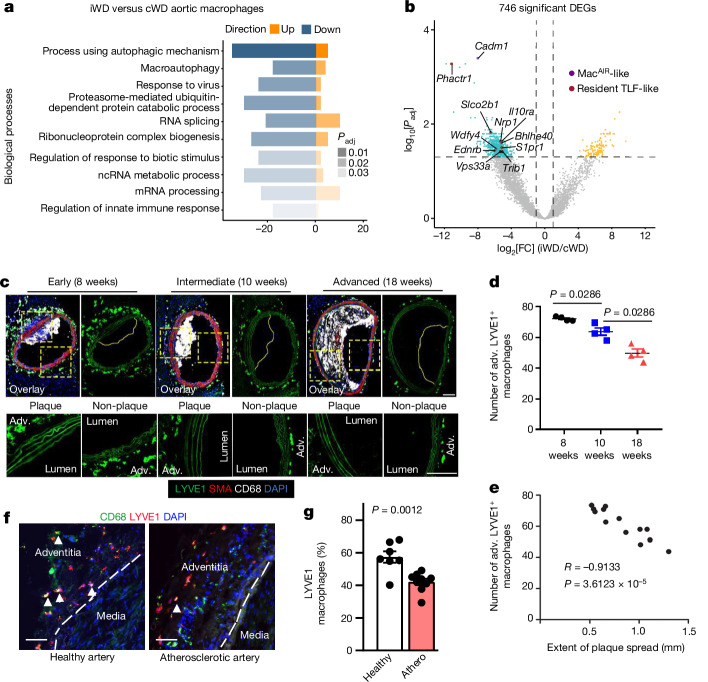
Hyperlipidaemia is a major risk factor of atherosclerotic cardiovascular disease (ASCVD). Risk of cardiovascular events depends on cumulative lifetime exposure to low-density lipoprotein cholesterol (LDL-C) and, independently, on the time course of exposure to LDL-C, with early exposure being associated with a higher risk1. Furthermore, LDL-C fluctuations are associated with ASCVD outcomes2-4. However, the precise mechanisms behind this increased ASCVD risk are not understood. Here we find that early intermittent feeding of mice on a high-cholesterol Western-type diet (WD) accelerates atherosclerosis compared with late continuous exposure to the WD, despite similar cumulative circulating LDL-C levels. We find that early intermittent hyperlipidaemia alters the number and homeostatic phenotype of resident-like arterial macrophages. Macrophage genes with altered expression are enriched for genes linked to human ASCVD in genome-wide association studies. We show that LYVE1+ resident macrophages are atheroprotective, and identify biological pathways related to actin filament organization, of which alteration accelerates atherosclerosis. Using the Young Finns Study, we show that exposure to cholesterol early in life is significantly associated with the incidence and size of carotid atherosclerotic plaques in mid-adulthood. In summary, our results identify early intermittent exposure to cholesterol as a strong determinant of accelerated atherosclerosis, highlighting the importance of optimal control of hyperlipidaemia early in life, and providing insights into the underlying biological mechanisms. This knowledge will be essential to designing effective therapeutic strategies to combat ASCVD.


Conflict of interest statement

The authors declare no competing interests.

Figures

Fig. 1
Fig. 1. Early intermittent hyperlipidaemia accelerates atherosclerosis in mice.
a, The experimental set-up. LDL receptor-deficient (Ldlr−/−) male mice on a normal diet were fed a WD for 6 weeks either continuously (cWD) or intermittently (iWD). b, Calculation of the estimated area under the curve of plasma cholesterol levels over the whole period of the experiments. n = 6 per group. c, Representative photomicrographs of Oil Red O staining of the aortic sinus in the two groups of mice at the end of the experiment. Scale bars, 500 μm. d, The mean atherosclerotic plaque size in the aortic sinus of the two groups of mice. n = 16 (cWD) and n = 15 (iWD). e,f. Ldlr−/− male mice on a normal diet were put under a cWD or iWD diet for 12 weeks. e, Representative photomicrographs of Oil Red O staining of the aortic sinus in the two groups of mice et the end of the experiment. Scale bars, 500 μm. f, The mean atherosclerotic plaque size in the aortic sinus of the two groups of mice. n = 5 (cWD) and n = 6 (iWD). g, Ldlr−/− male mice on a normal diet were put on a cWD versus iWD diet for 6 weeks. To deplete gut microbiota, the two groups of mice were treated with oral antibiotics (Methods) starting from week 9 until the end of the experiment. The mean atherosclerotic plaque size in the aortic sinus of the two groups of mice at the end of the experiment is shown. n = 12 (cWD) and n = 14 iWD. h, Ldlr−/−Rag2−/− male mice on a normal diet were put on a cWD versus iWD diet for 6 weeks. The mean atherosclerotic plaque size in the aortic sinus of the two groups of mice at the end of the experiment is shown. n = 8 (cWD) and n = 7 (iWD). Data are mean ± s.e.m. Statistical analysis was performed using two-tailed unpaired t-tests (d and fh). P values are indicated on the graphs. Source Data
Fig. 2
Fig. 2. Early intermittent hyperlipidaemia alters resident-like arterial macrophages.
Ldlr−/− male mice were put on 3 weeks of cWD versus 3 weeks of iWD (Extended Data Fig. 5a,b). The aortas (n = 6 separated pools of 3 mice each per group) were collected and digested for flow cytometry cell sorting of aortic macrophages and then analysed using bulk RNA-seq (Methods). a, Ten selected GO pathways (biological process) corresponding to the 746 significant DEGs between the iWD and cWD groups (the full list is shown in Supplementary Table 2). Blue and orange colour represents overall gene direction. Grey shading shows the adjusted P value (Padj), calculated using one-sided Fisher exact tests followed by adjustment using the Benjamini–Hochberg procedure. b, Volcano plot for DEGs; yellow/cyan colour highlights upregulated genes in iWD/cWD (Padj < 0.05; two-sided Wald test with Benjamini–Hochberg adjustment) and |log2[fold change]| ≥ 1, and grey colour displays non-significant DEGs. Some significant DEGs related to resident/TLF-like (red) or MacAIR-like (violet) macrophages are highlighted (a full list is provided in Supplementary Table 1). ce, Apoe−/− mice at 6 weeks of age were put on a cWD diet for 8, 10 or 18 weeks to develop early-stage, intermediate or advanced atherosclerosis. Atherosclerotic lesions of the innominate and brachiocephalic arteries were stained with DAPI (nuclei), and antibodies against LYVE1, CD68 and smooth muscle alpha-actin (SMA). c, Representative photomicrographs are shown. Scale bars, 100 μm. d,e, Quantification (mean ± s.e.m.) of adventitial (adv.) LYVE1+CD68+ macrophages (n = 4 per group; two-tailed Mann–Whitney U-test) (d) and correlation with the atherosclerotic plaque size (n = 13) (e). R is the Spearman correlation coefficient (two-tailed). f,g. Tissue sections of healthy (n = 7 individuals) and atherosclerotic (athero.; n = 9 individuals) (Methods) arteries were stained with DAPI (nuclei) and antibodies against LYVE1 and CD68. f, Representative photomicrographs. Scale bars, 30 μm. g, The percentages of adventitial LYVE1+CD68+ macrophages among adventitial CD68+ macrophages. Statistical analysis was performed using two-tailed unpaired t-tests. Source Data
Fig. 3
Fig. 3. Deletion of LYVE1+ resident macrophages accelerates atherosclerosis.
ad, Apoe−/−Lyve1cre+/Csf1rflox/flox mice (n = 7) and Apoe−/−Csf1rflox/flox littermate controls (n = 7) were put on a cWD diet for 20 weeks. a, Representative photomicrographs of aortic sinus atherosclerotic plaques from the two groups of mice are shown, stained with DAPI and antibodies against LYVE1, CD68 and SMA. b, The mean atherosclerotic plaque size in the aortic sinus of the two groups of mice. c, Quantification of the CD68+ area in aortic sinus lesions of the two groups of mice. d, The percentage of necrotic area (Methods) in the aortic sinus lesions of the two groups of mice. el, Csf1rflox/flox (eh) and Lyve1cre+/Csf1rflox/flox (il) female mice were injected with AAV8-D377Y-mPCSK9 to induce hyperlipidaemia. The mice were then subjected to 6 weeks of cWD or 6 weeks of iWD. Csf1rflox/flox: n = 8 (cWD) and n = 9 (iWD) mice; Lyve1cre+/Csf1rflox/flox: n = 11 (cWD) and n = 11 (iWD) mice (Methods and Extended Data Fig. 8h). f,g,j,k, Quantification of the atherosclerotic lesion size (f and j) and necrotic core area (g and k) in the aortic root. h,l, Plasma cholesterol levels at the end of the experiment. Data are mean ± s.e.m. Statistical analysis was performed using two-tailed Mann–Whitney U-tests (bd,g,h and jl). P values are indicated on the graphs. For a,e,i, scale bars, 200 μm. Source Data
Fig. 4
Fig. 4. Alteration of ASCVD pathways in resident arterial macrophages accelerates atherosclerosis.
a, The percentage of genes with link to coronary artery disease (CAD) in GWAS for significant (Padj ≤ 0.05 and |log2[fold change]| ≥ 1) DEGs (209 out of 746) and non-significant (Padj > 0.1 and |log2[fold change]| < 1) DEGs (831 out of 3,461); Padj values were calculated using two-sided two-proportions z-tests. In total, 64 out of 209 DEGs linked to CAD-GWAS could be assigned to three types of arterial macrophages (the gene list is provided in Supplementary Table 7). b, The distribution of 64 CAD-GWAS-related DEGs among macrophage subtypes. c, Volcano plot for CAD-GWAS-associated macrophage DEGs that are differentially expressed in symptomatic (sym.) versus asymptomatic (asym.) human carotid atherosclerotic plaques, obtained after reanalysis of available scRNA-seq data. Yellow/cyan colour highlights upregulated genes in symptomatic/asymptomatic plaques. Significant DEGs related to resident/TLF-like (red), MacAIR/TREM2-like (violet) and IFN/inflammatory-like (IFN/inflam.; grey) macrophages are highlighted. P values were calculated using two-sided Wald tests followed by adjustment using Benjamini–Hochberg correction. d,e Dot plots of macrophage markers from the meta-analysis of scRNA-seq data of mouse (d) and human (e) atherosclerotic plaques. NRP1 is shown for comparison. Res, resident. f,h, Selected GO (biological process) pathways for significant DEGs enriched in human NRP1high versus NRP1low (f) and mouse Nrp1+/+ versus Nrp1−/− (h) macrophages. Gradient red colour represents Padj values calculated using one-side Fisher’s exact tests followed by adjustment with Benjamini–Hochberg correction. The bar size represents the gene count in each pathway. g, Ldlr−/− male mice were lethally irradiated and reconstituted with bone marrow (BM) from Lyz2cre+/Nrp1flox/flox mice and Lyz2cre+/Nrp1+/+ controls. Mice were put on a cWD (n = 14 (Lyz2cre+/Nrp1flox/flox) and n = 14 (Lyz2cre+/Nrp1+/+)) or iWD (n = 9 (Lyz2cre+/Nrp1flox/flox) and n = 7 (Lyz2cre+/Nrp1+/+)) for 6 weeks (Methods). The mean atherosclerotic plaque size in the aortic sinus is shown. Data are mean ± s.e.m. Statistical analysis was performed using two-tailed unpaired t-tests. P values are indicated on the graphs. Source Data
Extended Data Fig. 1
Extended Data Fig. 1. Induction of early intermittent hyperlipidaemia in mice.
a, Experimental set up. LDL receptor-deficient (Ldlr−/−) male mice on normal diet were fed a Western-type diet (WD) for 6 weeks (w) either continuously (cWD) or intermittently (iWD). b, c, Calculation of plasma cholesterol levels in mice subjected to iWD over a period of 6 weeks. Here, examples are given for measurements that started at the end of week 9 and the beginning of week 10 and lasted until end of week 15. b, shows cholesterol measurement over 14 consecutive days (n = 4 per time point). c, shows weekly cholesterol measurements in Ldlr−/− mice under cWD (during the last 6 weeks, n = 6) and iWD (n = 6). d, weekly LDL cholesterol measurements in Ldlr−/− mice under cWD (during the last 6 weeks, n = 6) and iWD (n = 6). e-h, Body weight (n = 6 per group) (e), systolic blood pressure (f), heart rate (g), and plasma corticosterone levels (h) in randomly selected cWD (n = 5) or iWD (n = 6) fed Ldlr−/− mice at the end of the experiment. Mean ± s.e.m.; two-tailed unpaired t-test (e-h). P values are indicated on the graphs. Source Data
Extended Data Fig. 2
Extended Data Fig. 2. Early intermittent hyperlipidaemia accelerates atherosclerosis in mice and increases plaque inflammation and necrosis.
a, LDL receptor-deficient (Ldlr−/−) female mice were fed a Western-type diet (WD) for 6 weeks (w) either continuously (cWD) or intermittently (iWD). Representative photomicrographs (left panels) and mean atherosclerotic plaque size (right panel) in the aortic sinus of the 2 groups of mice are shown (n = 10 cWD and n = 11 iWD). b, Ldlr−/− female mice irradiated and reconstituted with WT bone marrow and subjected to 6 weeks of cWD (n = 10) or iWD (n = 8). Representative photomicrographs (left panels) and mean atherosclerotic plaque size (right panel) in the aortic sinus of the 2 groups of mice are shown. c-g, Ldlr−/− male mice were put on 6 weeks cWD (n = 6) versus 6 weeks iWD (n = 6). Mean plaque area staining positively for MOMA2 (c), CD3 (d), acellular debris (necrosis) (e), αSMA (f), and Sirius red (collagen) (g) in one set of a series of experiments. Mean ± s.e.m.; two-tailed unpaired t-test. P values are indicated on the graphs. Source Data
Extended Data Fig. 3
Extended Data Fig. 3. Various regimens of early intermittent hyperlipidaemia accelerate atherosclerosis in mice.
a, Experimental set up. In group 1, LDL receptor-deficient (Ldlr−/−) male mice first received 3 intermittent weeks of Western diet (WD) at the beginning of the experiment, then 3 weeks of continuous WD just before the end of the experiment (n = 6). Group 2 mice received 6 weeks of intermittent WD (n = 6). b, Mean atherosclerotic plaque size in the aortic sinus of the 2 groups of mice (n = 6 per group). c-j, Experimental set up (c). Ldlr−/− male mice were put on 12 weeks of cWD (n = 5) versus 12 weeks of iWD (n = 6). d, Mean atherosclerotic plaque size on en face aorta in the 2 groups of mice (n = 5 to 6 per group). Mean plaque area staining positively for MOMA2 (e), CD3 (f), αSMA (g), Sirius red (collagen) (h), and acellular debris (necrosis) (i), (n = 5 per group). j, Representative photomicrographs of TUNEL staining (red) and CD68 staining (green) (scale bar = 10 μm) and quantification of the proportion of internalized apoptotic cells in plaques from the 2 groups of mice (n = 5 to 6 per group). k, Experimental set up. Ldlr−/− male mice were put on 6 weeks iWD starting at 6 or 22 weeks of age (n = 11 and n = 9 mice, respectively). l, Mean atherosclerotic plaque size in the 2 groups of mice. Mean ± s.e.m.; two-tailed unpaired t-test (b, d-j, l). P values are indicated on the graphs. Source Data
Extended Data Fig. 4
Extended Data Fig. 4. Early intermittent hyperlipidaemia, gut microbiota, and accelerated atherosclerosis in mice.
a, Experimental set up. LDL receptor-deficient (Ldlr−/−) male mice were fed a normal (ND, control, n = 4) diet or a Western-type diet (WD) for 3 or 6 weeks (w) either continuously (cWD) or intermittently (iWD) (n = 8 cWD 3w, n = 10 iWD 3w, n = 8 cWD 6w, n = 6 iWD 6w). Faecal samples were collected during and at the end of the experiment for analysis of gut microbiota using 16S rRNA sequencing (b-c). b, Principal coordinate analysis reveals distinct separation in microbiota composition due to diet. c, WD-induced changes in microbiome composition on the phylum level (mean relative abundance). d, Experimental set up. Ldlr−/− male mice were put on 6 weeks cWD versus 6 weeks iWD. Treatment with oral antibiotics (see Methods) to deplete the gut microbiota was started at the beginning of week 9. Faecal samples collected at the end of week 8 (before treatment with antibiotics), and at the end of the experiment (after treatment with antibiotics) were analysed using 16S rRNA sequencing (n = 10 per group) (e-g). Bacterial quantification via 16S qPCR (e), principal coordinate analysis (f), and proportional abundance of bacteria (g) demonstrate a great impact of the antibiotic treatment (ABx) on microbiome abundance and composition. h, Plasma levels of total cholesterol at the end of the experiment (n = 10 per group). i, Ldlr−/−/Rag2−/− male mice were put on 6 weeks of cWD (n = 8) versus iWD (n = 7). Calculation of plasma cholesterol levels over the whole period of the experiment. Mean ± s.e.m.; two-tailed unpaired t-test (h, i). P values are indicated on the graphs. Source Data
Extended Data Fig. 5
Extended Data Fig. 5. Impact of early intermittent hyperlipidaemia on atherosclerosis and resident arterial macrophages in mice.
a, LDL receptor-deficient (Ldlr−/−) female mice were fed a Western-type diet (WD) for 3 weeks (w) either continuously (cWD) or intermittently (iWD). b, Mean atherosclerotic plaque size in the aortic sinus of the 2 groups of mice is shown (n = 5 cWD and n = 6 iWD). c, Experimental set up. Cx3cr1creERT2/+ Rosa26LSL-Tomato Ldlr−/− mice on normal diet (ND) received tamoxifen treatment (TAM) to induce Tomato expression. The mice were rested for 2 weeks on normal diet to allow for clearance of labelled blood monocytes. The mice were then placed on 3 weeks of cWD versus 3 weeks of iWD. Mice were killed at the end of the experiment for analysis of fate-mapped Tomato+ resident arterial macrophages (n = 15 cWD; n = 21 iWD). d, Representative photomicrographs showing staining for macrophages (CD45+ CD68+) to quantify the numbers of intimal MacAIR macrophages. e, Total CD45+ CD68+ macrophage count in the aortic arch of the 2 groups of mice at the end of the experiment. f, Percentage of Tomato+ CD45+ CD68+ macrophages in the intima (MacAIR) (among intimal CD45+ CD68+ macrophages) of the 2 groups of mice. g, Number of Tomato+ CD45+ CD68+ intimal (MacAIR) macrophages. h, Number of Tomato+ adventitial (adv.) macrophages. n = 15 cWD and n = 21 iWD (e-h). Mean ± s.e.m.; two-tailed unpaired t-test (b, e-h). P values are indicated on the graphs. Source Data
Extended Data Fig. 6
Extended Data Fig. 6. Impact of macrophage expression of SPIC on the development of atherosclerosis in mice.
a, Dotplot (n = 1 to 8) with mean (red bar) for common transcription factor (TF) binding motifs enriched in significant DEGs and their corresponding normalized enrichment score (NES) difference with nonsignificant DEGs. The order of the TFs corresponds to the mean of Padj value. Two-tailed proportion z-test performed then adjusted by Benjamini-Hochberg (BH) correction. SPIC is highlighted. Detailed information is provided in Supplementary Table 4. b, Barplot of selected 6 Gene Ontology (Biological Process) pathways for significant DEGs enriched in SPIC binding motifs. Gradient blue colour represents the padj values (one-sided Fisher exact test then adjusted by BH correction), and the size of the bar represents the number of genes that contribute to the corresponding pathways. Detailed information is provided in Supplementary Table 5. c, Ldlr−/− female mice were lethally irradiated and reconstituted with bone marrow (BM) from Lyz2Cre+/ Spicflox/flox mice (n = 27) and Lyz2Cre+/ Spicflox/+ controls (n = 22) (see Methods). After 5 weeks of recovery mice were put on cWD for 8 weeks to assess the role of myeloid-specific expression of SPIC on atherogenesis. Mean atherosclerotic plaque size in the aortic sinus of the 2 groups of mice is shown. d, Mean atherosclerotic plaque size in the en face aorta of the 2 groups of mice (n = 12 Lyz2Cre+/ Spicflox/flox and n = 10 Lyz2Cre+/ Spicflox/+). e, Mean plasma total cholesterol levels at the end of the experiment (n = 24 Lyz2Cre+/ Spicflox/flox and n = 25 Lyz2Cre+/ Spicflox/+). f, Ldlr−/− female mice were lethally irradiated and reconstituted with Lyz2Cre+/ Spicflox/flox bone marrow. After recovery, mice were put on 6 weeks of cWD (n = 9) or 6 weeks iWD (n = 7). Mean atherosclerotic plaque size in the aortic sinus of the 2 groups of mice. Mean ± s.e.m.; two-tailed unpaired t-test (c-f). P values are indicated on the graphs. Source Data
Extended Data Fig. 7
Extended Data Fig. 7. Time-dependent changes in the expression of prototypical genes associated with distinct arterial macrophage subsets in Ldlr−/− mice subjected to continuous western diet.
a, A heatmap of selected markers for each macrophage subtype (Res = Resident; MacAIR/Trem2; IFN/Inflam = interferon/inflammatory) derived from analysis of the mouse public data set on scRNASeq of atherosclerotic lesions in Ldlr−/− mice subjected to various durations of continuous high fat diet (HFD). Hierarchical clustering is shown based on log2FoldChange. b, Barplot for three macrophage subtype proportions for each duration of continuous HFD.
Extended Data Fig. 8
Extended Data Fig. 8. Deletion of LYVE1+ resident macrophages in atherosclerotic mice.
a, Representative examples of staining for LYVE1, CD68, SMA and DAPI in arteries of Apoe−/− Csf1rflox/flox and Apoe−/− Lyve1Cre+/ Csf1rflox/flox mice. b, Quantification of adventitial LYVE1+ macrophages in the 2 groups of mice (n = 7 Csf1rflox/flox and n = 4 Lyve1Cre+/− Csf1rflox/flox). c, Plasma levels of total cholesterol at the end of the experiment in the different groups of mice fed on cWD for 18 weeks (n = 15 Apoe−/− Csf1rflox/flox and n = 15 Apoe−/− Lyve1Cre+/ Csf1rflox/flox mice. d, Quantification of SMA+ area in lesion cap of the aortic sinus (n = 7 per group). e, Quantification of collagen I area in the plaques of the aortic sinus (n = 7 per group). Mean ± s.e.m.; two-tailed unpaired t-test (b-e). P values are indicated on the graphs. f, Representative photomicrographs (scale bar = 50 µm) of plaques stained with anti-CD68, DAPI, and TUNEL. g, Number of free apoptotic (TUNEL+DAPI+) cells in aortic lesions of Apoe−/− Csf1rflox/flox (n = 4) and Apoe−/− Lyve1Cre+wt Csf1rflox/flox (n = 5) were quantified (see Methods). Mean ± s.e.m.; two-tailed unpaired t-test. P values are indicated on the graphs. h, Experimental design. Csf1rflox/flox and Lyve1Cre+/ Csf1rflox/flox female mice were injected with AAV8-D377Y-mPCSK9 to induce hyperlipidaemia. The mice were then subjected to 6 weeks of cWD or 6 weeks of iWD. Csf1rflox/flox mice (n = 8 cWD and n = 9 iWD), and Lyve1Cre+/ Csf1rflox/flox mice (n = 11 cWD and n = 11 iWD) (see Methods). i, Representative values of plasma cholesterol levels at the indicated time points. Mean ± s.e.m. (n = 5 per group). Source Data
Extended Data Fig. 9
Extended Data Fig. 9. Gene ontology enrichment analysis on 220 human coronary artery disease causal genes.
Gene ontology enrichment analysis of biological processes (BP) was conducted on 220 coronary artery disease causal genes prioritized in Aragam et al.. A total of 178 out of 220 causal genes contributed to the GO enrichment analysis, and 867 enriched BP were identified (see Supplementary Table 11). The most enriched pathways and their corresponding causal gene network are plotted here using cnetplot function in R. Significant differentially expressed genes in our RNASeq data of aortic macrophages from iWD vs cWD (see Supplementary Table 1) are shown here (red: upregulated in iWD, blue: downregulated in iWD). NRP1 is represented in the most enriched biological pathways, which are related to cell migration, actin filament organization, and vascular development. Source Data
Extended Data Fig. 10
Extended Data Fig. 10. Deletion of NRP1 expression in myeloid cells of atherosclerotic mice.
a, Experimental set up. LDL receptor-deficient (Ldlr−/−) male mice were lethally irradiated and reconstituted with Lyz2Cre+/ Nrp1flox/flox (Nrp1−/−) or Lyz2Cre+/ Nrp1+/+ (WT) bone marrow. After recovery, mice were put on a Western-type diet (WD) for 6 weeks (w) either continuously (cWD) or intermittently (iWD). b, Nrp1 gene expression by qPCR in peritoneal macrophages at the end of the experiment (n = 12 per group). Fold change is relative to Rplp0 (36B4) expression. c, Mean plasma total cholesterol levels at the end of the experiment in the 4 groups of mice (n = 8 cWD WT and Nrp−/−, n = 7 iWD WT, and n = 9 iWD Nrp−/−). d, Bone-marrow-derived macrophages were generated from Lyz2Cre+/ Nrp1+/+ (WT) and Lyz2Cre+/ Nrp1flox/flox mice and cultured with PKH26-labelled apoptotic Jurkat cells (see Methods). e, f, Quantification of the percentage of macrophages (M0 in e and M1 in f) with internalized apoptotic cells; two separate experiments with n = 3 biological replicates/group. Mean ± s.e.m.; two-tailed unpaired t-test. P values are indicated on the graphs. Source Data

Comment in

Similar articles

Cited by

References

    1. Domanski, M. J. et al. Time course of LDL cholesterol exposure and cardiovascular disease event risk. J. Am. Coll. Cardiol.76, 1507–1516 (2020). - PubMed
    1. Kim, M. K. et al. Cholesterol variability and the risk of mortality, myocardial infarction, and stroke: a nationwide population-based study. Eur. Heart J.38, 3560–3566 (2017). - PMC - PubMed
    1. Kim, M. K. et al. Associations of variability in blood pressure, glucose and cholesterol concentrations, and body mass index with mortality and cardiovascular outcomes in the general population. Circulation138, 2627–2637 (2018). - PubMed
    1. Bangalore, S. et al. Visit-to-visit low-density lipoprotein cholesterol variability and risk of cardiovascular outcomes: insights from the TNT trial. J. Am. Coll. Cardiol.65, 1539–1548 (2015). - PubMed
    1. Duewell, P. et al. NLRP3 inflammasomes are required for atherogenesis and activated by cholesterol crystals. Nature464, 1357–1361 (2010). - PMC - PubMed

MeSH terms

Substances