. 2024 Dec 5;64(6):2400562.
doi: 10.1183/13993003.00562-2024. Print 2024 Dec.

A novel in vitro tubular model to recapitulate features of distal airways: the bronchioid

Affiliations

A novel in vitro tubular model to recapitulate features of distal airways: the bronchioid

Elise Maurat et al. Eur Respir J. .

Abstract

Background: Airflow limitation is the hallmark of obstructive pulmonary diseases, with the distal airways representing a major site of obstruction. Although numerous in vitro models of bronchi already exist, there is currently no culture system for obstructive diseases that reproduces the architecture and function of small airways. Here, we aimed to engineer a model of distal airways to overcome the limitations of current culture systems.

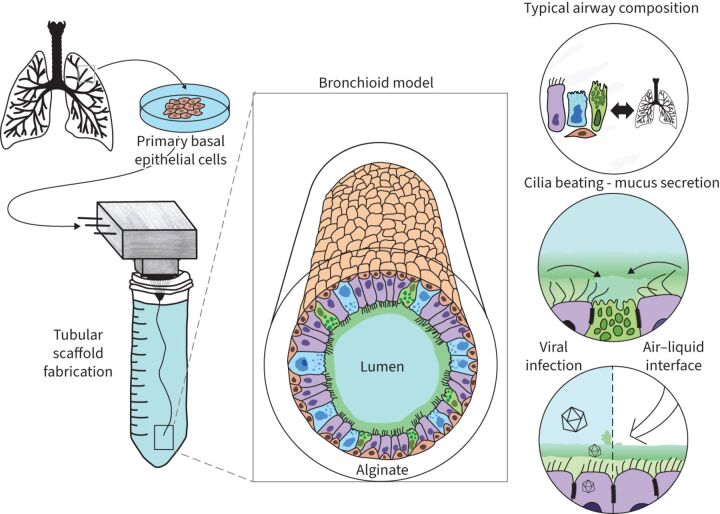
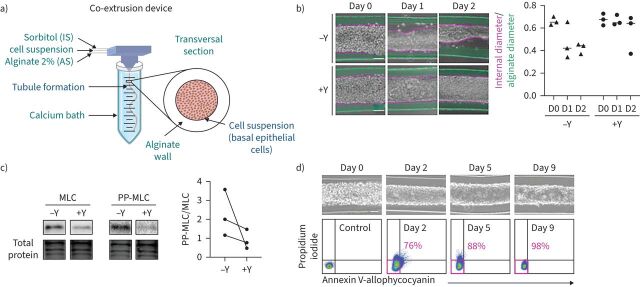
Methods: We developed a so-called bronchioid model by encapsulating human bronchial adult stem cells derived from clinical samples in a tubular scaffold made of alginate gel.

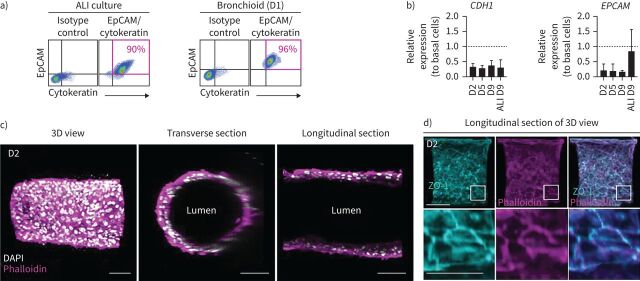
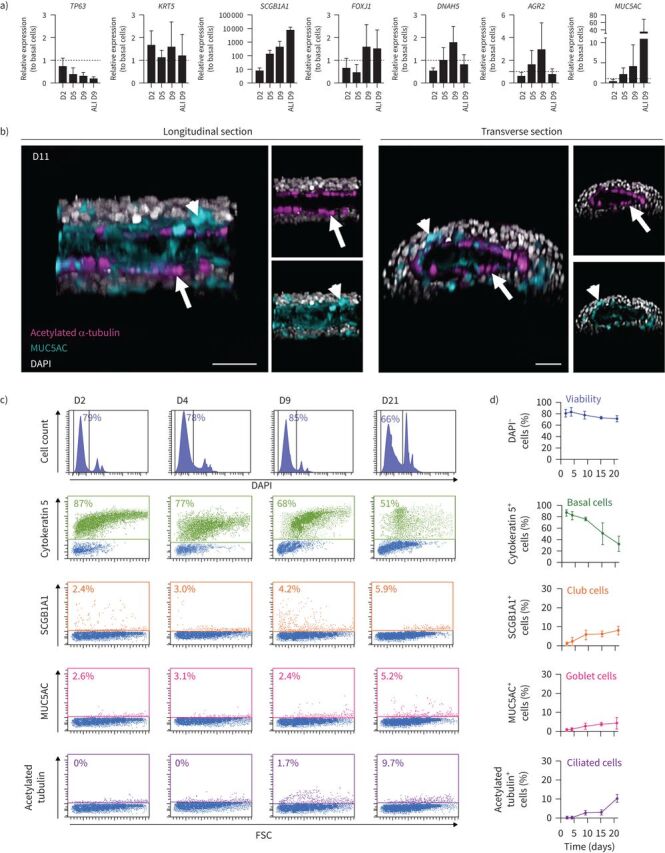
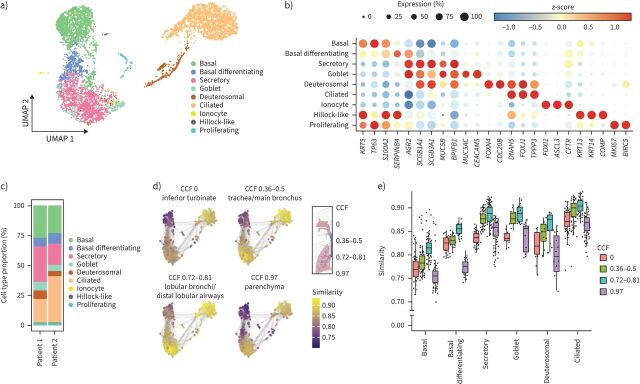
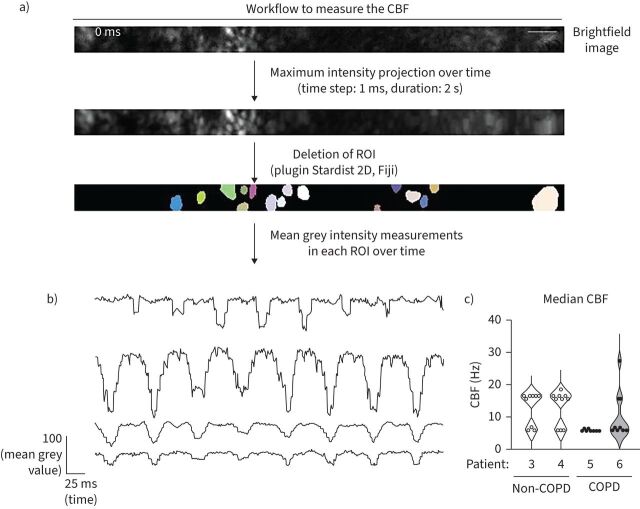
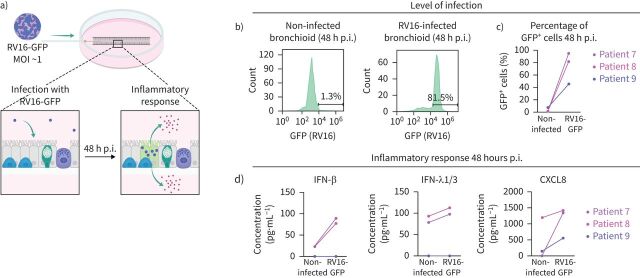
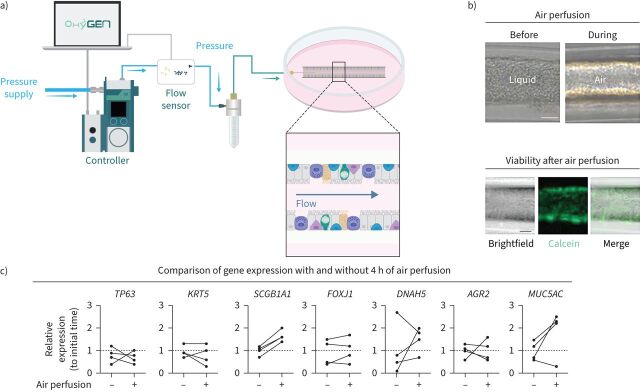
Results: This template drives the spontaneous self-organisation of epithelial cells into a tubular structure. Fine control of the level of contraction is required to establish a model of the bronchiole, which has a physiologically relevant shape and size. Three-dimensional imaging, gene expression and single-cell RNA-sequencing analysis of bronchioids made of bronchial epithelial cells revealed tubular organisation, epithelial junction formation and differentiation into ciliated and goblet cells. Ciliary beating was observed, at a decreased frequency in bronchioids made of cells from COPD patients. The bronchioid could be infected by rhinovirus. An air-liquid interface was introduced that modulated gene expression.

Conclusion: Here, we provide a proof of concept of a perfusable bronchioid with proper mucociliary and contractile functions. The key advantages of our approach, such as the air‒liquid interface, lumen accessibility, recapitulation of pathological features and possible assessment of clinically relevant end-points, will make our pulmonary organoid-like model a powerful tool for preclinical studies.


Conflict of interest statement

Conflict of interest: I. Dupin and P. Berger have two patents (EP number 3050574 and EP number 20173595). I. Dupin, P. Henrot and M. Zysman report grants from the Fondation Bordeaux Université. M. Zysman reports personal fees from AstraZeneca, Boehringer Ingelheim, CSL Behring, Novartis, Chiesi and GlaxoSmithKline, and non-financial support from Lilly. P. Berger reports grants and personal fees from Novartis; personal fees and non-financial support from Chiesi, Boehringer Ingelheim, AstraZeneca and Sanofi; and personal fees from Menarini and TEVA, outside the submitted work. All other authors declare that they have no competing interests.

Figures

None
Overview of the study: the bronchioid model.
FIGURE 1
FIGURE 1
The formation of an alginate tube filled with primary basal epithelial cells is called a “bronchioid”. a) Schematic of the device used to generate bronchioids. Created with BioRender.com. The three solutions were injected simultaneously by a computer-controlled pump inside a three-dimensional-printed device soaked in a 100 mM calcium bath. b) Left panel: brightfield images of bronchioids over time, with (+) or without (−) 10 µM Y-27632 (Y). The green and pink dotted lines indicate the external (alginate tube) and internal (epithelial tube) limits, respectively. Scale bars: 100 µm. Right panel: quantification of external and internal diameters (at least 10 measurements along the same tube for each condition, n=3 experiments). The medians are represented as horizontal lines. c) Immunoblots and analysis of myosin light chain (MLC) II and double-phospho-MLC (PP-MLC) (Thr18, Ser19) expression on day 2 in bronchioid tissue from three different donors (n=3). Total protein was used as a loading control. d) Upper panels: brightfield images of bronchioids cultured with 10 µM Y-27632. Scale bars: 100 µm. Lower panels: dot plots showing propidium iodide fluorescence (y-axis) versus annexin V-allophycocyanin fluorescence (x-axis) in cells dissociated from bronchioids and analysed by flow cytometry at the indicated time points. The percentages of propidium iodide annexin V cells are shown in pink. IS: intermediate d-sorbitol solution; AS: alginate solution.
FIGURE 2
FIGURE 2
Characterisation of the epithelial nature of cells in the bronchioid model. a) Dot plots representing epithelial cell adhesion molecule (EpCAM)-peridinin chlorophyll protein complex (PerCP)-cyanine 5.5 fluorescence (y-axis) versus pan cytokeratin-fluorescein isothiocyanate fluorescence (x-axis) of cells dissociated from two-dimensional (2D) air–liquid interface (ALI) culture and bronchioids at day (D) 1. The gating strategy is shown in the left panels. The percentages of EpCAM+ cytokeratin+ cells are shown in pink. b) Expression of the genes CDH1 and EPCAM in bronchioids over time and in cells dissociated from 2D culture at day 9 after ALI introduction. The bronchioid and ALI culture samples were obtained from six and three different donors, respectively, and data are presented as mean±sd. Gene expression was normalised to that of the housekeeping genes PPIA, RPL13 and GusB and expressed relative to that of basal epithelial cells in 2D submerged culture. c, d) Longitudinal and transverse sections and three-dimensional (3D) views of 3D reconstructions obtained from Z-stack confocal images of a 2-day-old bronchioid stained for F-actin (phalloidin, magenta) and nuclei (DAPI, white) (c) and F-actin (magenta), zonula occludens-1 (ZO-1) (cyan) and nuclei (white) (d). Scale bars: 100 µm and 50 µm in the magnified lower panel.
FIGURE 3
FIGURE 3
Differentiation induction of primary bronchial epithelial cells into bronchioids. a) Expression of the genes TP63, KRT5, SCGB1A1, FOXJ1, DNAH5, AGR2 and MUC5AC in bronchioids over time and in cells dissociated from two-dimensional (2D) culture at day (D) 9 after air–liquid interface (ALI) introduction. The bronchioid and ALI culture samples were obtained from six and three different donors, respectively, and data are presented as mean±sd. Gene expression was normalised to that of the housekeeping genes PPIA, RPL13 and GusB and expressed relative to that of basal epithelial cells in 2D submerged culture. b) Longitudinal and transverse sections and three-dimensional (3D) views of 3D reconstructions obtained from Z-stack confocal images of 11-day-old bronchioids stained for acetylated α-tubulin (magenta), mucin-5AC (MUC5AC) (cyan) and nuclei (white). Arrows: ciliated cells; arrowheads: goblet cells. Scale bars: 50 µm. c) Histograms of representative cell counts (y-axis) versus DAPI fluorescence (x-axis) of cells dissociated from bronchioids at the indicated time points. Dot plots represent cytokeratin-5/secretoglobin family 1A member 1 (SCGB1A1)/MUC5AC/acetylated tubulin fluorescence (y-axis) versus forward side scatter (FSC) (x-axis). DAPI cells, cytokeratin 5+, SCGB1A1+, MUC5AC+ and acetylated tubulin+ cells are shown in dark blue, green, orange, pink and purple, respectively. d) Percentages of DAPI, cytokeratin 5+, SCGB1A1+, MUC5AC+ and acetylated tubulin+ cells over time. The samples are from four different non-COPD donors and data are presented as mean±sd.
FIGURE 4
FIGURE 4
Single-cell transcriptome profiling in the bronchioid model. a) Uniform Manifold Approximation and Projection (UMAP) representation of single-cell RNA-sequencing (scRNA-seq) transcriptomic data showing the different cell types detected in 21-day-old bronchioids from two different non-COPD donors (Patients 1 and 2). b) Dot plot showing scaled mean expression (colour) and percentage of expressing cells (dot size) of selected marker genes in the indicated cell groups. c) Relative abundance of cell types identified in bronchioids from Patients 1 and 2. d) Bronchioid neighbourhoods, positioned with respect to the UMAP embedding of each index cell, are coloured by the maximum correlation value across primary lung tissue neighbourhoods from four distinct anatomical locations based on the common coordinate framework (CCF) established in the HLCA [31]. e) Box plot depicting neighbourhood similarities of bronchioid neighbourhoods with primary lung tissue neighbourhoods in the respective CCF category over major cell types identified in the bronchioid scRNA-seq data. The centre line indicates the median, the box limits indicate the upper and lower quantiles, and the whiskers indicate 1.5× interquartile range. In d and e, the bronchioid neighbourhoods were constructed from cells integrated across the two samples.
FIGURE 5
FIGURE 5
Fast Fourier transform (FFT) analysis of ciliary movement using high-speed video microscopy analysis. a) Schematic workflow for measuring ciliary beat frequency (CBF). Representative brightfield image corresponding to a part of a bronchioid at day 20. The coloured areas correspond to the regions of interest (ROIs) determined by the plugin Stardist 2D of the Fiji software on the image generated by a maximum intensity projection over time. Scale bar: 5 µm. b) Representative measurements of the mean intensity in ROIs over time. The main frequency was determined using a FFT in each ROI. c) Violin plots showing the CBF of bronchioids derived from four different patients (non-COPD Patients 3 and 4, COPD Patients 5 and 6). For each patient, individual values represent median CBFs, determined in 9–10 fields.
FIGURE 6
FIGURE 6
Rhinovirus infection in the bronchioid model. a) Experimental design for testing rhinovirus type 16 (RV16)-green fluorescent protein (GFP) infection. b) Histograms showing representative cell counts (y-axis) versus GFP fluorescence (x-axis) under different conditions at 48 h post-infection (p.i.). The percentages indicate the number of GFP+ cells. c) Percentages of GFP+ cells 48 h p.i. in bronchioids from three different donors (Patients 7, 8 and 9) under non-infected and infected (RV16-GFP) conditions. d) Interferon β (IFN-β), interferon λ1/3 (IFN-λ1/3) and C-X-C motif chemokine ligand 8 (CXCL8) concentrations in the medium from bronchioid cultures under different conditions. MOI: multiplicity of infection.
FIGURE 7
FIGURE 7
Establishment of an air–liquid interface in the bronchioid model. a) Setup for air perfusion. Created with BioRender.com. b) Upper panel: brightfield images of bronchioids before and during air perfusion. Lower panel: brightfield and fluorescence images of bronchioids after 4 h of perfusion and calcein staining. Scale bars: 200 µm. c) Comparison of gene expression (TP63, KRT5, SCGB1A1, FOXJ1, DNAH5, AGR2, MUC5AC) in bronchioid tissue from four different non-COPD donors after 4 h of perfusion. Data are presented as mean±sd. Gene expression was normalised to that of the housekeeping genes PPIA, RPL13 and GusB and expressed relative to that of bronchioids before perfusion (initial time).

Comment in

References

    1. Ghorani V, Boskabady MH, Khazdair MR, et al. . Experimental animal models for COPD: a methodological review. Tob Induc Dis 2017; 15: 25. doi:10.1186/s12971-017-0130-2 - DOI - PMC - PubMed
    1. Nizamoglu M, Joglekar MM, Almeida CR, et al. . Innovative three-dimensional models for understanding mechanisms underlying lung diseases: powerful tools for translational research. Eur Respir Rev 2023; 32: 230042. doi:10.1183/16000617.0042-2023 - DOI - PMC - PubMed
    1. Jorissen M, Van der Schueren B, Van den Berghe H, et al. . Contribution of in vitro culture methods for respiratory epithelial cells to the study of the physiology of the respiratory tract. Eur Respir J 1991; 4: 210–217. doi:10.1183/09031936.93.04020210 - DOI - PubMed
    1. Adler KB, Cheng PW, Kim KC. Characterization of guinea pig tracheal epithelial cells maintained in biphasic organotypic culture: cellular composition and biochemical analysis of released glycoconjugates. Am J Respir Cell Mol Biol 1990; 2: 145–154. doi:10.1165/ajrcmb/2.2.145 - DOI - PubMed
    1. Dabaghi M, Carpio MB, Moran-Mirabal JM, et al. . 3D (bio)printing of lungs: past, present, and future. Eur Respir J 2023; 61: 2200417. doi:10.1183/13993003.00417-2022 - DOI - PubMed

LinkOut - more resources