. 2024 Sep 4;81(1):383.
doi: 10.1007/s00018-024-05416-8.

G protein selectivity profile of GPR56/ADGRG1 and its effect on downstream effectors

Affiliations

G protein selectivity profile of GPR56/ADGRG1 and its effect on downstream effectors

Raida Jallouli et al. Cell Mol Life Sci. .

Abstract

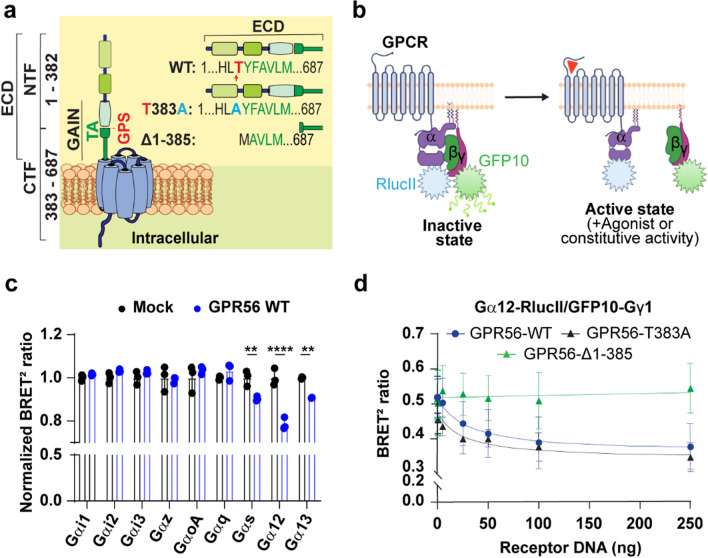
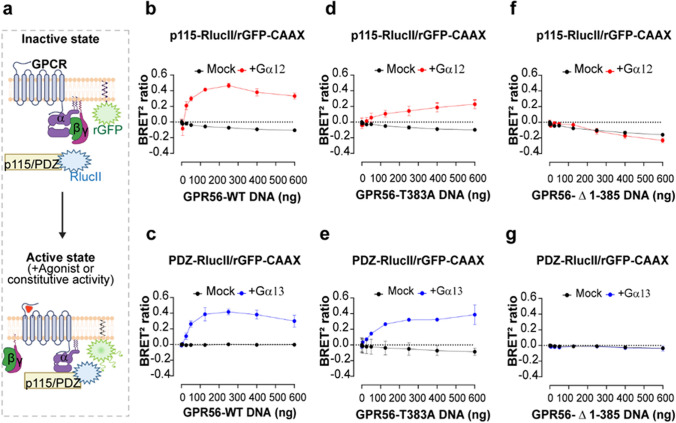
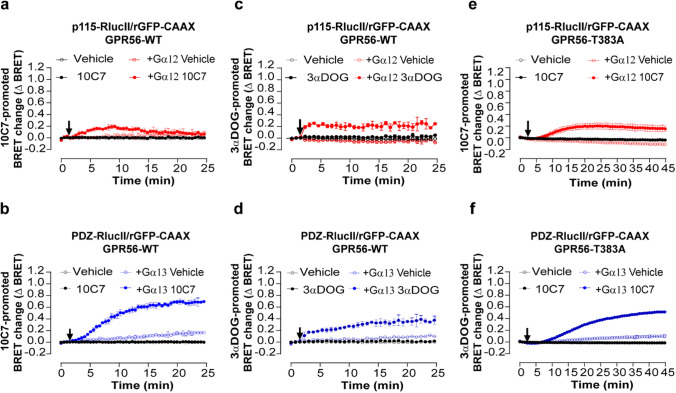
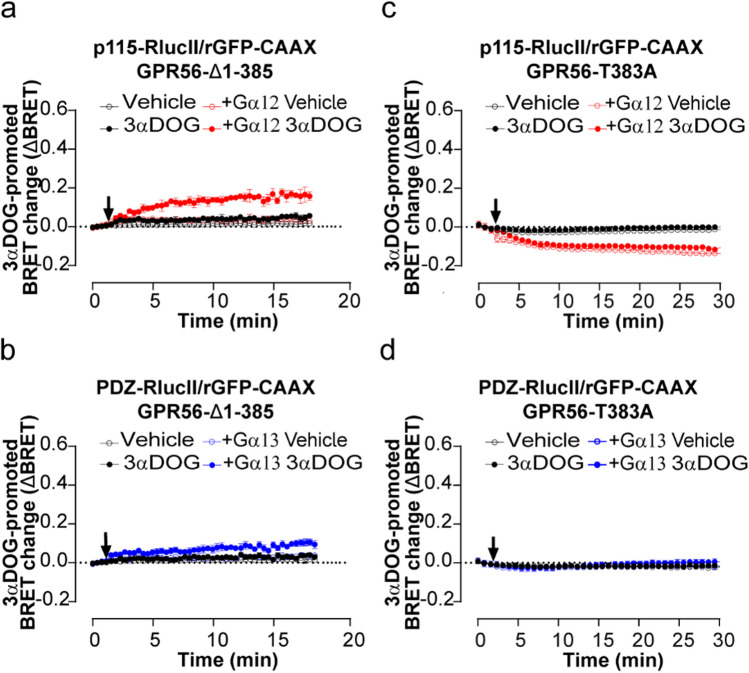
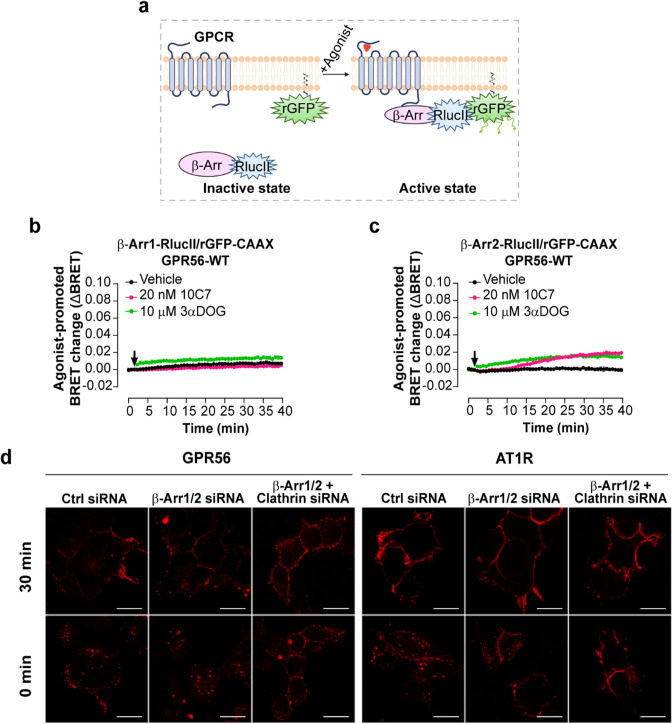
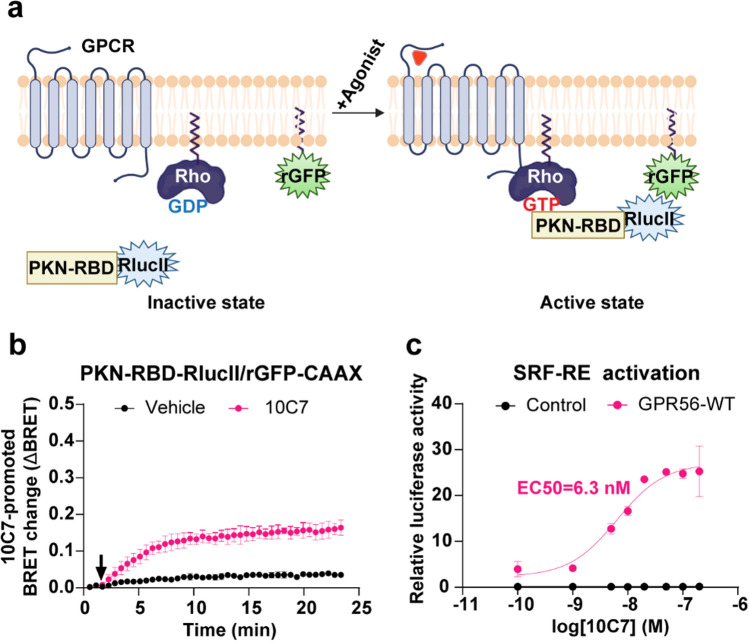
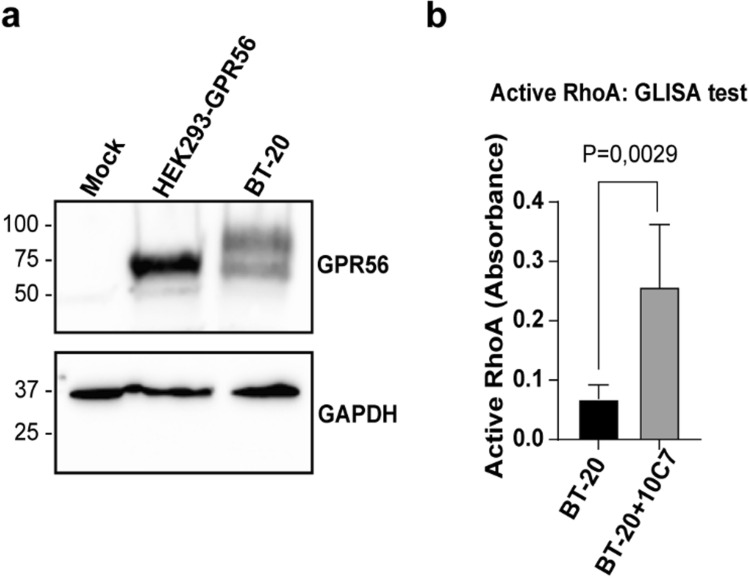
GPR56, an adhesion G-protein coupled receptor (aGPCRs) with constitutive and ligand-promoted activity, is involved in many physiological and pathological processes. Whether the receptor's constitutive or ligand-promoted activation occur through the same molecular mechanism, and whether different activation modes lead to functional selectivity between G proteins is unknown. Here we show that GPR56 constitutively activates both G12 and G13. Unlike constitutive activation and activation with 3-α-acetoxydihydrodeoxygedunin (3αDOG), stimulation with an antibody, 10C7, directed against GPR56's extracellular domain (ECD) led to an activation that favors G13 over G12. An autoproteolytically deficient mutant, GPR56-T383A, was also activated by 10C7 indicating that the tethered agonist (TA) exposed through autocatalytic cleavage, is not required for this activation modality. In contrast, this proteolysis-resistant mutant could not be activated by 3αDOG indicating different modes of activation by the two ligands. We show that an N-terminal truncated GPR56 construct (GPR56-Δ1-385) is devoid of constitutive activity but was activated by 3αDOG. Similarly to 3αDOG, 10C7 promoted the recruitment of β-arrestin-2 but GPR56 internalization was β-arrestin independent. Despite the slow activation mode of 10C7 that favors G13 over G12, it efficiently activated the downstream Rho pathway in BT-20 breast cancer cells. These data show that different GPR56 ligands have different modes of activation yielding differential G protein selectivity but converging on the activation of the Rho pathway both in heterologous expressions system and in cancer cells endogenously expressing the receptor. 10C7 is therefore an interesting tool to study both the processes underlying GPR56 activity and its role in cancer cells.

Keywords: BRET; G protein-coupled receptor; GPR56; RhoGEF; Signaling; Trafficking.


Conflict of interest statement

Some of the BRET biosensors used in the present study are protected by patents and are licensed to Domain Therapeutics for commercial use. MB is the president of Domain Therapeutics scientific advisory board. All other authors declare no conflict of interest.

Figures

Fig. 1
Fig. 1
BRET G protein coupling profile of GPR56-WT and Mutants. a Schematic representation of GPR56-WT, autocleavage deficient mutant GPR56-T383A and GPR56-Δ1-385 mutant in which 3 amino acids were deleted from the N terminus of the Tethered Agonist (TA). GPS is indicated by a red arrow and Tethered Agonist sequence is TYFAVLM in which T (red) is the GPS P1’ residue. Abbreviations are, ECD, Extracellular domain; NTF, N-terminal fragment; CTF, C-terminal fragment, GAIN, GPCR Autoproteolysis Inducing domain; TA, Tethered Agonist, GPS, GPCR Proteolysis Site; ICD, Intracellular Domain. b Schematic diagram of the G protein BRET biosensor (GABY) which measures the activation of G protein resulting in distancing of RlucII from GFP10 and a decrease of BRET signal, created with BioRender.com. c BRET-based G protein activation profile in the presence of 125ng GPR56-WT cDNA represented by the BRET ratio normalized with that measured in the absence of GPR56-WT using empty vector (Mock). d Representative GPR56-WT and mutants BRET2 ratio curves with the Gα12 BRET sensor in relation to increasing receptor DNA concentrations (0-250ng). Data are represented as the mean values of at least three independent experiments of three replicates each (mean ± SD)
Fig. 2
Fig. 2
BRET-based effector membrane translocation assay to assess GPR56-WT and mutants’ constitutive activity. a Schematic representation of the GEMTA ebBRET-based biosensors to monitor Gα12/13 protein activation. Upon constitutive or agonist stimulation, activated Gα12 or Gα13 subunits recruit their selective downstream effector p115-RhoGEF-RlucII or PDZ-RhoGEF-RlucII to the plasma membrane (PM) where rGFP-CAAX is anchored, leading to an increase of ebBRET, created with BioRender.com. b, d, f Constitutive activation of Gα12 protein by GPR56-WT and mutants, reflected by the selective recruitment of the p115-RhoGEF effector to the PM. c, e, g Constitutive activation of Gα13 proteins by GPR56-WT and mutants, reflected by the selective recruitment of the PDZ-RhoGEF effector to the PM. HEK293 ΔGα12/13 cells were transiently transfected with an increasing amount of receptor DNA and p115-RhoGEF-RlucII/rGFP-CAAX or PDZ-RhoGEF-RlucII/rGFP-CAAX biosensors, supplemented or not with the Gα12 or Gα13 subunits, respectively. Data are represented as the mean ± SD of three biological replicates
Fig. 3
Fig. 3
10C7 potentiates activation of Gα12/13 with a preference for Gα13 and GAIN cleavage is not necessary for 10C7 activation of GPR56-T383A. a, b Time course of 10C7-mediated p115-RhoGEF (a) or PDZ-RhoGEF (b) recruitment to the PM. HEK293 ΔGα12/13 cells were co-transfected with 125 ng of GPR56-WT, p115-RhoGEF-RlucII (a) or PDZ-RhoGEF-RlucII (b) and rGFP-CAAX alone or with Gα12 or Gα13 respectively, and stimulated with 20nM 10C7 or vehicle (arrow). c, d Time course of 3αDOG-mediated activation of Gα12/13 reflected by p115-RhoGEF (c) or PDZ-RhoGEF (d) recruitment to PM. HEK293 ΔGα12/13 cells co-transfected with 125 ng of WT and p115-RhoGEF-RlucII (c) or PDZ-RhoGEF-RlucII (d) and rGFP-CAAX, alone or with Gα12 or Gα13 subunits and stimulated with 10 µM of 3αDOG or vehicle (DMSO 0,1%) (arrow). e, f Time course of 10C7-mediated p115-RhoGEF (e) or PDZ-RhoGEF (f) recruitment to the PM. HEK293 ΔGα12/13 cells were co-transfected with 125 ng GPR56-T383A, p115 or PDZ-RhoGEF-RlucII and rGFP-CAAX alone or with Gα12 or Gα13 subunits and stimulated with 20 nM 10C7 or vehicle (arrow). Data are represented as the means ± SD of triplicate in a representative experiment that was repeated three times with similar results. Note that some control curves and error bars overlap with each other
Fig. 4
Fig. 4
3αDOG activates GPR56-Δ1-385 but not GPR56-T383A. a, c Time course of 3αDOG-mediated activation of Gα12/13 proteins reflected by p115-RhoGEF or b, d PDZ-RhoGEF recruitment to the PM. HEK293T ΔGα12/13 cells were co-transfected with either 400 ng of Δ1-385 (a, b) or 125 ng of T383A (c, d), and p115-RhoGEF-RlucII (a, c) or PDZ-RhoGEF-RlucII (b, d) and rGFP-CAAX, alone or in presence of Gα12 or Gα13 subunits and stimulated with 10 µM of 3αDOG or vehicle (DMSO 0,1%) (arrow). Data are represented as the means ± SD of triplicate in a representative experiment that was repeated three times with similar results Note that some control curves and error bars overlap with each other
Fig. 5
Fig. 5
10C7 and 3αDOG trigger the recruitment of β-arrestin2 to the PM and GPR56-WT is internalized in a β-arrestin-independent but clathrin-dependent manner. a Schematic representation of the β-arrestin-based biosensors to monitor β-Arr1/2 recruitment to the PM. Upon agonist stimulation, the β-Arr1/2-RlucII-tagged is recruited by the receptor to the PM inducing an increase BRET with the membrane-anchored rGFP (rGFP-CAAX), created with BioRender.com. b, c Time course of 10C7 and 3αDOG-mediated β-arrestin1 (b) or β-arrestin2 (c) recruitment to PM by GPR56-WT. HEK293 cells were co-transfected with 125 ng GPR56-WT and β-arrestin1 or β-arrestin2 -RlucII/rGFP-CAAX sensors before stimulation with 20 nM of 10C7, 10 µM of 3αDOG or Vehicle (arrow). Data are represented as the means ± SD of triplicate in a representative experiment that was repeated three times with similar results. d Myc-GPR56 stable HEK293 cells were treated with non-targeting siRNA (CTL-siRNA) or β-arrestin1 and 2 specific siRNA alone (β-arr1/2-siRNA) or together with clathrin siRNA (Clathrin-siRNA), and also transfected with Flag-AT1R. Cell surface GPR56 and AT1R were labeled with anti-Myc polyclonal antibody and anti-Flag monoclonal antibody, respectively. To allow internalization, GPR56 and AT1R were stimulated with 10C7 (15 µg/mL)) and Ang II (1µM), respectively, for 30 min at 37 °C. Cells were fixed, processed for immunofluorescence and analyzed by confocal microscopy. Scale bars:10 μm
Fig. 6
Fig. 6
10C7 activates RhoA pathway with overexpressed GPR56-WT. a Schematic representation of the ebBRET-based biosensor to monitor Rho activation, created with BioRender.com. Upon agonist stimulation, the RlucII-tagged Rho-binding domain (RBD) of PKN (PKN-RBD-RlucII) recruitment to the PM increases ebBRET with the membrane-anchored rGFP (rGFP-CAAX). b Time course of 10C7-mediated recruitment of the RlucII-tagged PKN-RBD-RlucII to the PM. HEK293 cells were transfected with 125 ng of GPR56-WT along with PKN-RBD-RlucII and rGFP-CAAX and stimulated with the Vehicle (buffer) or 20 nM of 10C7 (arrow). For kinetics results, data are represented as the means ± SD of triplicate in a representative experiment that was repeated three times with similar results. c Dose-response curves of SRF-RE reporter gene activation induced by increasing concentrations of 10C7. Results are expressed as a relative luciferase activity (ratio of Firefly over Renilla luminescence). Data represent the mean of three independent experiments ± SD
None
Fig. 7 10C7 triggers RhoA activation in endogenously GPR56 expressing cells. a Western blotting of whole-cell lysates of HEK293 cells expressing empty vector (Mock) or GPR56-WT, and BT20 cells using 10C7 mAb. b RhoA ELISA test on 10C7 stimulated BT-20 cell line. BT20 cells were treated with 10C7 for 15 min and active RhoA was measured by ELISA. ELISA experiment was carried out in duplicates from three independent experiments. Results are expressed as means ± SD and statistical significance analysis was performed using paired Student’s t test, *p < 0.05

Update of

Similar articles

Cited by

References

    1. Pierce KL, Premont RT, Lefkowitz RJ (2002) Seven-transmembrane receptors. Nat Rev Mol Cell Biol 3:639–650. 10.1038/nrm908 10.1038/nrm908 - DOI - PubMed
    1. Hua Li J, Jain S, McMillin SM et al (2013) A novel experimental strategy to assess the metabolic effects of selective activation of a Gq-Coupled receptor in hepatocytes in vivo. Endocrinology 154:3539–3551. 10.1210/en.2012-2127 10.1210/en.2012-2127 - DOI - PMC - PubMed
    1. Nickols HH, Conn PJ (2014) Development of allosteric modulators of GPCRs for treatment of CNS disorders. Neurobiol Dis 61:55–71. 10.1016/j.nbd.2013.09.013 10.1016/j.nbd.2013.09.013 - DOI - PMC - PubMed
    1. Fredriksson R, Gloriam DEI, Höglund PJ et al (2003) There exist at least 30 human G-protein-coupled receptors with long Ser/Thr-rich N-termini. Biochem Biophys Res Commun 301:725–734. 10.1016/s0006-291x(03)00026-3 10.1016/s0006-291x(03)00026-3 - DOI - PubMed
    1. Kaiser F, Morawski M, Krohn K et al (2021) Adhesion GPCR GPR56 expression profiling in human tissues. Cells 10:3557. 10.3390/cells10123557 10.3390/cells10123557 - DOI - PMC - PubMed

MeSH terms

LinkOut - more resources