. 2024 Sep 4;15(1):406.
doi: 10.1007/s12672-024-01287-4.

Natural killer (NK) cells-related gene signature reveals the immune environment heterogeneity in hepatocellular carcinoma based on single cell analysis

Affiliations

Natural killer (NK) cells-related gene signature reveals the immune environment heterogeneity in hepatocellular carcinoma based on single cell analysis

Zhirong Ye et al. Discov Oncol. .

Abstract

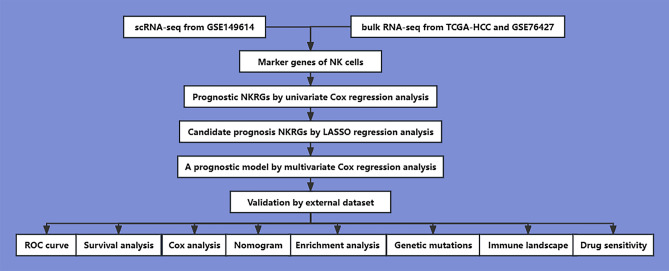
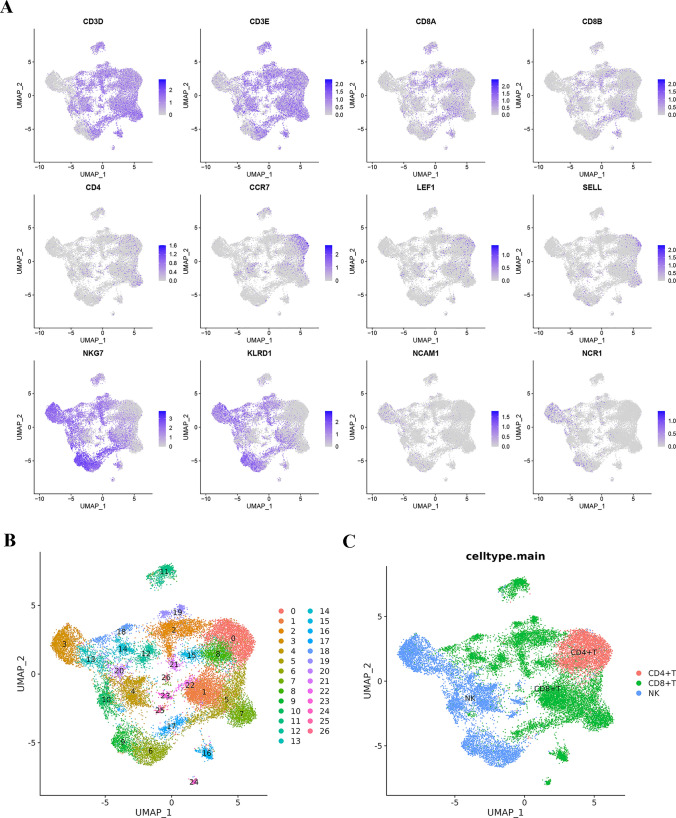
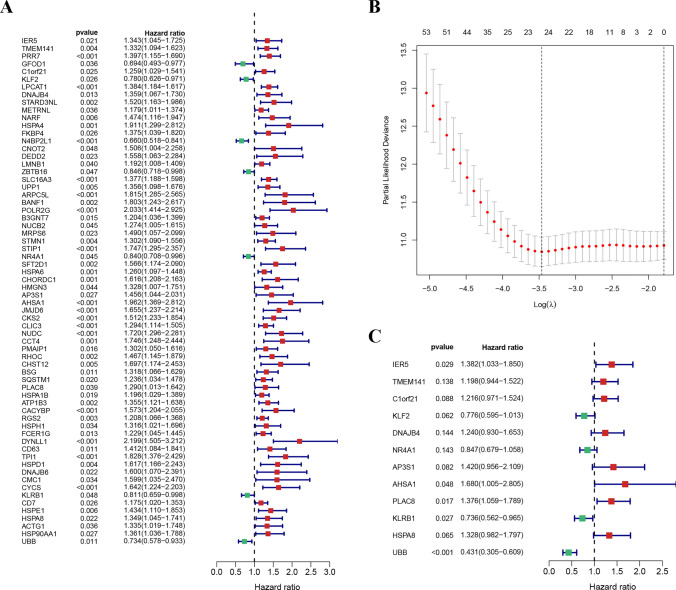
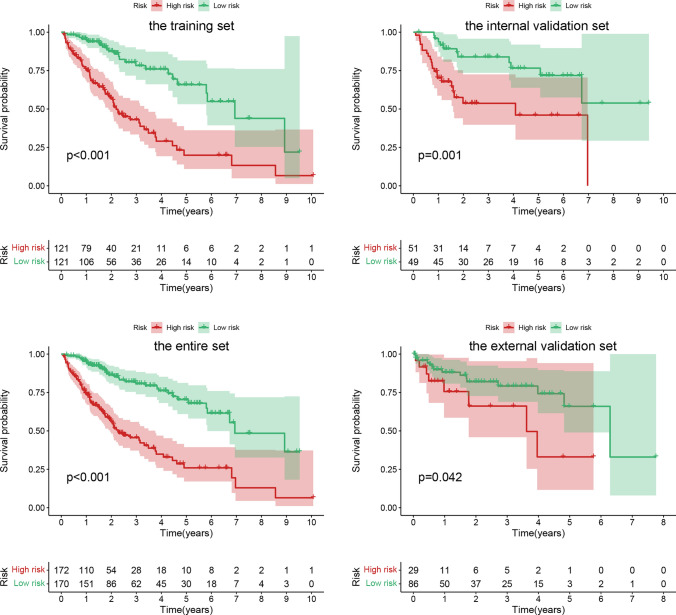
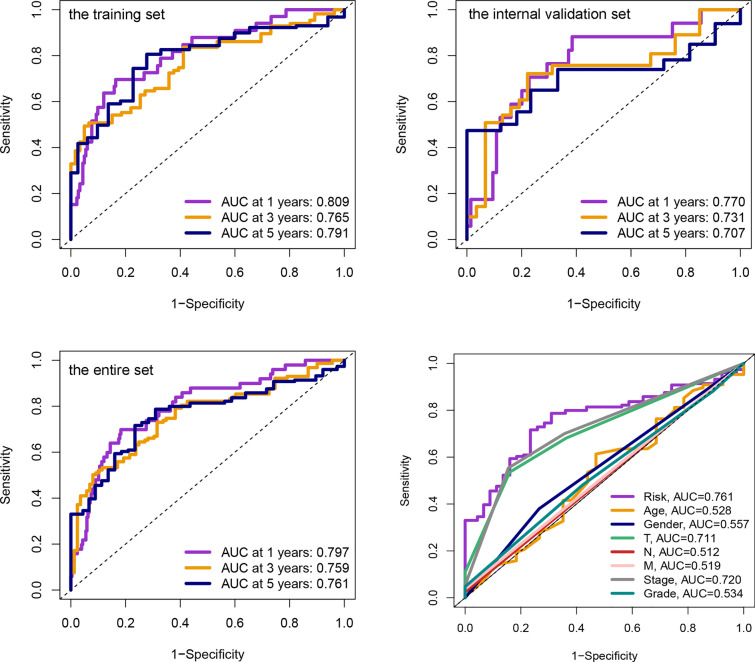
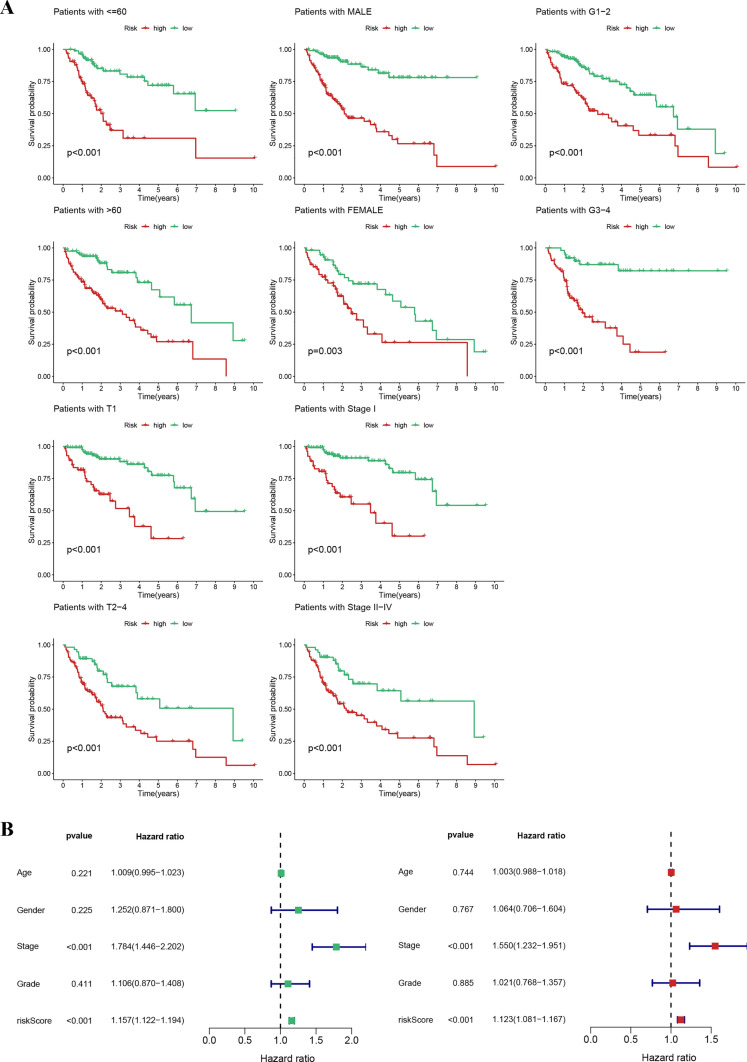
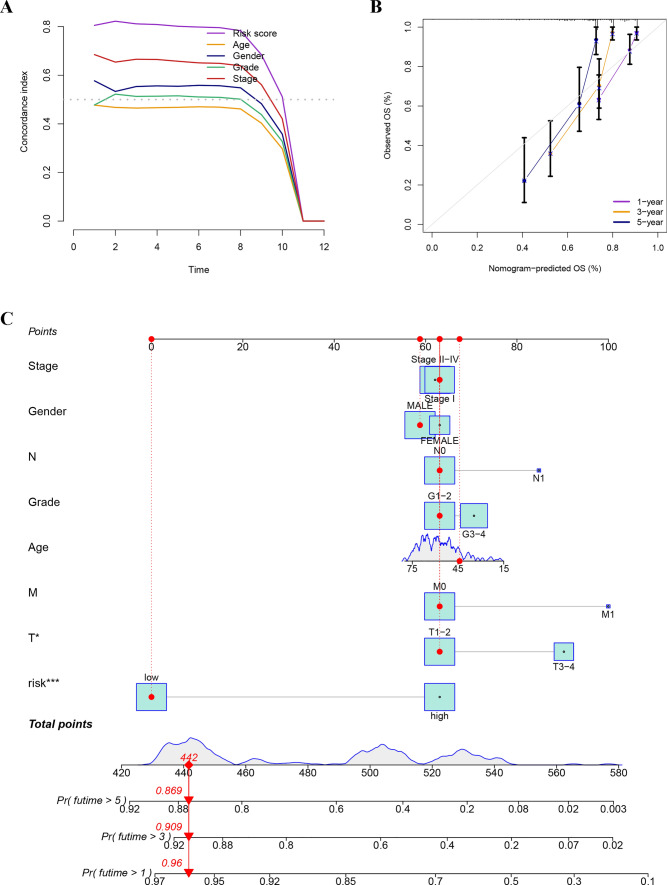
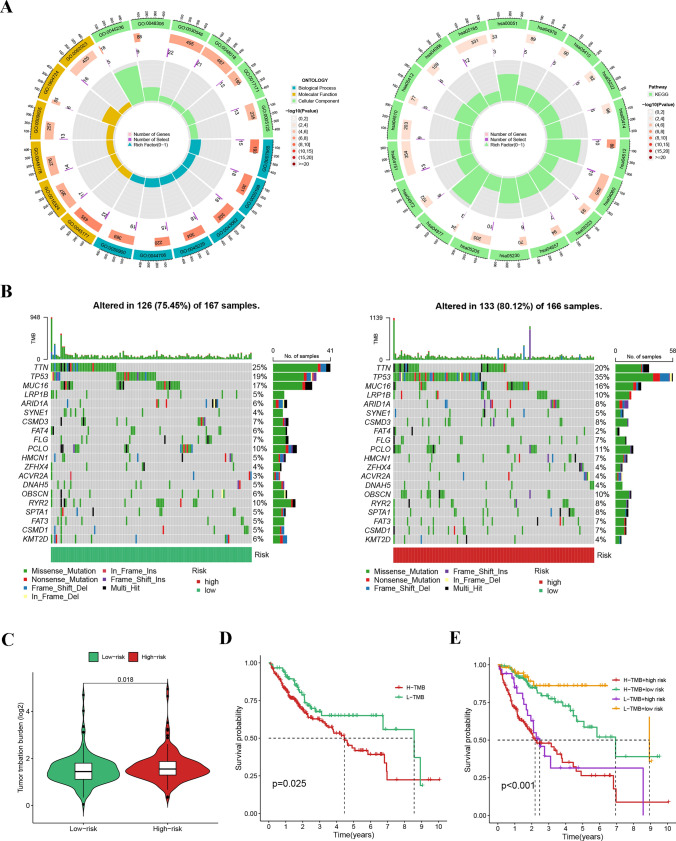
The early diagnosis of liver cancer is crucial for the treatment and depends on the coordinated use of several test procedures. Early diagnosis is crucial for precision therapy in the treatment of the hepatocellular carcinoma (HCC). Therefore, in this study, the NK cell-related gene prediction model was used to provide the basis for precision therapy at the gene level and a novel basis for the treatment of patients with liver cancer. Natural killer (NK) cells have innate abilities to recognize and destroy tumor cells and thus play a crucial function as the "innate counterpart" of cytotoxic T cells. The natural killer (NK) cells is well recognized as a prospective approach for tumor immunotherapy in treating patients with HCC. In this research, we used publicly available databases to collect bioinformatics data of scRNA-seq and RNA-seq from HCC patients. To determine the NK cell-related genes (NKRGs)-based risk profile for HCC, we isolated T and natural killer (NK) cells and subjected them to analysis. Uniform Manifold Approximation and Projection plots were created to show the degree of expression of each marker gene and the distribution of distinct clusters. The connection between the immunotherapy response and the NKRGs-based signature was further analyzed, and the NKRGs-based signature was established. Eventually, a nomogram was developed using the model and clinical features to precisely predict the likelihood of survival. The prognosis of HCC can be accurately predicted using the NKRGs-based prognostic signature, and thorough characterization of the NKRGs signature of HCC may help to interpret the response of HCC to immunotherapy and propose a novel tumor treatment perspective.

Keywords: Hepatocellular carcinoma; Immunotherapy; Machine learning; Natural killer cells; Precision therapy; Prognostic signature.


Conflict of interest statement

The authors declare no competing interests.

Figures

Fig. 1
Fig. 1
Flow chart
Fig. 2
Fig. 2
A Expression levels for individual marker genes, which are critical in defining various cell populations. B Visualization depicting cluster distribution, delineated by distinct gene expression markers. C Annotations of cell types such as CD4+ T cells, CD8+ T cells, and NK cells, providing insights into the distinct functional states within each subgroup. The precise characterization of these cell populations and their functional annotations enhance our understanding of the cell composition within the biological system under study, contributing to the comprehensiveness of our findings
Fig. 3
Fig. 3
A Prognostic NK-cell related genes (NKRGs; n = 66) using univariate Cox analysis. B Candidate NKRGs (n = 25) using LASSO analysis. C A model containing 12 NKRGs using multivariate Cox analysis
Fig. 4
Fig. 4
The patients assigned with a low-risk score showed significantly higher probabilities of survival in several sets, including the training set, internal validation set, complete set, and external validation set
Fig. 5
Fig. 5
The receiver operating characteristic curve area for the model was > 0.7 in the training, internal validation, and entire sets
Fig. 6
Fig. 6
A Individuals classified within the low-risk group demonstrated superior survival probabilities across all clinical subcategories. B Both univariate and multivariate Cox regression analyses confirmed the prognostic independence of the risk score
Fig. 7
Fig. 7
A Comparative analysis using the C-index revealed that our model predicts outcomes more accurately than does the assessment based on clinical characteristics alone. B Our predicted and actual survival rates agreed strongly in the correlation plot, indicating the potential of the model as a reliable predictor of outcomes in this population. C A nomogram integrating both our model and key clinical features improved the accuracy of survival probability predictions
Fig. 8
Fig. 8
A An analysis of pathways within the DEGs indicated marked enrichment in key biological processes, including cell adhesion, cytokine interactions, immune responses, and the mechanisms of tumorigenesis. B In our study, ten genes, including TTN, MUC16, TP53, ARID1A, LRP1B, CSMD3, SYNE1, FAT4, FLG, and PCLO, were found to be the most often mutated, as identified through a comprehensive genetic analysis. C The high-risk scores group had more pronounced TMB scores, indicating that the group would respond more favorably to immunotherapy. D and E Survival rates differed significantly across groups classified by both TMB and risk scores, suggesting that the integration of these metrics may offer improved prognostic precision
Fig. 9
Fig. 9
A Correlation analyses revealed positive associations between the risk score and several immune components, including regulatory T cells, CD4+ T cells, neutrophils, M0 and M1 macrophages, and B cells, negative correlations were observed with endothelial cells, M2 macrophages, and CD8+ T cells. B Significant variations in immunological activities, with notable cytolytic activity, inflammation promotion, responses of type I and II interferon (IFN), as well as MHC class I responses, were observed between different risk score groups in our study. C Marked disparities in the expression of genes related to immune checkpoints were evident among the groups differentiated by risk scores. These variations were statistically underscored with significance markers:*p < 0.05, **p < 0.01, and ***p < 0.001
Fig. 10
Fig. 10
Identification of chemotherapeutics commonly used in clinical practice
Fig. 11
Fig. 11
Identification of novel candidate compounds

Similar articles

References

    1. Forner A, Reig M, Bruix J. Hepatocellular carcinoma. Lancet. 2018;391(10127):1301–14. 10.1016/S0140-6736(18)30010-2 - DOI - PubMed
    1. Ganesan P, Kulik LM. Hepatocellular carcinoma: new developments. Clin Liver Dis. 2023;27(1):85–102. 10.1016/j.cld.2022.08.004 - DOI - PubMed
    1. Hartke J, Johnson M, Ghabril M. The diagnosis and treatment of hepatocellular carcinoma. Semin Diagn Pathol. 2017;34(2):153–9. 10.1053/j.semdp.2016.12.011 - DOI - PubMed
    1. Llovet JM, Kelley RK, Villanueva A, Singal AG, Pikarsky E, Roayaie S, et al. Hepatocellular carcinoma. Nat Rev Dis Primers. 2021;7(1):6. - PubMed
    1. Parikh ND, Pillai A. Recent advances in hepatocellular carcinoma treatment. Clin Gastroenterol Hepatol. 2021;19(10):2020–4. 10.1016/j.cgh.2021.05.045 - DOI - PubMed

LinkOut - more resources