Differences in Topography of Individual Amyloid Brain Networks by Amyloid PET Images in Healthy Control, Mild Cognitive Impairment, and Alzheimer's Disease
- PMID: 39231884
- PMCID: PMC11950497
- DOI: 10.1007/s10278-024-01230-7
Differences in Topography of Individual Amyloid Brain Networks by Amyloid PET Images in Healthy Control, Mild Cognitive Impairment, and Alzheimer's Disease
Abstract
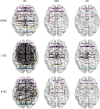
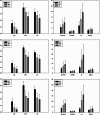
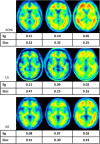
Amyloid plaques, implicated in Alzheimer's disease, exhibit a spatial propagation pattern through interconnected brain regions, suggesting network-driven dissemination. This study utilizes PET imaging to investigate these brain connections and introduces an innovative method for analyzing the amyloid network. A modified version of a previously established method is applied to explore distinctive patterns of connectivity alterations across cognitive performance domains. PET images illustrate differences in amyloid accumulation, complemented by quantitative network indices. The normal control group shows minimal amyloid accumulation and preserved network connectivity. The MCI group displays intermediate amyloid deposits and partial similarity to normal controls and AD patients, reflecting the evolving nature of cognitive decline. Alzheimer's disease patients exhibit high amyloid levels and pronounced disruptions in network connectivity, which are reflected in low levels of global efficiency (Eg) and local efficiency (Eloc). It is mostly in the temporal lobe where connectivity alterations are found, particularly in regions related to memory and cognition. Network connectivity alterations, combined with amyloid PET imaging, show potential as discriminative markers for different cognitive states. Dataset-specific variations must be considered when interpreting connectivity patterns. The variability in MCI and AD overlap emphasizes the heterogeneity in cognitive decline progression, suggesting personalized approaches for neurodegenerative disorders. This study contributes to understanding the evolving network characteristics associated with normal cognition, MCI, and AD, offering valuable insights for developing diagnostic and prognostic markers.
Keywords: Amyloid plaque; Brain connectivity; Graph theory; Positron emission tomography.
© 2024. The Author(s) under exclusive licence to Society for Imaging Informatics in Medicine.
Conflict of interest statement
Declarations. Ethics Approval: The respective Institutional Review Boards of Chang Gung Memorial Hospital at Linkou and Kaohsiung branches approved the recruitment of participants from these two institutions. Consent to Participate: All participants provided written informed consent before participating in the study. The original image data were anonymized, and patients were not identifiable. Consent for Publication: All authors and our institution approve the submission and publication of this manuscript. We confirm that we have read the journal’s position on issues involved in ethical publication and affirm that this report is consistent with those guidelines. Conflicts of Interests: The authors declare that they have no conflicts of interest.
Figures


Similar articles
-
Anterior-temporal network hyperconnectivity is key to Alzheimer's disease: from ageing to dementia.Brain. 2025 Jun 3;148(6):2008-2022. doi: 10.1093/brain/awaf008. Brain. 2025. PMID: 39813142 Free PMC article.
-
Regional Disconnection in Alzheimer Dementia and Amyloid-Positive Mild Cognitive Impairment: Association Between EEG Functional Connectivity and Brain Glucose Metabolism.Brain Connect. 2020 Dec;10(10):555-565. doi: 10.1089/brain.2020.0785. Epub 2020 Nov 23. Brain Connect. 2020. PMID: 33073602 Free PMC article.
-
Characterizing brain tau and cognitive decline along the amyloid timeline in Alzheimer's disease.Brain. 2024 Jun 3;147(6):2144-2157. doi: 10.1093/brain/awae116. Brain. 2024. PMID: 38667631 Free PMC article.
-
A survey on applications and analysis methods of functional magnetic resonance imaging for Alzheimer's disease.J Neurosci Methods. 2019 Apr 1;317:121-140. doi: 10.1016/j.jneumeth.2018.12.012. Epub 2018 Dec 26. J Neurosci Methods. 2019. PMID: 30593787 Review.
-
The role of quantitative EEG biomarkers in Alzheimer's disease and mild cognitive impairment: applications and insights.Front Aging Neurosci. 2025 Apr 23;17:1522552. doi: 10.3389/fnagi.2025.1522552. eCollection 2025. Front Aging Neurosci. 2025. PMID: 40336944 Free PMC article. Review.
References
-
- Davis KM, Ryan JL, Aaron VD, Sims JB: PET and SPECT imaging of the brain: History, technical considerations, applications, and radiotracers. Seminars in Ultrasound, CT and MRI 41:521-529, 2020 - PubMed
-
- Kaneta T: PET and SPECT imaging of the brain: a review on the current status of nuclear medicine in Japan. Japanese Journal of Radiology 38:343-357, 2020 - PubMed
-
- Braak H, Braak E: Neuropathological stageing of Alzheimer-related changes. Acta Neuropathol 82:239-259, 1991 - PubMed
-
- Thal DR, Rüb U, Orantes M, Braak H: Phases of A beta-deposition in the human brain and its relevance for the development of AD. Neurology 58:1791-1800, 2002 - PubMed
MeSH terms
Substances
Grants and funding
LinkOut - more resources
Full Text Sources
Medical
