. 2024 Sep 4;15(1):7740.
doi: 10.1038/s41467-024-50825-9.

Single-molecule digital sizing of proteins in solution

Affiliations

Single-molecule digital sizing of proteins in solution

Georg Krainer et al. Nat Commun. .

Abstract

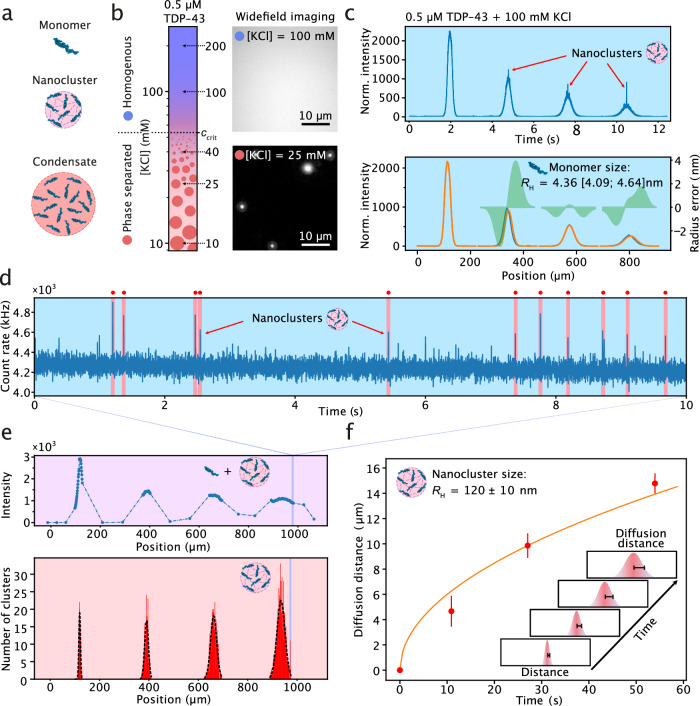
The physical characterization of proteins in terms of their sizes, interactions, and assembly states is key to understanding their biological function and dysfunction. However, this has remained a difficult task because proteins are often highly polydisperse and present as multicomponent mixtures. Here, we address this challenge by introducing single-molecule microfluidic diffusional sizing (smMDS). This approach measures the hydrodynamic radius of single proteins and protein assemblies in microchannels using single-molecule fluorescence detection. smMDS allows for ultrasensitive sizing of proteins down to femtomolar concentrations and enables affinity profiling of protein interactions at the single-molecule level. We show that smMDS is effective in resolving the assembly states of protein oligomers and in characterizing the size of protein species within complex mixtures, including fibrillar protein aggregates and nanoscale condensate clusters. Overall, smMDS is a highly sensitive method for the analysis of proteins in solution, with wide-ranging applications in drug discovery, diagnostics, and nanobiotechnology.


Conflict of interest statement

G.K., K.L.S., W.E.A., and T.P.J.K. declare the following competing interests. Parts of this work have been the subject of a patent application filed by Cambridge Enterprise Limited, a fully-owned subsidiary of the University of Cambridge. Inventors: Krainer, G.; Saar, K.L.; Arter, W.E., Knowles, T.P.J.; Applicant: Cambridge Enterprise Ltd.; Title: Highly sensitive biomolecule detection and quantification. Publication Number: WO/2021/176065; Publication Date: 10.09.2021; International Application No.: PCT/EP2021/055614; International Filing Date: 05.03.2021. The remaining authors declare no competing interests.

Figures

Fig. 1
Fig. 1. Working principle and experimental implementation of smMDS.
a Schematic of the microfluidic chip design and integrated confocal scanning optics. The most relevant components are depicted. The dashed box highlights the scan region. The arrow indicates the scan trajectory across the four innermost channels. b Principle of continuous scan measurements. The confocal detection volume is moved at a constant speed across the microfluidic device, enabling the recording of diffusion profiles from direct intensity readouts. This mode enables recording of diffusion profiles under ensemble conditions. An exemplary diffusion profile from a continuous scan measurement of human serum albumin (HSA) at 100 nM is shown. Diffusion profiles are shown as blue lines, experimental fits as orange lines, and the local radius errors as green bands. Extracted hydrodynamic radii RH [with errors] are given as an inset. The local radius error is calculated as the difference between the hydrodynamic radius derived from the global fit and that obtained from the best matching profile at that specific position. The error range for RH is derived from the global fit, determined through a Taylor expansion of the least-square fit and through error propagation (see Supplementary Note 1 for details). c Principle of step scan measurements. The confocal detection volume is moved in a stepwise manner across the device, collecting data at defined positions with each step for a certain period of time in the form of time traces (see panel d). This mode enables detection of individual molecules and the creation of diffusion profiles from single-molecule digital counting. An exemplary diffusion profile from a step scan measurement of α-synuclein at 10 pM is shown. d A single-molecule time trace (lower panel) as obtained from a step scan measurement is shown. The time trace in the upper panel is a zoom-in view of the red shaded area in the lower panel. Red dots and highlighting indicate bursts detected by the burst-search algorithm. The bin time is 1 ms in all traces.
Fig. 2
Fig. 2. Sizing of proteins from bulk to single-molecule conditions by smMDS.
a The sensitivity of smMDS and its capability to size proteins from bulk to single-molecule conditions was evaluated by measuring the size of human serum albumin (HSA) at varying protein concentrations. b Diffusion profiles for HSA as obtained from continuous scan measurements. From top to bottom: 1 µM, 10 nM, 1 nM, 20 pM HSA. Diffusion profiles are shown as blue lines, experimental fits as orange lines, and errors as green bands. Extracted hydrodynamic radii RH [with errors] are given as insets. For definitions of errors, please refer to the legend of Fig. 1b. Schematics on the left depict the decrease in concentration. c Diffusion profiles for HSA obtained from step scan measurements under single-molecule conditions. From top to bottom: 20 pM, 10 pM, 1 pM, 100 fM HSA. Diffusion profiles are shown as blue lines, experimental fits as orange lines, and errors as green bands. Extracted hydrodynamic radii RH [with errors] are given as insets. For definitions of errors, please refer to the legend of Fig. 1b. Schematics on the left depict the decrease in concentration. The two highlighted plots on the top are exemplary single-molecule time trajectories recorded at two channel positions, as indicated. Red dots and highlighting indicate bursts detected by the burst-search algorithm. d RH of HSA as obtained by continuous scan (orange points) and step scan (blue points) measurements. Data points (mean) were obtained from at least triplicate measurements at the respective sample concentration (see source data for number of repeats). Error bars denote standard deviations. The dashed line indicates the average literature value (mean) for HSA (RH = 3.73 ± 0.40 nm) with the green band depicting the standard deviation of literature values. Source data are provided as a Source Data file.
Fig. 3
Fig. 3. Sizing of proteins and protein assemblies by smMDS.
a Experimentally determined hydrodynamic radii RH for various protein species as obtained from smMDS plotted against literature values. The dashed line depicts the expected trend. Data points (mean) were obtained from at least triplicate measurements at 10 pM sample concentration (see source data for a number of repeats). Error bars denote standard deviations. Inset shows obtained RH (mean ± standard deviation) as a function of molecular weight MW. The dashed and dotted lines denote scaling behavior of globular (RHMW1/3) and disordered (RHMW0.6) proteins, respectively. b Exemplary diffusion profiles for thyroglobulin (blue), human leukocyte antigen (HLA) (violet), and Alexa 488 (cyan) at 10 pM sample concentration. Diffusion profiles are shown as blue lines, experimental fits as orange lines, and error as green bands. Extracted RH [with errors] are given as insets. For definitions of errors, please refer to the legend of Fig. 1b. Source data are provided as a Source Data file.
Fig. 4
Fig. 4. Quantifying protein interactions by smMDS.
a Sizing and affinity measurement of an antibody–antigen complex by smMDS. Shown is a schematic for the binding interaction between human leukocyte antigen (HLA) (A*03:01) and the HLA-antibody W6/32. b Exemplary diffusion profiles for the binding of the HLA-antibody W6/32 to HLA as obtained by step scan smMDS. The left panel shows a diffusion profile for 100 pM HLA. The right panel shows a diffusion profile for 100 pM HLA in the presence of 10 nM W6/32. Diffusion profiles are shown as blue lines, experimental fits as orange lines, and error as green bands. Extracted hydrodynamic radii (RH) [with errors] are given as insets. For definitions of errors, please refer to the legend of Fig. 1b. c Size increase upon complexation of HLA with W6/32 from RH = 3.18 ± 0.04 nm for pure HLA to RH = 5.08 ± 0.01 nm for the complex in the presence of 100 nM W6/32. Data points (mean) were obtained from triplicate measurements. Error bars denote standard deviations. Notably, for enhanced clarity and to prevent overlap, data points are randomly positioned along the x-axis in each chart. d Binding isotherm obtained from a titration of 100 pM HLA with increasing concentrations of W6/32. For analysis, the binding isotherm was fitted with a binding model assuming two antigen molecules binding one antibody. The dissociation constant was found to be Kd = 400 ± 40 pM. Error bars are standard deviations from triplicate measurements. Source data are provided as a Source Data file.
Fig. 5
Fig. 5. Resolving protein oligomeric states by smMDS.
a Sizing of low-molecular weight oligomers formed by the protein human serum albumin (HSA). Shown is a burst intensity histogram, which displays all bursts extracted from a single smMDS step scan measurement of HSA (10 pM). Intensities are normalized intensities with respect to burst duration. Four regions (blue, orange, green, and red), which correspond to HSA monomer and HSA dimer, trimer, and tetramer, are defined in the burst intensity histogram. These were obtained by fitting the distribution with a skew-normal distribution function for monomeric HSA and three Gaussian functions for dimeric, trimeric, and tetrameric HSA (see main text for details). The center positions for the oligomers (dimer: 150.66 photons/ms, trimer: 225.99 photons/ms, and tetramer: 301.32 photons/ms) are multiples of the normalized intensity of the monomer (Imonomer = 75.33 photons/ms). The widths of the regions reflect one standard deviation of the distribution of monomeric HSA (σmonomer = 37.44 photons/ms). b Diffusion profiles for HSA monomer, dimer, trimer and tetramer generated from bursts within each of the four regions in the burst intensity histogram shown in panel a (panels are color-coded according to the colors used in panel a). Each profile was fitted to extract size information. Diffusion profiles are shown as blue lines, experimental fits as orange lines, and error as green bands. Extracted hydrodynamic radii RH [with errors] are given as insets. For definitions of errors, please refer to the legend of Fig. 1b. c Species-resolved RH (left panel) and abundance of HSA oligomers (right panel). RH were obtained from diffusion profile fits shown in panel b and represent the best-fit values; error bars correspond to the error range of RH as derived from the global fit. For definitions of errors, please refer to the legend of Fig. 1b. Abundance was obtained from skew normal/Gaussian fitting in panel a and represents the best-fit value; the error bars correspond to the 99% confidence intervals obtained from bootstrapping. Source data are provided as a Source Data file.
Fig. 6
Fig. 6. Sizing of heterogenous oligomer populations by smMDS.
a A heterogenous mixture of α-synuclein oligomers (10 pM) was probed in a single-step scan smMDS measurement and single-molecule burst events were extracted using the burst search algorithm. To differentiate between differently sized assembly states of α-synuclein oligomers, the value for the minimum number of fluorescence photons threshold (Nmin) was varied, while keeping the inter-photon time threshold constant. This allowed for the creation of burst intensity distributions, which differ in molecular brightness. Exemplary burst intensity distributions for four different Nmin threshold values are shown (light blue: 5 photons, orange: 20 photons, green: 30 photons, red: 47 photons). The inset displays burst intensity histograms in semi-log scale. Intensities are normalized intensities with respect to burst duration. b Exemplary diffusion profiles generated from burst intensity distributions with four different minimum number of fluorescence photons threshold values (panels are color-coded according to the specific threshold values used in panel a). Diffusion profiles are shown as blue lines, experimental fits as orange lines, and error as green bands. Extracted hydrodynamic radii RH [with errors] are given as insets. For definitions of errors, please refer to the legend of Fig. 1b. c Extracted RH of oligomer subspecies displayed as a function of the different minimum number of photon threshold values used in the burst search algorithm. Data represent extracted RH [with errors], as reported in panel b. The colored vertical bars indicate threshold values used in panels a and b. The horizonal dashed line indicates the ensemble-averaged size of the entire oligomer population, generated from a diffusion profile from all bursts obtained from the measurement. RH of monomeric α-synuclein, as measured by smMDS, is indicated as a dotted horizontal line. Source data are provided as a Source Data file.
Fig. 7
Fig. 7. Sizing of multiple species within a heterogenous aggregation mixture by smMDS.
a Schematic of an aggregation reaction composed of monomeric α-synuclein and fibrillar species. b Sizing of α-synuclein fibrils in the presence of an excess of monomeric α-synuclein. Continuous scan diffusion profiles (left panel) for pure monomeric α-synuclein (10 nM) (blue), α-synuclein fibrils (10 nM monomer equivalent) (green), and a mixture of α-synuclein fibrils (9 nM monomer equivalent) and monomeric α-synuclein (1 nM) (pink). The right panel is a zoom-in as indicated by a dashed box in the left panel. Bursts correspond to the passing of fibrils through the confocal detection volume. c Step scan measurement of a mixture of α-synuclein fibrils (9 nM monomer equivalent) and monomeric α-synuclein (1 nM). The top panel shows an exemplary fluorescence time trace (1-ms binning) at diffusion profile position 340 µm, as indicated. An intensity threshold was applied to separate signal from fibrils (red) and monomer (purple). The bottom panels show diffusion profiles created from the fibril and monomer signals, respectively. Diffusion profiles are shown as blue lines, experimental fits as orange lines, and errors as green bands. Extracted hydrodynamic radii RH [with errors] are given as insets. For definitions of errors, please refer to the legend of Fig. 1b. d Comparison of extracted sizes from triplicate step scan measurements. Shown are RH of species extracted from a mixture of α-synuclein fibrils (9 nM monomer equivalent) and 1 nM monomeric α-synuclein (red and purple, respectively), pure monomeric α-synuclein (blue), 10 nM monomer equivalent of α-synuclein fibrils (green). Data points (mean) were obtained from triplicate measurements. Error bars denote standard deviations. Step scan measurements of pure α-synuclein (10 nM) (panel e) and pure fibrils (10 nM monomer equivalent) (panel f). The top panels show exemplary fluorescence time traces (1-ms binning) at diffusion profile positions 338 µm and 340 µm, respectively. Diffusion profiles are shown as blue lines, experimental fits as orange lines, and errors as green bands. Extracted RH [with errors] are given as insets. For definitions of errors, please refer to the legend of Fig. 1b. Source data are provided as a Source Data file.
Fig. 8
Fig. 8. Sizing of nanoscale clusters by smMDS.
a Schematic of TDP-43 phase separation and the formation of nanoscale clusters in the pre-phase separating regime. b Phase separation behavior of GFP-tagged TDP-43 as a function of KCl concentration as observed by widefield microscopy imaging. The phase diagram (left panel) was generated from measurements at five KCl concentrations and at 0.5 µM protein concentration. Representative images at 100 mM and 25 mM KCl are shown (right panels). ccrit denotes the critical KCl concentration. Experiments were repeated at least three times with similar results. Scale bar is 10 µm. c Continuous scan diffusion profiles for 0.5 µM GFP-tagged TDP-43 at 100 mM KCl. The upper panel shows the diffusion profile as obtained from a continuous scan measurement. Bright bursts indicate nanoclusters passing through the confocal detection volume. The bottom panel is a re-binned diffusion profile to extract the size of monomeric TDP-43. Diffusion profiles are shown as blue lines, experimental fits as orange lines, and error as green bands. The extracted RH [with errors] is given as an inset. d Exemplary fluorescence time trace (1-ms binning) from a step scan measurement at channel position 960 µm, as indicated in panel e. Nanoclusters were detected as bursts that exhibit a signal >5 standard deviations above the mean. Detection events are highlighted in red. e Total intensity of a segmented step scan across the chip (top panel) and histogram of detected nanocluster events as a function of chip position (bottom panel). Gaussian distributions were fit to each peak to extract a mean diffusion distance at each channel position. f Plot of mean diffusion distance versus time of travel within the channel. The inset graphically shows how diffusion distances were determined. The diffusion distance corresponds to the half of the full-width half maximum (FWHM) of the Gaussian distributions at each measurement point. The width at timepoint zero was used for normalization. Data points (mean) are from three repeats; error bars indicate standard deviations. The orange line shows the fit according to Eq. 1. The extracted average RH of TDP-43 nanoclusters is given as an inset (mean ± standard deviation).

References

    1. Goodsell, D. S. The Machinery of Life. The Machinery of Life (Springer, New York, NY, 2009). 10.1007/978-0-387-84925-6.
    1. Neet, K. E. & Lee, J. C. Biophysical characterization of proteins in the post-genomic era of proteomics. Mol. Cell Proteom.1, 415–420 (2002).10.1074/mcp.R200003-MCP200 - DOI - PubMed
    1. Knowles, T. P. J., Vendruscolo, M. & Dobson, C. M. The amyloid state and its association with protein misfolding diseases. Nat. Rev. Mol. Cell Biol.15, 384–396 (2014). 10.1038/nrm3810 - DOI - PubMed
    1. Eliezer, D. Biophysical characterization of intrinsically disordered proteins. Curr. Opin. Struct. Biol.19, 23–30 (2009). 10.1016/j.sbi.2008.12.004 - DOI - PMC - PubMed
    1. Bemporad, F. & Chiti, F. Protein misfolded oligomers: experimental approaches, mechanism of formation, and structure-toxicity relationships. Chem. Biol.19, 315–327 (2012). 10.1016/j.chembiol.2012.02.003 - DOI - PubMed

Publication types

LinkOut - more resources