. 2024 Sep 4;15(1):7731.
doi: 10.1038/s41467-024-51577-2.

Large-scale analysis of whole genome sequencing data from formalin-fixed paraffin-embedded cancer specimens demonstrates preservation of clinical utility

Affiliations

Large-scale analysis of whole genome sequencing data from formalin-fixed paraffin-embedded cancer specimens demonstrates preservation of clinical utility

Shadi Basyuni et al. Nat Commun. .

Abstract

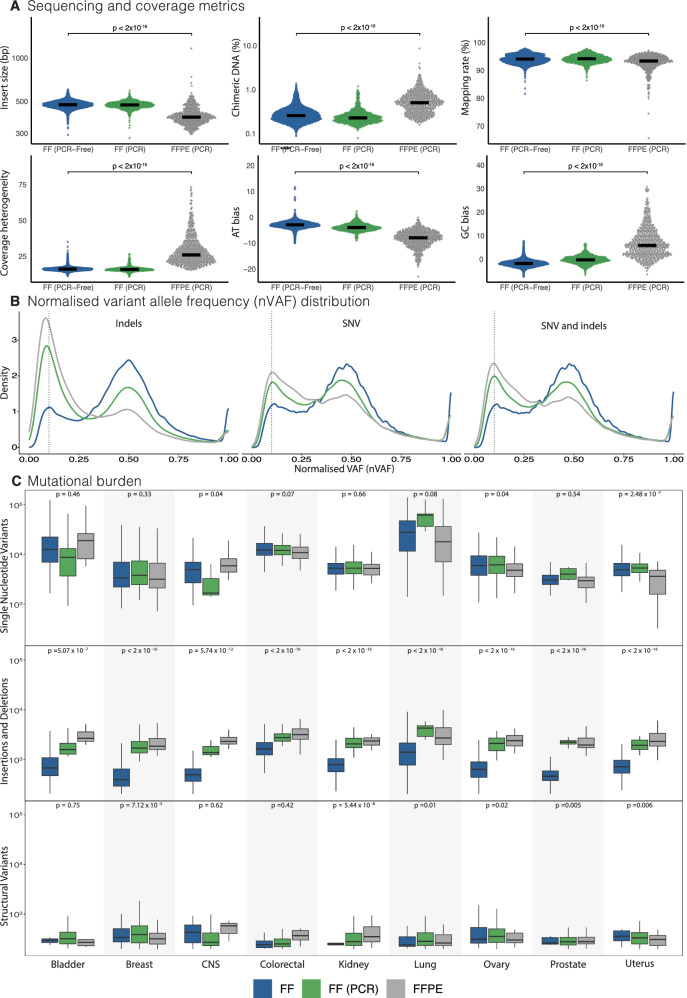
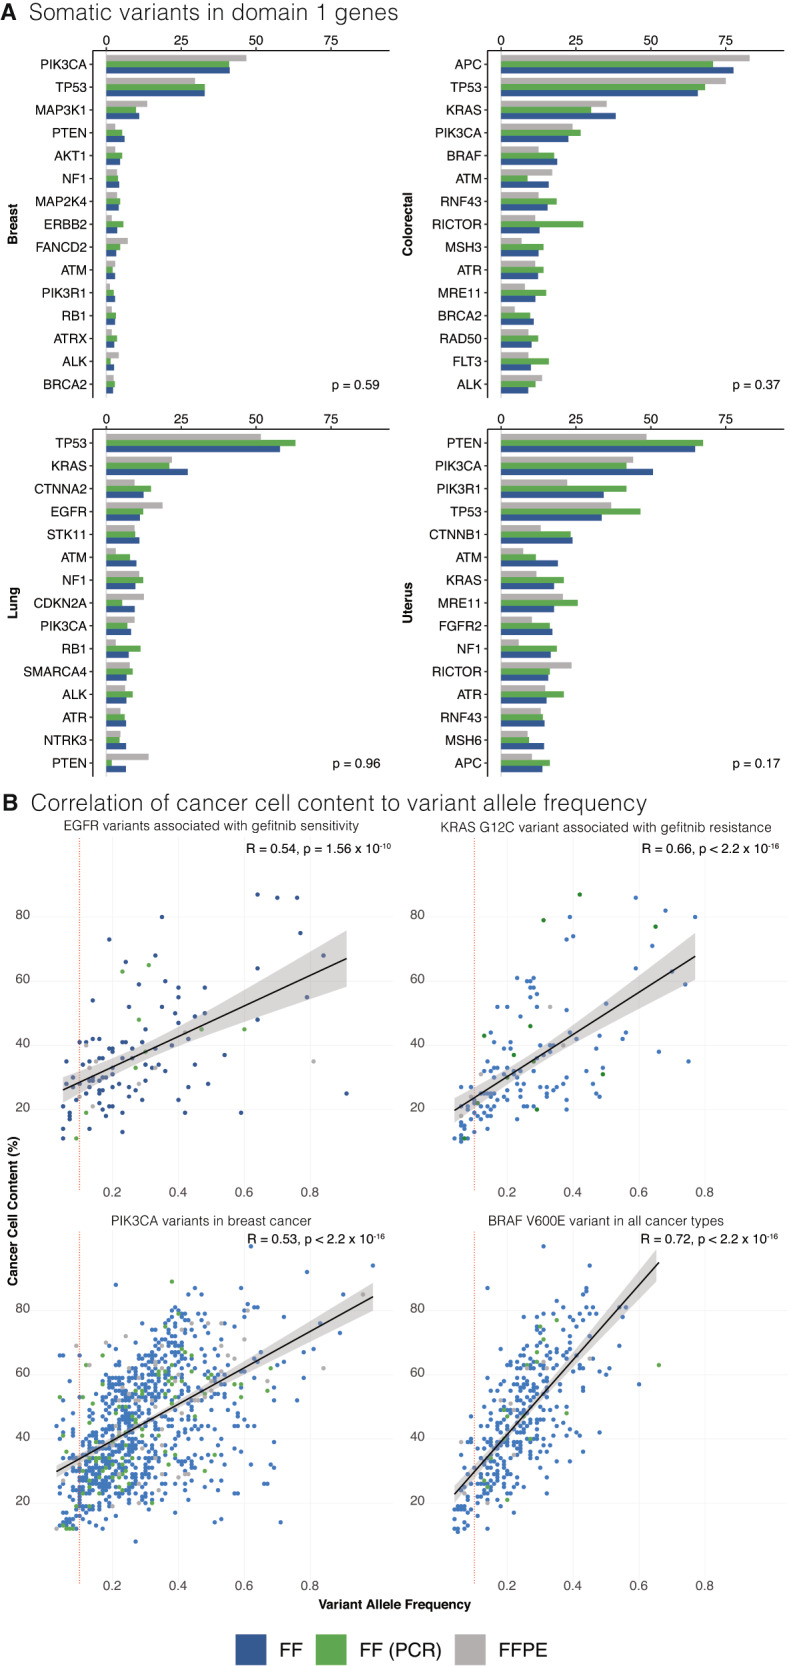
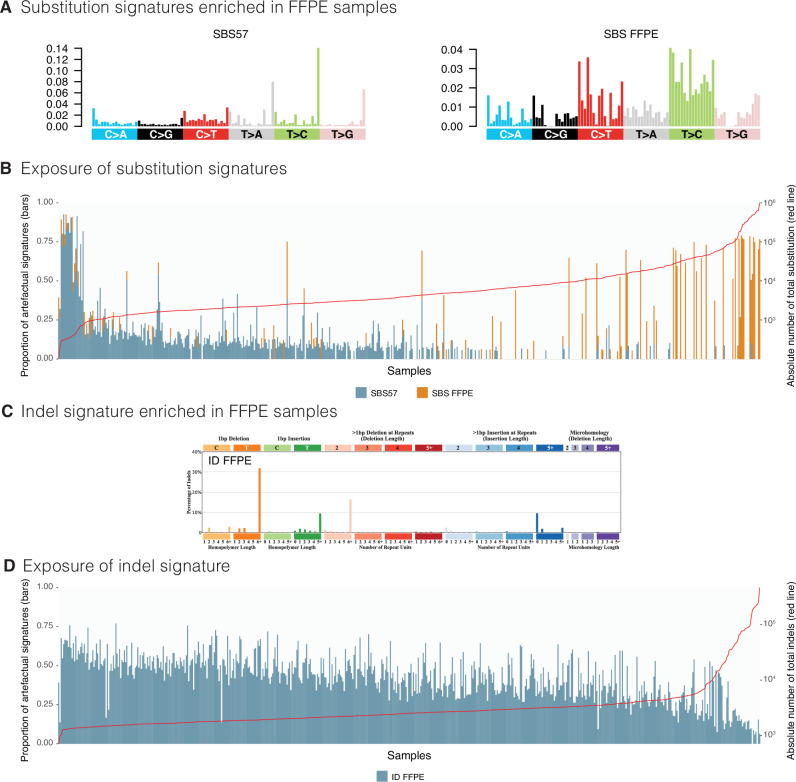
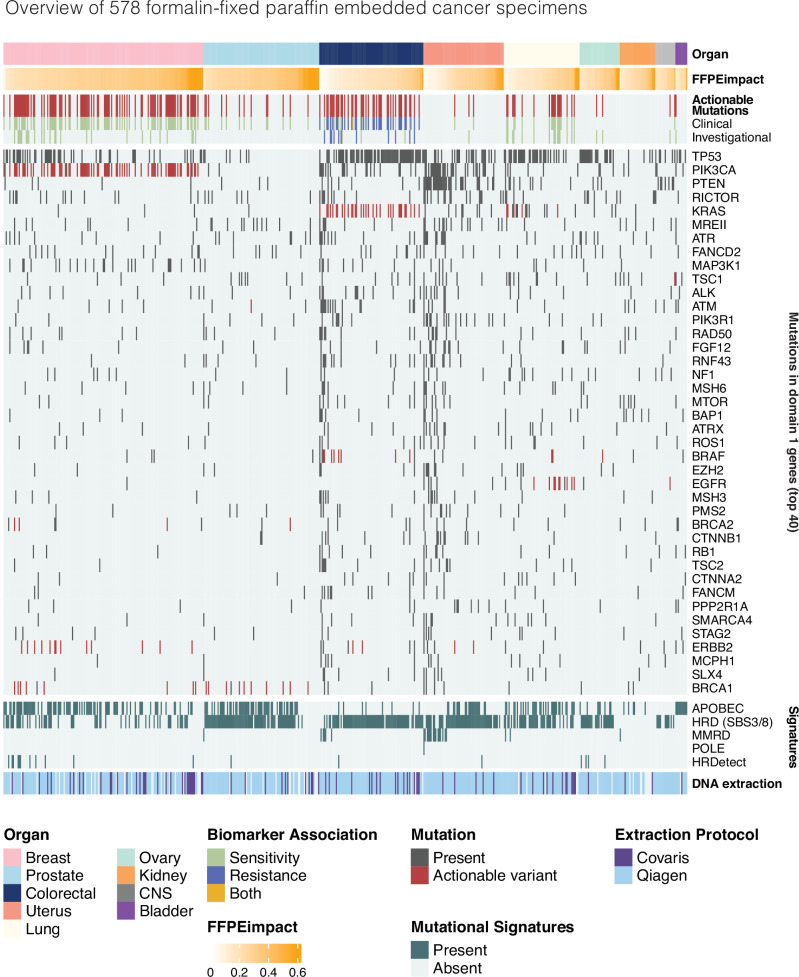
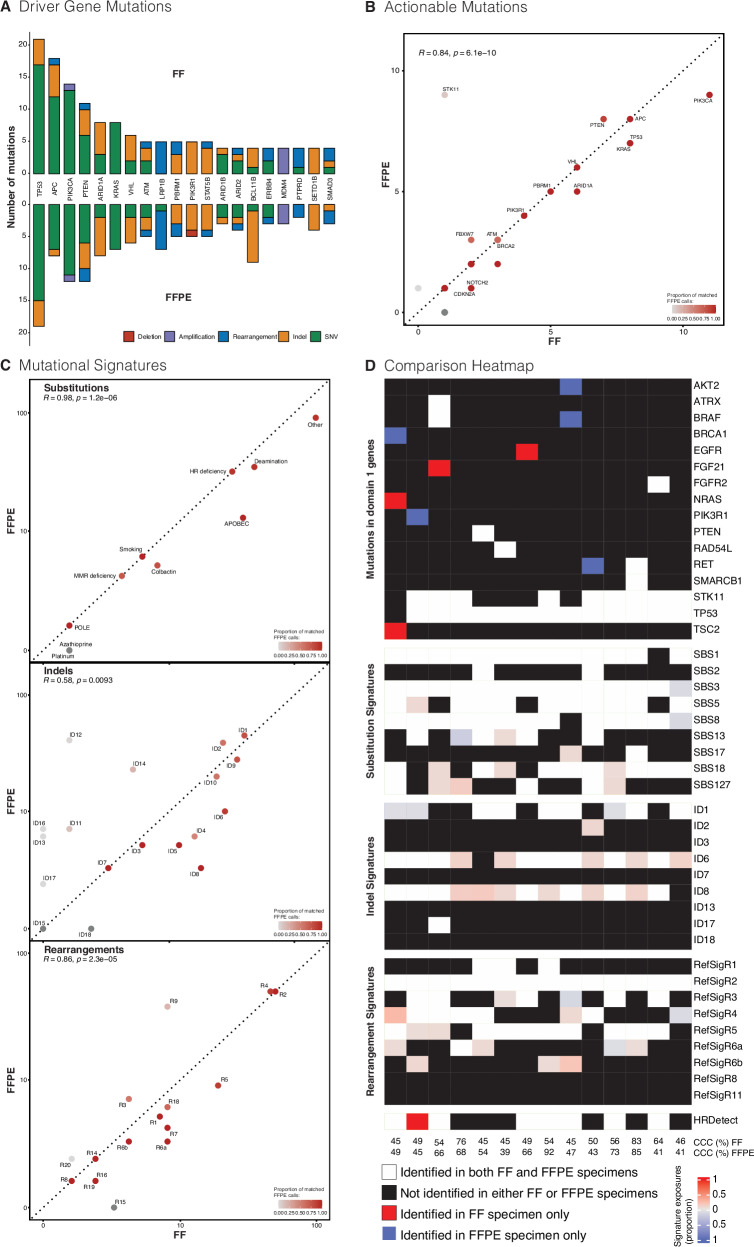
Whole genome sequencing (WGS) provides comprehensive, individualised cancer genomic information. However, routine tumour biopsies are formalin-fixed and paraffin-embedded (FFPE), damaging DNA, historically limiting their use in WGS. Here we analyse FFPE cancer WGS datasets from England's 100,000 Genomes Project, comparing 578 FFPE samples with 11,014 fresh frozen (FF) samples across multiple tumour types. We use an approach that characterises rather than discards artefacts. We identify three artefactual signatures, including one known (SBS57) and two previously uncharacterised (SBS FFPE, ID FFPE), and develop an "FFPEImpact" score that quantifies sample artefacts. Despite inferior sequencing quality, FFPE-derived data identifies clinically-actionable variants, mutational signatures and permits algorithmic stratification. Matched FF/FFPE validation cohorts shows good concordance while acknowledging SBS, ID and copy-number artefacts. While FF-derived WGS data remains the gold standard, FFPE-samples can be used for WGS if required, using analytical advancements developed here, potentially democratising whole cancer genomics to many.


Conflict of interest statement

A.D., H.R.D., G.C.C.K., G.R., and S.N.-Z. hold patents or have submitted applications on clinical algorithms of mutational signatures: MMRDetect (PCT/EP2022/057387), HRDetect (PCT/EP2017/060294), clinical use of signatures (PCT/EP2017/060289), rearrangement signature methods (PCT/EP2017/060279), clinical predictor (PCT/EP2017/060298), and hotspots for chromosomal rearrangements (PCT/EP2017/060298). Z.K. is an employee of Illumina, Inc. The remaining authors declare no competing interests.

Figures

Fig. 1
Fig. 1. Quality of sequencing data in Genomics England Cohort.
A Comparison of sequencing and coverage metrics between FF (n = 10,115), FF(PCR) (n = 899), and FFPE(PCR) (n = 578). Insert sizes represent lengths of sequenced DNA fragments. Chimeric DNA percentage is the proportion of reads synthesised from more than one template. Mapping rate is the percentage of reads that can be mapped to the reference genome. Coverage heterogeneity is the read depth uniformity across the genome. Adenosine/thymine (AT) and guanine/cytosine (GC) bias indicates the percentage of reads that are under or overrepresented in AT-rich or GC-rich genomic regions. The p-values indicate statistical comparisons between FF and FFPE cohorts using a two-sided Wilcoxon rank-sum test. B Normalised variant allele frequency distribution. Variant allele fraction (VAF) is the proportion of sequencing reads reporting a specific variant, whilst cancer cell content is the estimated percentage of tumour cells in the sample. The dotted vertical line is located at VAF 0.1 for reference. C Comparison of single nucleotide variant, indel, and structural variant mutational burdens across organ types. Bladder (FF n = 359, FF PCR n = 31, FFPE n = 10), Breast (FF n = 2509, FF PCR n = 283, FFPE n = 169), CNS (FF n = 504, FF PCR n = 76, FFPE n = 17), Colorectal (FF n = 2469, FF PCR n = 113, FFPE n = 88), Kidney (FF n = 1355, FF PCR n = 95, FFPE n = 30), Lung (FF n = 1290, FF PCR n = 114, FFPE n = 64), Ovary (FF n = 527, FF PCR n = 60, FFPE n = 34), Prostate (FF n = 384, FF PCR n = 84, FFPE n = 98), Uterus (FF n = 718, FF PCR n = 43, FFPE n = 68). The box and whisker plots in this figure are defined as follows: the centre line represents the median, the bounds of the box indicate the lower (25th percentile) and upper (75th percentile) quartiles and the whiskers extend to the minimum and maximum values. The p-values indicate statistical comparisons between FF and FFPE cohorts using a two-sided Wilcoxon rank-sum test. FF fresh frozen, FF (PCR) fresh frozen with polymerase chain reaction, FFPE formalin-fixed paraffin-embedded.
Fig. 2
Fig. 2. Comparison of putative driver events in Genomics England Cohort.
A Comparison of detection of Domain 1 variants across different sample preparations (reported as a percentage of samples). Additional organ types are presented in the supplementary information. Kruskal–Wallis rank sum test was used for statistical analysis. B Comparison of percentage cancer cell content to variant allele frequency for selected actionable mutations. The solid black line represents the linear regression fit, and the shaded area around the line indicates the 95% confidence interval of the fit. A vertical red dotted line is demonstrated at variant allele frequency 0.1 to demonstrate that a significant number of mutations would be discarded if conventional bioinformatic filtering was applied. Top left panel plots EGFR variants associated with gefitinib sensitivity in lung cancer. Top right panel plots the KRAS G12C variant associated with gefitinib resistance in lung cancer. Bottom right panel plots PIK3CA variants in breast cancer and the bottom left panel plots BRAF V600E variant in all cancer groups included in the study. Correlation was assessed using Spearman’s Rank Correlation (two-sided test). FF fresh frozen, FF (PCR) fresh frozen with polymerase chain reaction, FFPE formalin fixed paraffin embedded.
Fig. 3
Fig. 3. Mutational signatures associated with FFPE artefact.
A Substitution signature profiles for SBS57 and SBS FFPE using a 96-channel format. B Exposure of artefactual substitution signatures in Genomics England Cohort. The bar chart represents exposure as a proportion of total substitutions per sample, with samples arranged in order of total substitution burden and the red line represents the total number of substitutions in each sample. C Indel signature profile for ID FFPE using the COSMIC indel 83-channel format. D Exposure of artefactual indel signature in Genomics England Cohort. The bar chart represents exposure as a proportion of total indels per sample, with samples arranged in order of total substitution burden and the red line represents the total number of indels in each sample. FFPE formalin-fixed paraffin-embedded.
Fig. 4
Fig. 4. Overview of Genomics England FFPE cohort.
Samples are arranged by organ type and then by FFPEimpact score (in ascending order). Mutations were considered actionable if they met the criteria discussed in the methodology section. Actionable mutations were divided into Clinical and Investigational depending on ESCAT tier (see the “Methods” section). Mutations in the top 40 mutated Domain 1 genes are presented with actionable variants highlighted. Mutational signatures were grouped by aetiology. APOBEC: APOBEC protein family dysfunction; HRD: homologous recombination deficiency (SBS3 and SBS8); MMRD mismatch repair deficiency, POLE DNA polymerase epsilon dysfunction, HRDetect HRDetect algorithm corrected for artefact as discussed in methodology and a supplemental appendix. DNA extraction protocol compares the two different protocols (Covaris and Qiagen) used for the Genomics England cohort. FFPE formalin-fixed paraffin-embedded.
Fig. 5
Fig. 5. Comparison of two validation cohorts with matched FFPE and FF specimens.
A Comparison of count and class of driver gene mutations in the Oxford Cohort (n = 51) (supporting data Table S11). Concordance in calling of B actionable variants (supporting data Table S12) and C mutational signatures between FFPE and FF specimen in the Oxford Cohort. Dotted line represents 100% concordance (R = 1), and the colour of the points demonstrates the proportion of FFPE calls that are complementary to the matched FF specimen. A log-scale is used for mutational signatures. D Heatmap comparing genomic characteristics in the PARTNER/PBCP Cohort (n = 14). The top 20 mutated Domain 1 genes are presented. Common breast signatures are presented for substitution and rearrangement, whilst only indel signatures with proposed aetiology are presented. HRDetect is again calculated following correction for indel artefact as discussed in the “Methods” section and supplementary information. Cancer cell content (CCC) is provided for both FF and FFPE samples. Correlation was assessed using Spearman’s Rank Correlation. FF fresh frozen, FFPE formalin fixed paraffin embedded.

References

    1. Berger, M. F. & Mardis, E. R. The emerging clinical relevance of genomics in cancer medicine. Nat. Rev. Clin. Oncol.15, 353–365 (2018). 10.1038/s41571-018-0002-6 - DOI - PMC - PubMed
    1. Cottrell, C. E. et al. Validation of a next-generation sequencing assay for clinical molecular oncology. J. Mol. Diagn.16, 89–105 (2014). 10.1016/j.jmoldx.2013.10.002 - DOI - PMC - PubMed
    1. Pritchard, C. C. et al. Validation and implementation of targeted capture and sequencing for the detection of actionable mutation, copy number variation, and gene rearrangement in clinical cancer specimens. J. Mol. Diagn.16, 56–67 (2014). 10.1016/j.jmoldx.2013.08.004 - DOI - PMC - PubMed
    1. Wagle, N. et al. High-throughput detection of actionable genomic alterations in clinical tumor samples by targeted, massively parallel sequencing. Cancer Discov.2, 82–93 (2012). 10.1158/2159-8290.CD-11-0184 - DOI - PMC - PubMed
    1. Garraway, L. A. & Lander, E. S. Lessons from the cancer genome. Cell153, 17–37 (2013). 10.1016/j.cell.2013.03.002 - DOI - PubMed

Publication types

LinkOut - more resources