. 2024 Sep 4;15(1):7712.
doi: 10.1038/s41467-024-51746-3.

10-hydroxy-2-decenoic acid prevents osteoarthritis by targeting aspartyl β hydroxylase and inhibiting chondrocyte senescence in male mice preclinically

Affiliations

10-hydroxy-2-decenoic acid prevents osteoarthritis by targeting aspartyl β hydroxylase and inhibiting chondrocyte senescence in male mice preclinically

Nana Geng et al. Nat Commun. .

Abstract

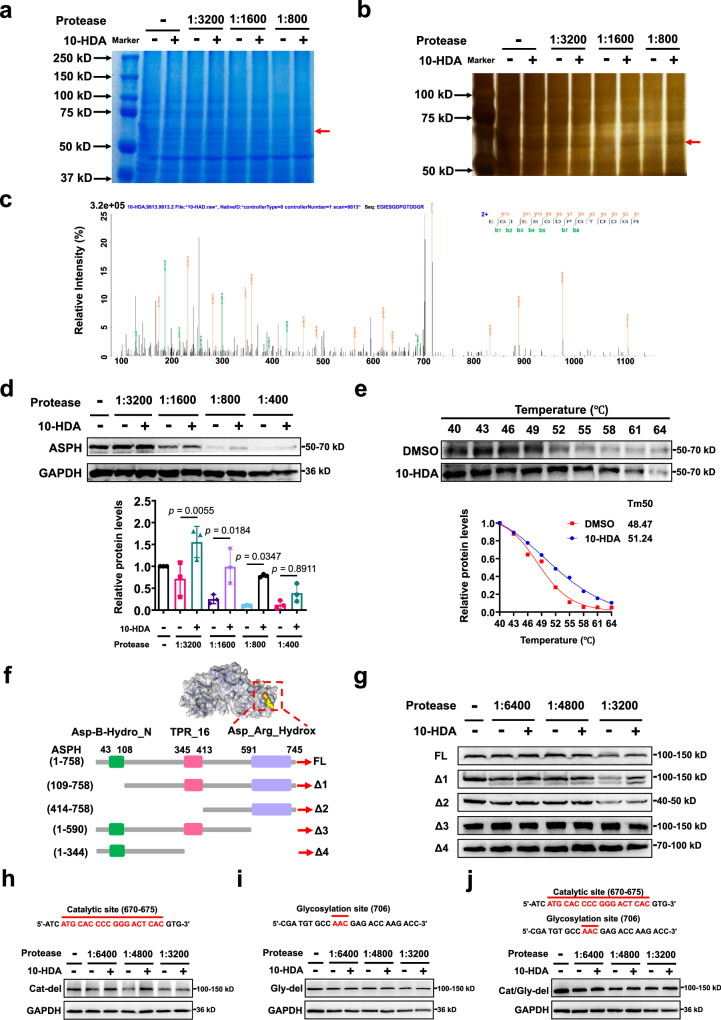
Osteoarthritis is a degenerative joint disease with joint pain as the main symptom, caused by fibrosis and loss of articular cartilage. Due to the complexity and heterogeneity of osteoarthritis, there is a lack of effective individualized disease-modifying osteoarthritis drugs in clinical practice. Chondrocyte senescence is reported to participate in occurrence and progression of osteoarthritis. Here we show that small molecule 10-hydroxy-2-decenoic acid suppresses cartilage degeneration and relieves pain in the chondrocytes, cartilage explants from osteoarthritis patients, surgery-induced medial meniscus destabilization or naturally aged male mice. We further confirm that 10-hydroxy-2-decenoic acid exerts a protective effect by targeting the glycosylation site in the Asp_Arg_Hydrox domain of aspartyl β-hydroxylase. Mechanistically, 10-hydroxy-2-decenoic acid alleviate cellular senescence through the ERK/p53/p21 and GSK3β/p16 pathways in the chondrocytes. Our study uncovers that 10-hydroxy-2-decenoic acid modulate cartilage metabolism by targeting aspartyl β-hydroxylase to inhibit chondrocyte senescence in osteoarthritis. 10-hydroxy-2-decenoic acid may be a promising therapeutic drug against osteoarthritis.


Conflict of interest statement

The authors declare no competing interests.

Figures

Fig. 1
Fig. 1. Effects of 10-HDA on the chondrocyte proliferation, apoptosis, anabolism, catabolism, and inflammation in vitro.
a 10-HDA structural formula. b Cell viability of mouse primary chondrocytes treated with 10 ng/ml interleukin-1β (IL-1β) in the absence or presence of 0, 2, 5, 10 nM 10-HDA for 48 h. n = 5 biologically independent replicates. c Cyclin-dependent kinase 1(Cdk1), cyclin-dependent kinase 2 (Cdk2), cyclin-dependent kinase 4 (Cdk4), cyclin-dependent kinase 6 (Cdk6), cyclinA1, cyclinB1, cyclinD1, cyclinE1, proliferating cell nuclear antigen (Pcna) mRNA levels in mouse primary chondrocytes treated with 10 ng/ml IL-1β in the absence or presence of 0, 2, 5, 10 nM 10-HDA for 48 h. n = 3 biologically independent replicates. Significant differences and p values were in Supplementary Data 1. d SRY-box transcription factor 9 (Sox9), type II collagen (Col2), aggrecan (Acan), matrix metallopeptidase 13 (Mmp13), interleukin 6 (Il6) mRNA levels in mouse primary chondrocytes treated with 10 ng/ml IL-1β in the absence or presence of a series of 10-HDA concentrations (0, 2, 5, 10 nM) for 48 h. n = 3 biologically independent replicates. e Cell proliferation in human C28/I2 chondrocytes treated with 10 ng/ml IL-1β in the absence or presence of 0, 2, 5, 10 nM 10-HDA for 48 h. 5-Ethynyl-2′-deoxyuridine (EdU) was stained red (middle boxes), while nuclei were blue (upper boxes) and merged images were shown in the lower boxes. Quantification of the EdU-positive cells was on the right. Scale ba r= 75 μm. n = 3 biologically independent replicates. f Cell apoptosis in human C28/I2 chondrocytes treated with 10 ng/ml IL-1β in the absence or presence of 0, 2, 5, 10 nM 10-HDA for 48 h. TdT-mediated dUTP nick end labeling (tunel) was stained red. Quantification of the tunel-positive cells was on the right. Scale bar = 75 μm. n = 3 biologically independent replicates. Data were shown as means ± SD. P values in (b, c, d, e, f) were determined using one-way ANOVA followed by Tukey’s HSD multiple comparison test. Source data are provided as a Source Data file.
Fig. 2
Fig. 2. Effects of 10-HDA on the anabolism and catabolism of human cartilage tissues.
a Cyclin-dependent kinase 1(CDK1), cyclin-dependent kinase 2 (CDK2), cyclin-dependent kinase 4 (CDK4), cyclin-dependent kinase 6 (CDK6), cyclinA1, cyclinB1, cyclinD1, cyclinE1, proliferating cell nuclear antigen (PCNA) mRNA levels in human cartilage explants treated with 10 ng/ml interleukin-1β (IL-1β) in the absence or presence of 0, 5, 10 nM 10-HDA for 7 d. n = 3 donors (3 female). Significant differences and p values were in Supplementary Data 2. b SRY-box transcription factor 9 (SOX9), type II collagen (COL2), aggrecan (ACAN), matrix metallopeptidase 13 (MMP13) mRNA levels in human cartilage explants treated with 10 ng/ml IL-1β in the absence or presence of 0, 5, 10 nM 10-HDA for 7 d. n = 3 donors (3 female). c COL2, ACAN, MMP13 protein levels in human cartilage explants treated with 10 ng/ml IL-1β in the absence or presence of 0, 5, 10 nM 10-HDA for 7 d. n = 3 donors (3 female). Quantification was in Supplementary Fig. 6. d Representative images of hematoxylin-eosin (HE), toluidine blue, safranin O staining, COL2, and MMP13 protein levels in the human cartilage explants treated with 10 ng/ml IL-1β in the absence or presence of 0, 5, 10 nM 10-HDA for 7 d. Superficial area (S), deep area (D). COL2, MMP13 were stained red, DAPI (4,6-diamino-2-phenyl indole) were blue, and merged images were displayed. Experiments in (d) were repeated independently three times with similar results. Scale bar = 200 μm. Data were shown as means ± SD. P values in (a, b, c) were determined using one-way ANOVA followed by Tukey’s HSD multiple comparison test. Source data and uncropped blots are provided as a Source Data file.
Fig. 3
Fig. 3. Local delivery of 10-HDA attenuated OA development and pain-related behaviors in a surgically induced model in vivo.
a Experimental flow chart. 8-week-old male C57BL/6 J mice were performed destabilization of the medial meniscus (DMM) surgery (male, n = 18) or sham operation (male, n = 9), then administered vehicle (DMSO, DMM, male, n = 9; sham, male, n = 9) or 10-HDA (10 mg/kg, DMM, male, n = 9) twice a week for 6 weeks through intra-articular injection 1 week and sacrificed 8 weeks after surgery. The joints were collected 8 weeks after surgery. b Representative knee joint images at 8 weeks after surgery. c Representative knee joint cartilage images at 8 weeks after surgery. d Representative knee joint sections stained by hematoxylin-eosin (HE) and safranin O/fast green, OA severity was analyzed by chondrocyte numbers, cartilage thickness, and Osteoarthritis Research Society International score system (OARSI). Scale bar = 200 μm. n = 6 mice. e Representative immunofluorescence images of type II collagen (Col2), aggrecan (Acan), matrix metallopeptidase 13 (Mmp13), and quantification of positive cells in the knee joint. Col2, Acan, Mmp13 were stained green (middle boxes), DAPI (4,6-diamino-2-phenyl indole) were blue (upper boxes) and merged images were shown in the lower boxes. Scale bar = 50 μm. n = 6 mice. f Col2, Acan, Mmp13 mRNA levels in knee joint cartilage. n = 3 mice. g Mechanical sensitivity was measured using von Frey filaments once a week after surgery. n = 6 mice. h Representative images and quantification of gait analysis parameters 8 weeks after surgery. Values are presented as the ratio of the right hind (RH, DMM applied knee)/the left hind (LH, contralateral knee). LF left front, FF right front. n = 6 mice. Data were shown as means ± SD. P values for chondrocyte numbers and cartilage thickness (d), positive cells (e), mRNA expression (f) were determined with one-way ANOVA followed by Tukey’s HSD multiple comparison test. P values in (h) were determined with unpaired two-tailed Student’s t-test. P values for OARSI score (d), paw withdrawal thresholds (g) were determined with the two-sided Kruskal–Wallis test followed by the Mann–Whitney U test. Source data are provided as a Source Data file.
Fig. 4
Fig. 4. Oral delivery of 10-HDA relieved OA development and pain-related behaviors in a DMM model in vivo.
a Experimental flow chart. Destabilization of the medial meniscus (DMM) surgery (male, n = 12) or sham operation (male, n = 6) were performed in 8-week-old C57BL/6 J mice, then administered vehicle (CMC-Na, DMM, male, n = 6; sham, male, n = 6) or 10-HDA (100 mg/kg, DMM, male, n = 6) three times a week for 7 weeks through oral administration 4 days and sacrificed 8 weeks after surgery. The joints were collected 8 weeks after surgery. b, c Representative hematoxylin-eosin (HE) and safranin O/fast green staining images in the knee joint 8 weeks after the surgery, then OA severity was analyzed by chondrocyte numbers, cartilage thickness and Osteoarthritis Research Society International score system (OARSI). Scale bar = 200 μm. n = 6 mice. d Representative immunofluorescence images of type II collagen (Col2), aggrecan (Acan), matrix metallopeptidase 13 (Mmp13), and quantification of positive cells in knee joint 8 weeks after surgery. Col2, Acan, Mmp13 were stained green (middle boxes), DAPI (4,6-diamino-2-phenyl indole) were blue (upper boxes) and merged images were shown in the lower boxes. Scale bar = 50 μm. n = 6 mice. e Mechanical sensitivity was measured using von Frey filaments once a week after surgery. n = 6 mice. f Representative images and quantification of gait analysis parameters 8 weeks after surgery. Values are presented as the ratio of the right hind (RH, DMM applied knee)/the left hind (LH, contralateral knee). LF left front, FF right front. n = 6 mice. Data were shown as means ± SD. P values for chondrocyte numbers and cartilage thickness (c), positive cells (d) were determined using one-way ANOVA followed by Tukey’s HSD multiple comparison test. P values in (f) were determined with unpaired two-tailed Student’s t-test. P values for OARSI score (c), paw withdrawal thresholds (e) were determined with two-sided Kruskal–Wallis test followed by Mann–Whitney U test. Source data are provided as a Source Data file.
Fig. 5
Fig. 5. ASPH, a novel target of 10-HDA, and its functional domains were identified through DARTS assay.
a Coomassie blue staining of drug affinity responsive target stability (DARTS) assay in C28/I2 cells. The arrow indicates the protein band that was subjected to mass spectrometry. b Silver staining of DARTS assay in C28/I2 cells. c Aspartyl β-hydroxylase (ASPH) adapted image from mass spectrometry. d C28/I2 cells were digested with several dosages of protease with or without various concentrations of 10-HDA, then ASPH protein levels were assayed by western blot. n = 3 biologically independent replicates. e C28/I2 cell lysate was denatured under various temperatures and ASPH protein levels in DMSO control, 10-HDA-treated group were assayed by western blot and densitometry analysis curve. f Overview of binding of 10-HDA with ASPH and scheme of encoding serial myc-tagged ASPH full-length (FL) and domain deletion mutants (Δ1-Δ4). g DARTS for ASPH FL and Δ1-Δ4. HEK-293T cells were transfected with plasmid expressing myc-tagged ASPH FL and Δ1-Δ4. n = 3 biologically independent replicates. Quantification was in Supplementary Fig. 11. h DARTS assay for catalytic site deletion mutant of ASPH. HEK-293T cells were transfected with plasmid expressing myc-tagged ASPH catalytic site deletion mutant. n = 3 biologically independent replicates. Quantification was in Supplementary Fig. 12a. i DARTS for glycosylation site deletion mutant of ASPH. HEK-293T cells were transfected with plasmid expressing myc-tagged ASPH glycosylation site deletion mutant. n = 3 biologically independent replicates. Quantification was in Supplementary Fig. 12b. j DARTS assay for catalytic and glycosylation sites deletion mutant of ASPH. HEK-293T cells were transfected with plasmid expressing myc-tagged ASPH catalytic and glycosylation site deletion mutant. n = 3 biologically independent replicates. Quantification was in Supplementary Fig. 12c. ASPH protein levels of all mutants were detected by myc antibody. Data were shown as means ± SD. P values in (d) were performed by two-way ANOVA followed by Tukey’s HSD multiple comparison test. Experiments in (a, b, e) were repeated independently three times with similar results. Source data and uncropped blots are provided as a Source Data file.
Fig. 6
Fig. 6. ASPH was down-regulated in OA cartilage and Asp-Arg-Hydrox domain of ASPH was required for 10-HDA regulation of chondrocyte anabolism and catabolism.
a, b ASPH mRNA (a) and ASPH protein (b) levels were measured in the undamaged and damaged area of OA patient cartilage. Undamaged, n = 6 donors (1 male, 5 female); damaged, n = 6 donors (1 male, 5 female) (a). Undamaged, n = 3 donors (1 male, 2 female); damaged, n = 9 donors (1 male, 8 female) (b). c ASPH protein levels in human cartilage explant treated with 10 ng/ml IL-1β in the absence or presence of 0, 5, 10 nM 10-HDA for 7 d. n = 3 donors (3 female). d Immunofluorescence of Asph and positive cells quantification in the knee joint of mice administered with vehicle (DMSO, 8-week-old male C57BL/6 J mice, DMM, n = 6; sham, n = 6) or 10-HDA (10 mg/kg, 8-week-old male C57BL/6 J mice, DMM, n = 6) through intra-articular injection 8 weeks after DMM surgery. Asph was stained green (middle boxes), DAPI was blue (upper boxes) and merged images were shown in the lower boxes. Scale bar = 50 μm. n = 6 mice. e HEK-293T cells were co-transfected with siASPH and COL2 or MMP13 luciferase reporter plasmid in the absence or presence of 10 nM 10-HDA. n = 3 biologically independent replicates. f ASPH knockout (KO) confirmation in C28/I2 cells. Experiments in (f) were repeated independently three times with similar results. g COL2 and MMP13 mRNA expression in control and ASPH knockout C28/I2 cells with or without re-expression of ASPH-Δ2 treated with 10 nM 10-HDA and 10 ng/ml IL-1β for 48 h. n = 3 biologically independent replicates. h COL2 and MMP13 protein levels in control and ASPH knockout C28/I2 cells with or without re-expression of ASPH-Δ2 treated with 10 nM 10-HDA and 10 ng/ml IL-1β for 48 h. n = 3 biologically independent replicates. Data were shown as means ± SD. P values in (a, b) were performed by unpaired two-tailed Student’s t-test, in (c, d, e) were one-way ANOVA followed by Tukey’s HSD multiple comparison test, and in (g, h) were two-way ANOVA followed by Tukey’s HSD multiple comparison test. Source data and uncropped blots are provided as a Source Data file.
Fig. 7
Fig. 7. 10-HDA inhibited chondrocyte senescence in OA.
a Representative images of β-gal staining and quantification (b) of C28/I2 cells treated with 10 ng/ml IL-1β in the absence or presence of 0, 2, 5, 10 nM 10-HDA for 48 h. n = 3 biologically independent replicates. Scale bar = 100 μm. c p21, p16 mRNA levels in human cartilage explants treated with 10 ng/ml IL-1β in the absence or presence of 0, 5, 10 nM 10-HDA for 7 d. n = 3 donors (3 female). d Representative images of immunofluorescence staining of p21 and p16 proteins and quantification of positive cells in knee joint of mice administered with vehicle (DMSO, 8-week-old male C57BL/6 J mice, DMM, n = 6; sham, n = 6) or 10-HDA (10 mg/kg, 8-week-old male C57BL/6 J mice, DMM, n = 6) through intra-articular injection 8 weeks after DMM surgery. p21 and p16 were stained green (middle boxes), DAPI (4,6-diamino-2-phenyl indole) was blue (upper boxes) and merged images were shown in the lower boxes. Scale bar = 50 μm. n = 6 mice. Data were shown as means ± SD. P values in (b, c, d) were performed by one-way ANOVA followed by Tukey’s HSD multiple comparison test. Source data are provided as a Source Data file.
Fig. 8
Fig. 8. Local delivery of 10-HDA attenuated chondrocyte senescence and cartilage degeneration in naturally aged mice in vivo.
a Young (8 weeks old, male, n = 6) or naturally aged (18 months old, male, n = 12) C57BL/6 J mice were administered after 1 week with vehicle (DMSO, 8 weeks old, male, n = 6; 18 months old, male, n = 6) or 10-HDA (10 mg/kg, 18 months old, male, n = 6) twice a week for 8 weeks through intra-articular injection and sacrificed at week 9 post-administration. The joints were collected 9 weeks post-administration. b Representative images, transverse and anteroposterior diameters (mm) of the knee joint were calculated by vernier caliper at week 9 post-administration. n = 6 mice. c Representative images of hematoxylin-eosin (HE), safranin O/fast green, and toluidine blue staining images in the knee joint at week 9 post-administration. Scale bar = 200 μm. d Representative images of p16, p21, type II collagen (Col2), matrix metallopeptidase 13 (Mmp13) immunohistochemical staining and quantification in the knee joint at week 9 post-administration. Scale bar = 50 μm. e Representative images of aspartyl β-hydroxylase (Asph) immunohistochemical in the knee joint at week 9 post-administration. Asph was stained red (middle boxes), DAPI (4,6-diamino-2-phenyl indole) was blue (upper boxes), and merged images were shown in the lower boxes. Scale bar = 50 μm. f OARSI score, quantification of p16, p21, Col2, Mmp13, Asph positive cells in the knee joint at week 9 post-administration. n = 6 mice. Data were shown as means ± SD. P values in (b), positive cells of p16, p21, Col2, Mmp13, Asph in (f) were determined using one-way ANOVA followed by Tukey’s HSD multiple comparison test. P values for the OARSI score in (f) were determined with the two-sided Kruskal–Wallis test followed by the Mann–Whitney U test. Experiments in (c, d, e) were repeated independently three times with similar results. Source data are provided as a Source Data file.
Fig. 9
Fig. 9. Oral delivery of 10-HDA relieved chondrocyte senescence and cartilage degeneration in naturally aged mice in vivo.
a Young (8 weeks old, male, n = 6) or naturally aged (18 months old, male, n = 12) C57BL/6 J mice were administered after 1 week with vehicle (CMC-Na, 8 weeks old, male, n = 6; 18 months old, male, n = 6) or 10-HDA (100 mg/kg, 18 months old, male, n = 6) three times a week for 8 weeks through oral administration and sacrificed at week 9 post-administration. The joints were collected 9 weeks post-administration. b Representative images of the knee joint in each group at week 9 post-administration. n = 6 mice. c Transverse and anteroposterior diameters (mm) of knee joint were calculated by vernier caliper at week 9 post-administration. n = 6 mice. d Representative images of hematoxylin-eosin (HE), safranin O/fast green, and toluidine blue staining in the knee joint at week 9 post-administration. Scale bar = 200 μm. e OA severity was analyzed by the OARSI system at week 9 post-administration. n = 6 mice. f Representative images of p16, p21, type II collagen (Col2), matrix metallopeptidase 13 (Mmp13) immunohistochemical staining and quantification of positive cells in the knee joint at week 9 post-administration. Scale bar = 50 μm. n = 6 mice. Data were shown as means ± SD. P values in (c, f) were determined using one-way ANOVA followed by Tukey’s HSD multiple comparison test. P values for the OARSI score in (e) were determined with two-sided Kruskal–Wallis test followed by the Mann–Whitney U test. Experiments in (d, f) were repeated independently three times with similar results. Source data are provided as a Source Data file.
Fig. 10
Fig. 10. 10-HDA inhibited chondrocyte senescence by regulating the ASPH/ERK/p53/p21 and ASPH/GSK3β/p16 signaling pathways.
p21 (a) and p16 (b) mRNA levels in the control and ASPH knockout (KO) C28/I2 cells with or without re-expression of ASPH-Δ2 treated with 10 nM 10-HDA and 10 ng/ml IL-1β for 48 h. n = 3 biologically independent replicates (a). n = 3 biologically independent replicates (b). c ASPH/ERK/p53/p21 pathway activation in the control and ASPH-KO C28/I2 cells with or without re-expression of ASPH-Δ2 treated with 10 nM 10-HDA and 10 ng/ml IL-1β for 48 h. d ASPH/GSK3β/p16 pathway activation in the control and ASPH-KO C28/I2 cells with or without re-expression of ASPH-Δ2 treated with 10 nM 10-HDA and 10 ng/ml IL-1β for 48 h. e Western blot quantification for Fig. 10c. n = 3 biologically independent replicates. f Western blot quantification for Fig. 10d. n = 3 biologically independent replicates. g A model used to explain the signal pathways of 10-HDA binding with ASPH, resulting in the inhibition of chondrocyte senescence and protection against OA. Data were shown as means ± SD. P values in (a, b, e, f) were determined using two-way ANOVA followed by Tukey’s HSD multiple comparison test. Source data and uncropped blots are provided as a Source Data file. ERK extracellular signaling-regulated kinases, p-ERK phospho-extracellular signaling-regulated kinases, GSK3β glycogen synthase kinase-3β, p-GSK3β phospho-glycogen synthase kinase-3β.

References

    1. Martel-Pelletier, J. et al. Osteoarthritis. Nat. Rev. Dis. Prim. 2, 16072 (2016). - PubMed
    1. Boer, C. G. et al. Deciphering osteoarthritis genetics across 826,690 individuals from 9 populations. Cell184, 6003–6005 (2021). 10.1016/j.cell.2021.11.003 - DOI - PMC - PubMed
    1. Katz, J. N., Arant, K. R. & Loeser, R. F. Diagnosis and treatment of hip and knee osteoarthritis: a review. JAMA325, 568–578 (2021). 10.1001/jama.2020.22171 - DOI - PMC - PubMed
    1. Fang, C. L., Liu, B. & Wan, M. Bone-SASP” in skeletal aging. Calcif. Tissue Int.113, 68–82 (2023). 10.1007/s00223-023-01100-4 - DOI - PMC - PubMed
    1. Conaghan, P. G. et al. Therapeutic options for targeting inflammatory osteoarthritis pain. Nat. Rev. Rheumatol.15, 355–363 (2019). 10.1038/s41584-019-0221-y - DOI - PubMed

Publication types

MeSH terms

Substances

Associated data