. 2024 Sep 4;15(1):7733.
doi: 10.1038/s41467-024-51689-9.

Ingestion of Bacillus cereus spores dampens the immune response to favor bacterial persistence

Affiliations

Ingestion of Bacillus cereus spores dampens the immune response to favor bacterial persistence

Salma Hachfi et al. Nat Commun. .

Abstract

Strains of the Bacillus cereus (Bc) group are sporulating bacteria commonly associated with foodborne outbreaks. Spores are dormant cells highly resistant to extreme conditions. Nevertheless, the pathological processes associated with the ingestion of either vegetative cells or spores remain poorly understood. Here, we demonstrate that while ingestion of vegetative bacteria leads to their rapid elimination from the intestine of Drosophila melanogaster, a single ingestion of spores leads to the persistence of bacteria for at least 10 days. We show that spores do not germinate in the anterior part of the intestine which bears the innate immune defenses. Consequently, spores reach the posterior intestine where they germinate and activate both the Imd and Toll immune pathways. Unexpectedly, this leads to the induction of amidases, which are negative regulators of the immune response, but not to antimicrobial peptides. Thereby, the local germination of spores in the posterior intestine dampens the immune signaling that in turn fosters the persistence of Bc bacteria. This study provides evidence for how Bc spores hijack the intestinal immune defenses allowing the localized birth of vegetative bacteria responsible for the digestive symptoms associated with foodborne illness outbreaks.


Conflict of interest statement

The authors declare no competing interests.

Figures

Fig. 1
Fig. 1. Spores of the Bacillus cereus group persist in the Drosophila intestine.
a Experimental setup to assess bacterial load after a continuous ingestion of spores. b Bacterial loads of dissected midguts after continuous ingestion of spores from Btk or Bc strains. The dot indicates the mean number of colony-forming units (CFUs) of at least three independent experiments per condition and time point. Each experiment corresponds to the mean of five midguts. CFUs correspond to spore and vegetative cell counts. Error bars correspond to the SEM. Source data are provided as a Source Data file. c Experimental setup to assess bacterial load after an acute ingestion of spores. Flies are in contact with the contaminated medium for 30 min and then transferred to fresh vial devoid of spores. d Bacterial loads of dissected midguts after acute ingestion of spores from Btk or Bc strains. The dot indicates the mean number of CFUs (spores + vegetative cells) of at least three independent experiments per condition and time point. Each experiment corresponds to the mean of five midguts. Error bars correspond to the SEM. * represent a statistically significant difference (p < 0.05) between Bc Bactisubtil and the other strains 10 days post-feeding using the two-sided Non-parametric Mann–Whitney’s test against each individual condition at 240 h. Source data are provided as a Source Data file. e Bacterial loads in split Drosophila midguts after acute intoxication with Btk (SA-11) or Bc ATCC 14579 spores. Dots correspond to independent experiments and are the mean of five pooled midgut domains. Error bars correspond to the SEM. The one-side Mann–Whitney tests were applied. Asterisks represent a statistically significant difference between bacterial loads in the anterior and the posterior midguts: **p < 0.01, *p < 0.05. Source data are provided as a Source Data file.
Fig. 2
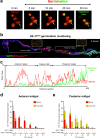
Fig. 2. Bt spores germinate preferentially in Drosophila posterior midgut.
a Time-lapse images of SA-11R/G spores during germination. b Monitoring of SA-11R/G germination in vivo in Drosophila midgut 4 h post-spore-ingestion. Insets show enlargement of a single focal plan. Note that anteriorly GFP (i.e. germinating spores) are barely detectable. c Plots of the average fluorescence intensity (represented as mean gray value) of SA-11R/G germination measured along the Drosophila midgut presented in b. For all plot analyses of average fluorescence shown in this paper, the red line represents the average of the spore fluorescence (NHS-ester Alexa546) and the green line represents the average fluorescence of vegetative cells (GFP). d, e Bacterial load of Btk (SA-11) or Bc (ATCC 14579) in anterior (d) and posterior (e) Drosophila midguts. Green bars (non-heated samples) represent the whole Btk or Bc bacterial loads (spores and vegetative cells). Red bars (heated samples) represent the proportion of spore loads. Data represent the mean ± SEM of at least five independent experiments. Each experiment corresponds to five split midgut. Source data are provided as a Source Data file.
Fig. 3
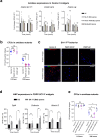
Fig. 3. Bc/Bt spores do not trigger midgut innate immune response.
a ROS monitoring one-hour post-acute feeding with SA-11 spores or vegetative cells. ROS production in the midgut is visualized by the HOCl-specific R19S probe (orange). DAPI (blue) marks the nuclei. b SA-11 loads in midguts knocked down for the expression of Duox in enterocytes 0.5 or 4 h after acute feeding with vegetative cells or spores. The horizontal axis indicates the mean number of CFUs. Dots correspond to independent experiments of five pooled midguts. c DptA-Cherry expression (red) in the anterior R1 midgut region (upper panel) and in the posterior R5 midgut region (bottom panel) of Drosophila fed for 30 min with H2O, Ecc15, SA-11 vegetative cells (Btvg) or SA-11 spores (Btsp) and observed 24 h later. In each panel anterior is to the left. Measured quantities are shown on the right graphs. The results are given as the relative expression compared with the control (H2O). At least three independent experiments were performed and each dot correspond to one midgut. d AttD-Gal4 UAS-Cherry expression (red, AttD>Cherry) in the anterior R1 midgut region (upper panel) and in posterior R4 midgut region (bottom panel) of Drosophila fed for 30 min with H2O, Ecc15, SA-11 vegetative cells (Btvg), or SA-11 spores (Btsp) and observed 24 h later. Measured quantities are shown on the right graphs. The results are given as the relative expression compared with the control (H2O). At least three independent experiments were performed and each dot correspond to one midgut. e qRT-PCR analyses of AMP expression in midgut upon acute feeding with SA-11 or Bc spores. UC corresponds to flies fed with water. For RT-qPCR results, mRNA levels in unchallenged wild-type flies were set to 100 and all other values were expressed as a percentage of this value. RT-qPCR results are shown as mean ± SEM. Dots correspond to independent experiments of 10 pooled female flies. f Bacterial load in the midguts of ∆AMP14 mutant flies 0.5 or 4 h after acute feeding with SA-11 spores. The horizontal axis indicates the mean number of CFUs per midgut. Each dot corresponds to an independent biological replicate where each replicate is the mean of five midguts. g Representative confocal images showing SA-11R/G spore germination in the anterior and posterior midgut of WT (Canton S) and ∆AMP14 mutant flies 2 h after acute feeding with spores. DAPI (blue) marks the nuclei. Spores are in red, vegetative cells in green. The yellow fluorescence corresponds to germinating spores. Error bars correspond to the SEM. The two-sided Mann–Whitney test was applied in bd and f. A two-sided Student’s t-tests were used to analyze data in e. *p ≤ 0.05, **p ≤ 0.01, ***p ≤ 0.001, ns non-significant (exact P values are provided in the source data). Source data are provided as a Source Data file.
Fig. 4
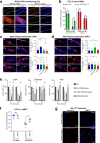
Fig. 4. Amidases are involved in Bt/Bc persistence.
a qRT-PCR analyses of amidase expressions in midguts upon SA-11 or Bc spore acute feeding. UC corresponds to flies fed with water. Results are shown as mean ± SEM. The dots correspond to independent experiments of 10 pooled female flies. b Bacterial load in midguts of PGRP-SC1/2Δ double mutant or PGRP-LBΔE mutant 0.5 or 120 h after SA-11 acute feeding with spores. The horizontal axis indicates the mean number of CFUs per midgut. Each dot corresponds to an independent biological replicate where each replicate is the mean of five midguts. c Representative confocal images showing SA-11R/G spore germination in the anterior and posterior midgut of WT (Canton S), PGRP-SC1/2Δ double mutant or PGRP-LBΔE mutant flies 6 h after spore acute feeding. DAPI (blue) marks the nuclei. Spores are in red, vegetative cells in green. The yellow fluorescence corresponds to germinating spores (Fig. 2a). d qRT-PCR analyses of AMP expressions in midguts of PGRP-SC1/2Δ mutants following acute feeding with SA-11 spores. UC corresponds to PGRP-SC1/2Δ flies fed with water. mRNA levels in unchallenged PGRP-SC1/2Δ flies were set to 100 and all other values were expressed as a percentage of this value. Results are shown as mean ± SEM. Dots correspond to independent experiments of the mean of 10 pooled female midguts. e SA-11 load in midguts of flies silenced for PGRP-SC2 or PGRP-LB or overexpressing PGRP-SC2 specifically in enterocytes (using the myo1Ats driver) 0.5 or 120 h after acute feeding with spores. The horizontal axis indicates the mean number of CFUs per midgut. Each dot corresponds to an independent biological replicate where each replicate is the mean of five midguts. Error bars represent SEM. Two-sided Student’s t-tests were used to analyze data in a and d. Two-sided Mann–Whitney test was used to analyze data in b and e. *p ≤ 0.05, **p ≤ 0.01, ***p ≤ 0.001, ns non-significant (P values are provided in the source data file). Source data are provided as a Source Data file.
Fig. 5
Fig. 5. Imd pathway components are involved in Bt persistence.
a, b SA-11 bacterial load in midguts of different genotypes for components of the Imd pathway 0.5 or 120 h after acute feeding with spores. a Homozygous loss of function mutants for PGRP-LE112, PGRP-LCΔ, Imdshaddok or DreddF64. b Homozygous loss of function mutant for RelE20 or double homozygous loss of function mutant for PGRP-SC1/2Δ; RelE20. Silenced (RelRNAi) or overexpressed (RelVP16) Relish in enterocytes (using the myo1Ats driver). The horizontal axis indicates the mean number of CFUs per midgut. Each dot corresponds to an independent biological replicate where each replicate is the mean of five midguts. c Representative confocal images showing SA-11R/G spore germination in the anterior and posterior midgut of WT flies (Canton S) and RelE20 mutant flies 6 h after acute feeding with spores. DAPI (blue) marks the nuclei. Spores are in red, vegetative cells in green. The yellow fluorescence corresponds to germinating spores (see Fig. 2a). dg RT-qPCR analyses of the expression of AMPs (d and f) and amidases (e and g) in RelE20 (d and f) and PGRP-LE112 (e and g) mutant flies 4 h and 24 h after acute feeding with SA-11 spores. UC corresponds to flies fed with water. The dots correspond to independent experiments of 10 pooled female flies. RT-qPCR are represented as relative level of expression normalized to RP49 and Dp1 genes. Error bars represent SEM. Two-sided Mann–Whitney test was used to analyze data in a and b. Two-sided Student’s t tests were used to analyze data in dg. *p ≤ 0.05, **p ≤ 0.01, ***p ≤ 0.001, ns non-significant (P values are provided in the source data file). Source data are provided as a Source Data file.
Fig. 6
Fig. 6. The Toll pathway is involved in Bt persistence.
a SA-11 bacterial load in midguts of Dif1 or Myd88KG03447 homozygous loss of function mutant, or in midguts silenced for Toll (TollRNAi) in enterocytes (using the myo1Ats driver) 0.5 or 120 h after acute feeding with spores. The horizontal axis indicates the mean number of CFUs per midgut. Each dot corresponds to an independent biological replicate where each replicate is the mean of five midguts. b Representative confocal images showing SA-11R/G spore germination in the anterior and posterior midgut of WT flies (Canton S) and Dif1 homozygous mutant flies 6 h after acute feeding with spores. DAPI (blue) marks the nuclei. Spores are in red, vegetative cells in green. The yellow fluorescence corresponds to germinating spores (Fig. 2a). cf RT-qPCR analyses of the expression of AMPs (c and e) and amidases (d and f) in Dif1 (c and d) or Myd88KG0344 (e and f) homozygous mutant flies 4 and 24 h after acute feeding with SA-11 spores. Unchallenged flies (UC) corresponds to flies fed with water. The dots correspond to independent experiments of 10 pooled midguts. Error bars represent mean ± SEM of at least three independent experiments. Two-sided Mann–Whitney test was used to analyze data in A. Two-sided Student’s t tests were used to analyze data in cf. *p ≤ 0.05, **p ≤ 0.01, ***p ≤ 0.001, ns non-significant (P values are provided in the source data file). Source data are provided as a Source Data file.
Fig. 7
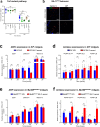
Fig. 7. Dif and Relish are synergistically involved in Bt persistence.
a SA-11 bacterial load in midguts of Dif1;RelE20 homozygous mutants 0.5 or 120 h after acute feeding with spores. The horizontal axis indicates the mean number of CFUs per midgut. Each dot corresponds to an independent biological replicate where each replicate is the mean of five midguts. b Representative confocal images showing SA-11R/G spore germination in the anterior and posterior midgut of WT flies (Canton S) and Dif1;RelE20 homozygous mutant flies 6 h after acute feeding with spores. DAPI (blue) marks the nuclei. Spores are in red, vegetative cells in green. The yellow fluorescence corresponds to germinating spores. c, d RT-qPCR analyses of the expression of AMPs (c) and amidases (d) in Dif1;RelE20 homozygous mutant flies 4 and 24 h after acute feeding with SA-11 spores. UC corresponds to flies fed with water. The dots correspond to independent experiments of 10 pooled female flies. Data represent mean ± SEM. Two-sided Mann–Whitney test was used to analyze data in a. Two-sided Student’s t tests were used to analyze data in c and d. *p ≤ 0.05, **p ≤ 0.01, ***p ≤ 0.001, ns = non-significant (P values are provided in the source data file). Source data are provided as a Source Data file. e Bacterial persistence upon ingestion of spores. Upper part: ingestion of vegetative cells triggers the release of ROS in the lumen by the Duox enzyme located in anterior enterocytes. In addition to their bacteriostatic activity, ROS induce visceral spasms that accelerate bacterial clearance. Then, the binding of PGNs to the PGRP-LC transmembrane receptor activates the IMD pathway, leading to the release of AMPs which in turn kill the remaining bacteria. Lower part: ingested spores are not perceived by the anterior midgut. Spores reach the posterior midgut where they encounter favorable conditions for their germination. The release of PGNs by the germinating bacteria stimulates the cytoplasmic PGRP-LE receptor directly and the Toll receptor indirectly. The activated IMD and Toll pathways converge on the NF-kB factors Relish and Dif, which activate the genes encoding amidases. The secreted amidases, by digesting PGNs, exert a negative feedback on AMPs production in the posterior midgut, favoring bacterial persistence.

Similar articles

Cited by

References

    1. Capo, F., Wilson, A. & Di Cara, F. The intestine of Drosophila melanogaster: an emerging versatile model system to study intestinal epithelial homeostasis and host-microbial interactions in humans. Microorganisms7, microorganisms7090336 (2019).10.3390/microorganisms7090336 - DOI - PMC - PubMed
    1. Royet, J. & Charroux, B. Mechanisms and consequence of bacteria detection by the Drosophila gut epithelium. Gut4, 259–263 (2013). - PMC - PubMed
    1. Kim, S. H. & Lee, W. J. Role of DUOX in gut inflammation: lessons from Drosophila model of gut-microbiota interactions. Front Infect. Microbiol3, 116 (2014). - PMC - PubMed
    1. Benguettat, O. et al. The DH31/CGRP enteroendocrine peptide triggers intestinal contractions favoring the elimination of opportunistic bacteria. PLoS Pathog.14, e1007279 (2018). 10.1371/journal.ppat.1007279 - DOI - PMC - PubMed
    1. Bosco-Drayon, V. et al. Peptidoglycan sensing by the receptor PGRP-LE in the Drosophila gut induces immune responses to infectious bacteria and tolerance to microbiota. Cell Host Microbe12, 153–165 (2012). 10.1016/j.chom.2012.06.002 - DOI - PubMed

Publication types

MeSH terms

LinkOut - more resources