. 2024 Sep 4;15(1):7376.
doi: 10.1038/s41467-024-51125-y.

High-throughput fluorescence lifetime imaging flow cytometry

Affiliations

High-throughput fluorescence lifetime imaging flow cytometry

Hiroshi Kanno et al. Nat Commun. .

Erratum in

  • Publisher Correction: High-throughput fluorescence lifetime imaging flow cytometry.
    Kanno H, Hiramatsu K, Mikami H, Nakayashiki A, Yamashita S, Nagai A, Okabe K, Li F, Yin F, Tominaga K, Bicer OF, Noma R, Kiani B, Efa O, Büscher M, Wazawa T, Sonoshita M, Shintaku H, Nagai T, Braun S, Houston JP, Rashad S, Niizuma K, Goda K. Kanno H, et al. Nat Commun. 2025 Jan 10;16(1):582. doi: 10.1038/s41467-025-55961-4. Nat Commun. 2025. PMID: 39794325 Free PMC article. No abstract available.

Abstract

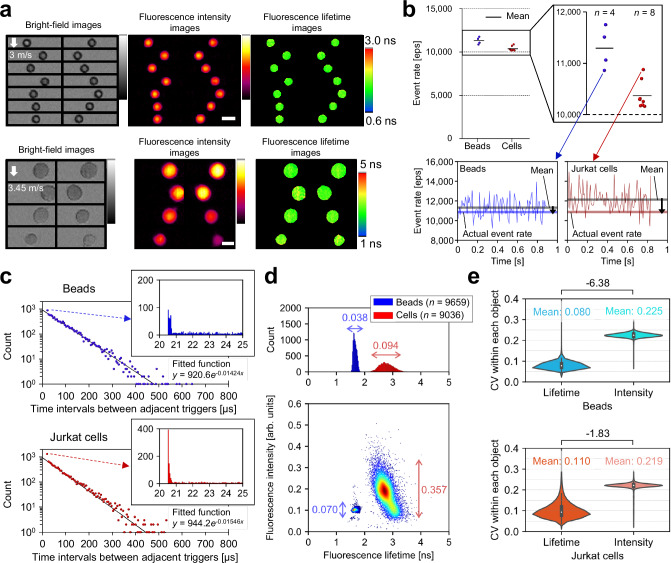
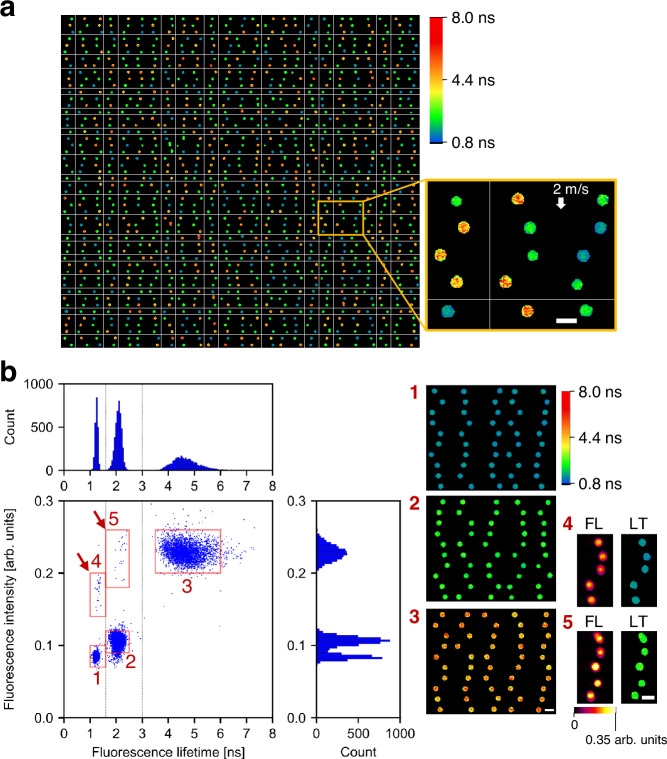
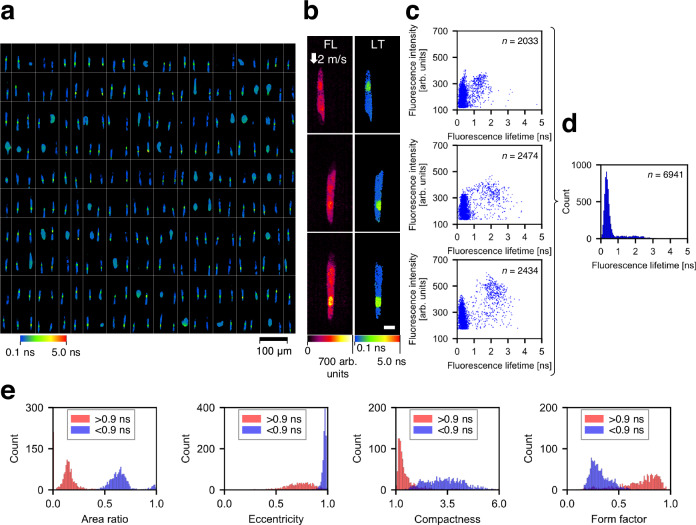
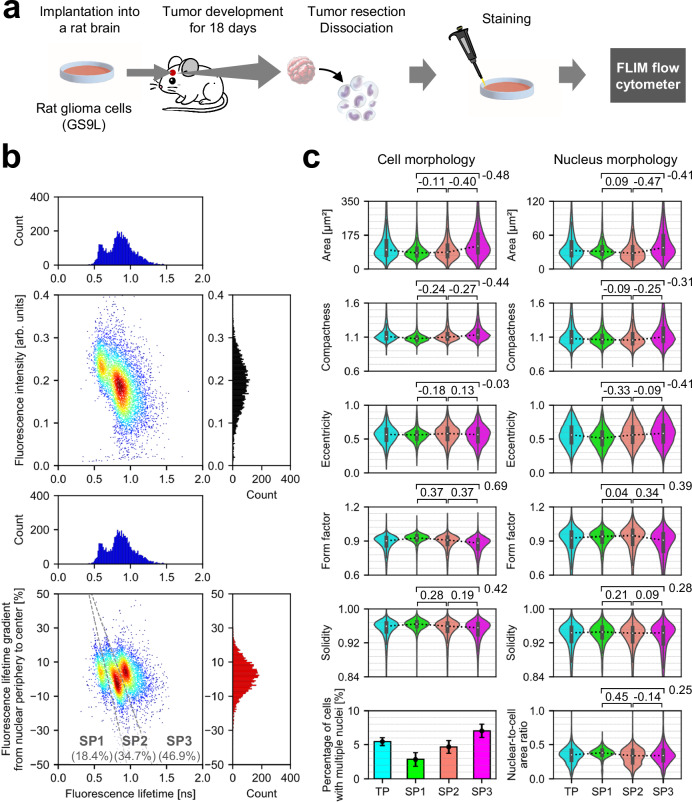
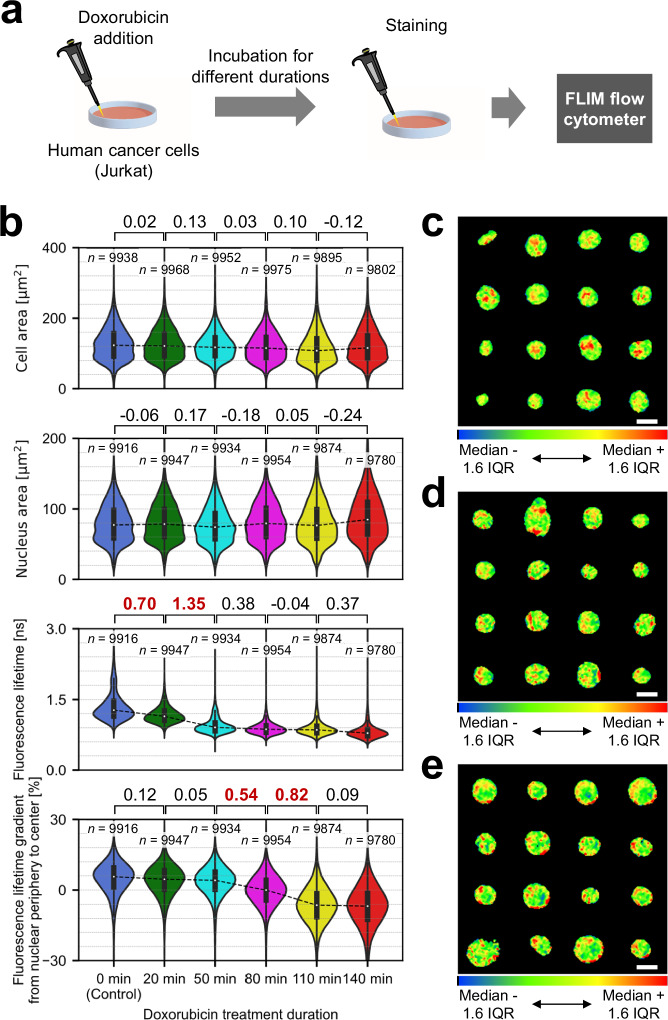
Flow cytometry is a vital tool in biomedical research and laboratory medicine. However, its accuracy is often compromised by undesired fluctuations in fluorescence intensity. While fluorescence lifetime imaging microscopy (FLIM) bypasses this challenge as fluorescence lifetime remains unaffected by such fluctuations, the full integration of FLIM into flow cytometry has yet to be demonstrated due to speed limitations. Here we overcome the speed limitations in FLIM, thereby enabling high-throughput FLIM flow cytometry at a high rate of over 10,000 cells per second. This is made possible by using dual intensity-modulated continuous-wave beam arrays with complementary modulation frequency pairs for fluorophore excitation and acquiring fluorescence lifetime images of rapidly flowing cells. Moreover, our FLIM system distinguishes subpopulations in male rat glioma and captures dynamic changes in the cell nucleus induced by an anti-cancer drug. FLIM flow cytometry significantly enhances cellular analysis capabilities, providing detailed insights into cellular functions, interactions, and environments.


Conflict of interest statement

K.G. is a shareholder of CYBO. M.S. and K.G. are shareholders of FlyWorks. H.K., K.H., H.M., and K.G. have filed a patent application covering high-throughput fluorescence lifetime imaging flow cytometry. The other authors have no competing interests.

Figures

Fig. 1
Fig. 1. High-throughput FLIM flow cytometry.
f1fn denote modulation frequencies (n: the total number of modulation frequencies). a Schematic of the high-throughput FLIM flow cytometer. Dual intensity-modulated beam arrays enable double interrogation of a flowing cell, enhancing the precision of FLIM image acquisitions. APD: avalanche photodetector. b Principle of fluorescence lifetime pixel acquisition with a complementary modulation frequency pair (flow and fhigh). The time-varying phase delay of the fluorescence signal relative to the excitation was used for generating fluorescence lifetime images. fmean = (flow + fhigh)/2 = (f1 + fn)/2. c, Amplitude and phase image pairs generated from intensity-modulated beam arrays. t1tm represent time points (m: the number of time points acquired for each triggered event). dg Images of beads and cells acquired with the FLIM flow cytometer. BF bright-field, FL fluorescence, LT fluorescence lifetime. Scale bars: 10 μm. Two, two, four, and five independent experiments were performed, resulting in similar results for panels dg, respectively. d Polymer beads with different fluorescence lifetimes. e Euglena gracilis cells stained with SYTO16. f Tumor-derived rat glioma cells stained with SYTO16. g Human cancer cells (Jurkat) stained with SYTO16.
Fig. 2
Fig. 2. Demonstration of FLIM flow cytometry at over 10,000 eps.
The panels (a, line graphs in b, ce) were generated from one of the image acquisition trials of 10,000 consecutively triggered events, from which 6-μm fluorescent beads (n = 9659) and Jurkat cells (n = 9036) were extracted (Supplementary Fig. 3). a, Representative images of 6-μm beads obtained at 10,862 eps and of Jurkat cells stained with Calcein-AM obtained at 10,877 eps. Scale bars: 10 μm. b Demonstrated event rates. The line graphs show the relationship between the instantaneous (per 100 events), mean, and actual event rates calculated from 10,000 event acquisitions. n represents the number of image acquisition trials conducted. c Distributions of time intervals (n = 9999) between adjacent trigger events for beads (top, blue) and cells (bottom, red). Each dot in the scatter plots represents the total number of time intervals within every 5 μs as the vertical value and their average as the horizontal value. Histograms show the details of the dots representing 20–25 μs time intervals. Solid lines are exponential fits to the dots based on the least absolute residuals. d Distributions of beads and cells in fluorescence intensity and fluorescence lifetime. The double-headed arrows indicate the coefficient of variations (CVs) for fluorescence intensity and fluorescence lifetime. e Distributions of beads (n = 9659) and cells (n = 9036) in the CVs of fluorescence intensity and fluorescence lifetime pixels within each object. Difference values between two samples represent effect sizes (Cohen’s d), with their standard errors less than 0.04. The violin plots display the median values with white dots, the first and third quartiles with box edges, and 1.5 times the interquartile range (IQR) with whiskers. Source data are provided as a Source Data file.
Fig. 3
Fig. 3. Differentiation of inter-object fluorescence lifetime components by FLIM flow cytometry.
Scale bars: 10 μm. a Representative fluorescence lifetime images (50 rows × 25 columns) obtained from a mixture of 6.5-μm polymer beads with fluorescence lifetime values of 1.7 ns, 2.7 ns, and 5.5 ns. The flow speed was 2 m/s. Two independent experiments were performed, resulting in similar results. b Distributions of the fluorescent beads (n = 9945). Dashed lines represent 1.6 ns and 3.0 ns. The right images show the beads randomly picked from the corresponding red boxes in the scatter plot. FL fluorescence intensity, LT fluorescence lifetime. Source data are provided as a Source Data file.
Fig. 4
Fig. 4. Differentiation of intra-object fluorescence lifetime components by FLIM flow cytometry.
a Representative fluorescence lifetime images (10 rows × 25 columns) of E. gracilis cells stained with SYTO16 and flowing at 2 m/s. The images were segmented by a specific threshold value of fluorescence intensity (160 arb. units). Only E. gracilis cells with elongated shapes (eccentricity > 0.95) were used for subsequent analyses (be). b Representative images of E. gracilis cells with an eccentricity of >0.95, which includes images in Fig. 1e. FL fluorescence intensity, LT fluorescence lifetime. Scale bar: 10 μm. Two independent experiments were performed, resulting in similar results for panels a and b. c Scatter plots showing pixel distributions in fluorescence intensity and fluorescence lifetime corresponding to the images in panel b. n represents the number of image pixels. d Histogram of the pixel values from the fluorescence lifetime images in panel b. n represents the number of image pixels. e Representative morphological features of objects occupied with <0.9-ns pixels (blue, n = 1290) and with >0.9-ns pixels (red, n = 1079). The area ratio is defined as the ratio of an object area with <0.9 ns or > 0.9 ns to the entire cell area. Source data are provided as a Source Data file.
Fig. 5
Fig. 5. Investigation of cellular heterogeneity in rat glioma with FLIM flow cytometry.
a Experimental procedure. b Distributions of tumor-derived rat glioma cells in fluorescence intensity (black histogram), fluorescence lifetime (blue histogram), and fluorescence lifetime gradient from nuclear periphery to center (red histogram). SP: subpopulation. n = 5732. c Comparison of subpopulations in morphological features of cells and their nuclei. TP: total population. Values between two samples represent effect sizes (Cohen’s d), with their standard errors <0.04. The violin plots display the median values with white dots, the first and third quartiles with box edges, and 1.5 times the IQR with whiskers. For the violin plots, the sample sizes are as follows: TP: n = 5732; SP1: n = 1054; SP2: n = 1991; SP3: n = 2687. The bar plot illustrates the percentage of cells with multiple nuclei calculated for each cell population, accompanied by the upper and lower bounds of its 95% confidence interval. Source data are provided as a Source Data file.
Fig. 6
Fig. 6. Large-scale analysis of drug-induced temporal nucleus dynamics with FLIM flow cytometry.
a Experimental procedure. b Comparison of temporal evolution data in cell area, nucleus area, fluorescence lifetime, and fluorescence lifetime gradient from nuclear periphery to center. Values between two samples represent effect sizes (Cohen’s d), with their standard errors <0.02. Effect sizes with absolute values exceeding 0.5 are highlighted in bold and red. The violin plots display the median values with white dots, the first and third quartiles with box edges, and 1.5 times the IQR with whiskers. c-e, Examples of standardized fluorescence lifetime images of Jurkat cells treated with doxorubicin for 0 min (c), 80 min (d), and 140 min (e), and stained with SYTO16. The standardization was performed by adjusting the color scale to the range of median ±1.6IQR of fluorescence lifetime pixel values from each nucleus, after compensating for the fluorescence lifetime slope across a field of view and applying a 3 × 3 median filter. Each image set shows the following fluorescence lifetime gradient from nuclear periphery to center (c: 12%, d: 0%, e: −12%, to a tolerance of ±0.1%). Scale bars: 10 μm. Two independent experiments were performed, resulting in similar results. Source data are provided as a Source Data file.

References

    1. Cossarizza, A. et al. Guidelines for the use of flow cytometry and cell sorting in immunological studies (third edition). Eur. J. Immunol.51, 2708–3145 (2021). - PMC - PubMed
    1. Robinson, J. P. Flow cytometry: past and future. Biotechniques72, 159–169 (2022). - PubMed
    1. Perfetto, S. P., Chattopadhyay, P. K. & Roederer, M. Seventeen-colour flow cytometry: unravelling the immune system. Nat. Rev. Immunol.4, 648–655 (2004). - PubMed
    1. Brown, M. & Wittwer, C. Flow cytometry: principles and clinical applications in hematology. Clin. Chem.46, 1221–1229 (2000). - PubMed
    1. Kuroda, Y. et al. Unique multipotent cells in adult human mesenchymal cell populations. Proc. Natl Acad. Sci. USA107, 8639–8643 (2010). - PMC - PubMed

Publication types

Substances

LinkOut - more resources