. 2024 Sep 4;15(1):7728.
doi: 10.1038/s41467-024-51983-6.

Hypothalamic-hindbrain circuit for consumption-induced fear regulation

Affiliations

Hypothalamic-hindbrain circuit for consumption-induced fear regulation

Qin Wang et al. Nat Commun. .

Abstract

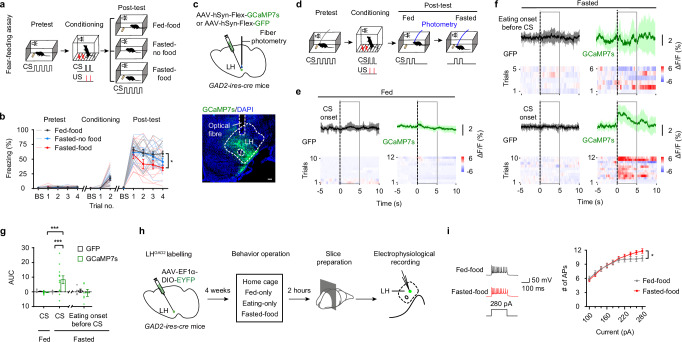
To ensure survival, animals must sometimes suppress fear responses triggered by potential threats during feeding. However, the mechanisms underlying this process remain poorly understood. In the current study, we demonstrated that when fear-conditioned stimuli (CS) were presented during food consumption, a neural projection from lateral hypothalamic (LH) GAD2 neurons to nucleus incertus (NI) relaxin-3 (RLN3)-expressing neurons was activated, leading to a reduction in CS-induced freezing behavior in male mice. LHGAD2 neurons established excitatory connections with the NI. The activity of this neural circuit, including NIRLN3 neurons, attenuated CS-induced freezing responses during food consumption. Additionally, the lateral mammillary nucleus (LM), which received NIRLN3 projections, along with RLN3 signaling in the LM, mediated the decrease in freezing behavior. Collectively, this study identified an LHGAD2-NIRLN3-LM circuit involved in modulating fear responses during feeding, thereby enhancing our understanding of how animals coordinate nutrient intake with threat avoidance.


Conflict of interest statement

The authors declare no competing interests.

Figures

Fig. 1
Fig. 1. Consumption-induced freezing regulation with LHGAD2 involvement.
a Schematic of fear-feeding assay. CS conditioned stimulus, US unconditioned stimulus. b Assessment of freezing responses at baseline (BS) and during CSs for each session of the fear-feeding assay, n = 12 mice/group, dark- and light-colored lines each represent average and individual, respectively. c Schematic representing LHGAD2 GCaMP recordings with representative image indicating locations of GCaMP transduction and optical fibers. Scale bar, 100 µm. d Experimental design outlining LHGAD2 fiber photometry. Traces and heat maps from LHGAD2 fiber photometry in GFP- or GCaMP7s-injected mice responding to CS under fed (e) and fasted (f, bottom) states, and beginning to feed before CS presentation (f, top). The normalized change in fluorescence (ΔF/F) was calculated. Black dashed lines at time 0 denote CS or eating onset. Black and green solid lines indicate average fluorescence traces, while shadings represent 95% confidence interval. g Mean area under the curve (AUC) from LHGAD2 fiber photometry responses to CS and eating onset. Data were extracted within a 5-s window following CS presentation or eating onset (gray frame in (e, f)). eg n = 10 trials/5 GFP mice, 12 trials/6 GCaMP7s mice for CSs; n = 5 trials/5 GFP mice, 6 trials/6 GCaMP7s mice for eating onset. h Schematics of EYFP labeling and neuronal recordings of LHGAD2 neurons. i Representative traces showing firing responses to a 280-pA current injection (left) and number of action potentials (AP; right) evoked by step current injection (100–280 pA with a 20-pA step) in LHGAD2 neurons, n = 40 neurons/3 mice per group. Data were presented as the mean ± SEM; *p < 0.05, ***p < 0.001. Statistical significance was assessed using two-way repeated measures (RM) ANOVA with Tukey’s multiple-comparisons tests (b) or uncorrected Fisher’s least significant difference (LSD) multiple-comparisons test (for CS in (g)), two-sided unpaired t-test (for eating onset before CS in (g)) or two-way RM ANOVA (i). Source data and exact p value are provided as a Source Data file.
Fig. 2
Fig. 2. Synaptic connectivity of LHGAD2-NIRLN3 circuit.
a Anterograde tracing strategy of LHGAD2 neurons. b Representative fluorescence within the LH, with arrowheads indicating starter cells. c RNAscope in situ hybridization in the NI, with cells co-expressing tdTomato and RLN3 denoted by arrowhead. d Percentage of cells co-expressing tdTomato and RLN3. n = 4 mice. e Retrograde tracing strategy of NIRLN3 neurons. f Representative fluorescence within the NI, with arrowheads indicating starter cells. g RNAscope in situ hybridization in the LH, with cyan arrowheads denoting mCherry-labeled GAD2-expressing cells which partially co-express Slc17a6 as indicated by orange arrowheads. h Proportional distribution of RV-infected LH cells. n = 4 mice. i Schematic of electrophysiological recordings. j Traces of optogenetically evoked excitatory (oEPSCs) and inhibitory post-synaptic currents (oIPSCs) from NI neurons upon LHGAD2 fiber stimulation. TTX and 4-AP were dissolved in artificial cerebral spinal fluid (ASCF), with bath application. Gray and pink lines each represent 160 individual traces; dark and red lines each represent average; blue lines signify light stimulation. k Average oEPSC and oIPSC amplitudes from photoactivated NI cells. n = 8 neurons/3 mice. l Representative traces of oEPSCs (above), opto-evoked excitatory post-synaptic potentials (oEPSPs; middle), and opto-evoked action potentials (APs; below) from photoactivated NI cells. n = 9 neurons/3 mice. m Schematic for LHGAD2-NI GCaMP recordings (top) with representative image showing GCaMP transduction and implantation site of optical fiber (bottom). np LHGAD2-NI fiber photometry signals in GFP- or jGCaMP7b-injected mice responding to conditioned stimulus (CS) under fed (n) and fasted (o) states. n, o Black dashed line indicates CS onset (time = 0); solid lines indicate average fluorescence traces, while shadings represent 95% confidence interval; gray frames show 5-s windows post-CS onset, which are used for calculations of area under the curve (AUC). np n = 12 trials/6 GFP mice, 18 trials/9 jGCaMP7b mice. Scale bar, 100 µm. Data were presented as the mean ± SEM; **p < 0.01, ****p < 0.0001. Statistical significance was assessed using two-way repeated measures (RM) ANOVA with uncorrected Fisher’s LSD multiple-comparisons test (p). Source data and exact p value are provided as a Source Data file.
Fig. 3
Fig. 3. LHGAD2-NI control of consumption-induced freezing regulation.
a Schematic for LHGAD2-NI photoinhibition (left) with representative NpHR:mCherry distribution of transduced LHGAD2 somata (middle) and axons (right). Optical fiber was positioned above the NI. Scale bar, 100 µm. b Photoinhibition of LHGAD2-NI pathway increased freezing response in fear-conditioned mice during food consumption. Mice received two conditioned stimuli (CSs) paired with the unconditioned stimulus (US) during conditioning session. Continuous yellow light stimuli were applied during CSs of the post-test session (above), and freezing responses at baseline (BS) and during CSs were tested (down). Dark- and light-colored lines each represent average and individual, respectively. c Photoinhibition of LHGAD2-NI terminals had no significant effect on fear-induced eating inhibition. The differences in eating time (ΔEating) at BS and during CSs between the post-test and pretest sessions were assessed. b, c n = 15 mice/group. d Schematic of LHGAD2-NI photoactivation (left) with representative ChR2:EYFP distribution of transduced LHGAD2 somata (middle) and axons (right). Optical fiber was positioned above the NI. Scale bar, 100 µm. e Photoactivation of LHGAD2-NI pathway reduced freezing response of CS-conditioned mice during food consumption. Mice were subjected to three CSs paired with the US during conditioning session. 20 Hz blue light stimuli were applied during CSs of the post-test session (above), and freezing response to CS is shown (down). Dark- and light-colored lines each represent average and individual, respectively. f Photoactivation of LHGAD2-NI pathway reversed fear-induced eating inhibition. e, f n = 16 mice/group. Data were presented as the mean ± SEM; **p < 0.01, ***p < 0.001, ****p < 0.0001. Statistical significance was assessed using two-way RM ANOVA (b, e) or two-way repeated measures (RM) ANOVA with uncorrected Fisher’s LSD multiple-comparisons test (c, f). Source data and exact p value are provided as a Source Data file.
Fig. 4
Fig. 4. NIRLN3 responses to CS presentation.
a Schematic for NIRLN3 GCaMP recordings (left) with representative image showing GCaMP transduction and implantation site of optical fiber (right). Scale bar, 100 µm. bd NIRLN3 fiber photometry signals in GFP- or GCaMP7s-injected mice responding to conditioned stimulus (CS) under fed (b) and fasted (c) states. The normalized change in fluorescence (ΔF/F) was calculated. b, c Black dashed line indicates CS onset (time = 0); solid lines indicate average fluorescence traces, while shadings represent 95% confidence interval; gray frames show 5-s windows post-CS onset, which are used for calculations of area under the curve (AUC). bd n = 14 trials/7 mice/group. e Schematic for NIRLN3 GCaMP recording accompanying inhibition of LH inputs (left), and representative image demonstrating GCaMP7s expression and sites of optical fiber and cannula (right). Scale bar, 100 µm. f, g NIRLN3 fiber photometry signals in fasted mCherry- or hM4Di-injected mice responding to CS after the infusion of clozapine-N-oxide (CNO) into the NI. f Black dashed line indicates CS onset (time = 0); solid lines indicate average fluorescence traces, while shadings represent 95% confidence interval; gray frames show 5-s windows post-CS onset, which are used for calculations of area under the curve (AUC). f, g n = 10 trials/5 mCherry mice, 12 trials/6 hM4Di mice. Data were presented as the mean ± SEM; *p < 0.05, **p < 0.01. Statistical significance was assessed using two-way repeated measures (RM) ANOVA with uncorrected Fisher’s LSD multiple-comparisons test (d) or two-sided unpaired t-test (g). Source data and exact p value are provided as a Source Data file.
Fig. 5
Fig. 5. NIRLN3 involvement in consumption-induced freezing regulation.
a Schematic for NIRLN3 photoinhibition (left) with representative NpHR:mCherry distribution of transduced NIRLN3 somata (right). Optical fiber was situated above the NI. Scale bar, 100 µm. b NIRLN3 photoinhibition increased freezing response of fear-conditioned mice during food consumption. Mice received two conditioned stimuli (CSs) paired with the unconditioned stimulus (US) during conditioning session. Continuous yellow light stimuli were applied during CS of the post-test session (above), and freezing responses at baseline (BS) and during CS were tested (down). Dark- and light-colored lines each represent average and individual, respectively. c NIRLN3 photoinhibition worsened fear-induced eating inhibition. The differences in eating time (ΔEating) at BS and during CSs between the post-test and pretest sessions were assessed. b, c n = 12 mice/group. d Schematic for NIRLN3 photoactivation (left) with representative oChIEF:tdTomato distribution of transduced NIRLN3 somata (right). Optical fiber was placed above the NI. Scale bar, 100 µm. e NIRLN3 photoactivation led to a reduction in freezing response to CSs during food consumption. Mice received three CSs paired with the US during conditioning session. Burst stimulation of blue light was administered during CSs of the post-test session (above), and freezing responses at BS and during CS were tested (down). Dark- and light-colored lines each represent average and individual, respectively. f NIRLN3 photoactivation did not alter fear-induced eating inhibition. e, f n = 10 mice/group. Data were presented as the mean ± SEM; *p < 0.05, ***p < 0.001, ****p < 0.0001. Statistical significance was assessed using two-way RM ANOVA (b, e) or two-way repeated measures (RM) ANOVA with uncorrected Fisher’s LSD multiple-comparisons test (c, f). Source data and exact p value are provided as a Source Data file.
Fig. 6
Fig. 6. NIRLN3-LM outputs- and RLN3 signaling-mediated consumption regulation of freezing.
a Schematic for NIRLN3-LM photoinhibition (top) with representative NpHR:mCherry distribution of transduced NIRLN3 somata and axons (bottom). Optical fiber was positioned above the LM. Scale bar, 100 µm. b Photoinhibition of the NIRLN3-LM pathway increased freezing response in fear-conditioned mice during food consumption. Mice received continuous yellow light stimulation during the conditioned stimulus (CS; above). Freezing responses at baseline (BS) and during CSs were tested (down). Dark- and light-colored lines each represent average and individual, respectively. c Photoinhibition of NIRLN3-LM terminals had no significant effect on fear-induced eating inhibition. The differences in eating time (ΔEating) at BS and during CSs between the post-test and pretest sessions were assessed. b, c n = 15 mCherry mice, 14 NpHR mice. d Schematic for LHGAD2-NI photoactivation combined with LM blockade of RLN3 signaling (left), and representative ChR2:EYFP distribution of transduced LHGAD2 somata and axons (middle) and catheter position (right). Optical fiber was placed above the NI. Catheter was implanted at an inclined angle at the top of the LM. Scale bar, 100 µm. e LHGAD2-NI photoactivation decreased freezing response of fear-conditioned mice during food consumption, with blockade of LM RLN3 signaling partly impairing this effect. Mice received relaxin-family peptide 3 receptor (RXFP3) antagonist or saline injection into the LM 15 min before behavioral experiments (above). Freezing responses at BS and during CSs were tested (down). Dark- and light-colored lines each represent average and individual, respectively. f LHGAD2-NI photoactivation countered fear-induced eating inhibition insensitivity to LM blockade of RLN3 signaling. e, f n = 13 mice for EYFP-Saline group, 12 mice for ChR2-Saline, and ChR2-R3(B1-22)R group, respectively. Data were presented as the mean ± SEM; *p < 0.05, **p < 0.001, ***p < 0.001, ****p < 0.0001. Statistical significance was assessed using two-way RM ANOVA (b), two-way RM ANOVA with uncorrected Fisher’s LSD multiple-comparisons test (c, f) or Tukey’s multiple-comparisons tests (e). Source data and exact p value are provided as a Source Data file.

Similar articles

Cited by

References

    1. Stunkard, A. J., Faith, M. S. & Allison, K. C. Depression and obesity. Biol. Psychiatry54, 330–337 (2003). 10.1016/S0006-3223(03)00608-5 - DOI - PubMed
    1. Simon, G. E. et al. Association between obesity and psychiatric disorders in the US adult population. Arch. Gen. Psychiatry63, 824–830 (2006). 10.1001/archpsyc.63.7.824 - DOI - PMC - PubMed
    1. Johnston, E., Johnson, S., McLeod, P. & Johnston, M. The relation of body mass index to depressive symptoms. Can. J. Public Health95, 179–183 (2004). 10.1007/BF03403643 - DOI - PMC - PubMed
    1. Thomas, M. A. & Xue, B. Mechanisms for AgRP neuron-mediated regulation of appetitive behaviors in rodents. Physiol. Behav.190, 34–42 (2018). 10.1016/j.physbeh.2017.10.006 - DOI - PMC - PubMed
    1. Gouveia, A., de Oliveira Beleza, R. & Steculorum, S. M. AgRP neuronal activity across feeding-related behaviours. Eur. J. Neurosci.54, 7458–7475 (2021). 10.1111/ejn.15498 - DOI - PubMed

Publication types

LinkOut - more resources