. 2024 Sep 4;15(1):7735.
doi: 10.1038/s41467-024-51743-6.

Human milk oligosaccharides are associated with maternal genetics and respiratory health of human milk-fed children

Affiliations

Human milk oligosaccharides are associated with maternal genetics and respiratory health of human milk-fed children

Amirthagowri Ambalavanan et al. Nat Commun. .

Abstract

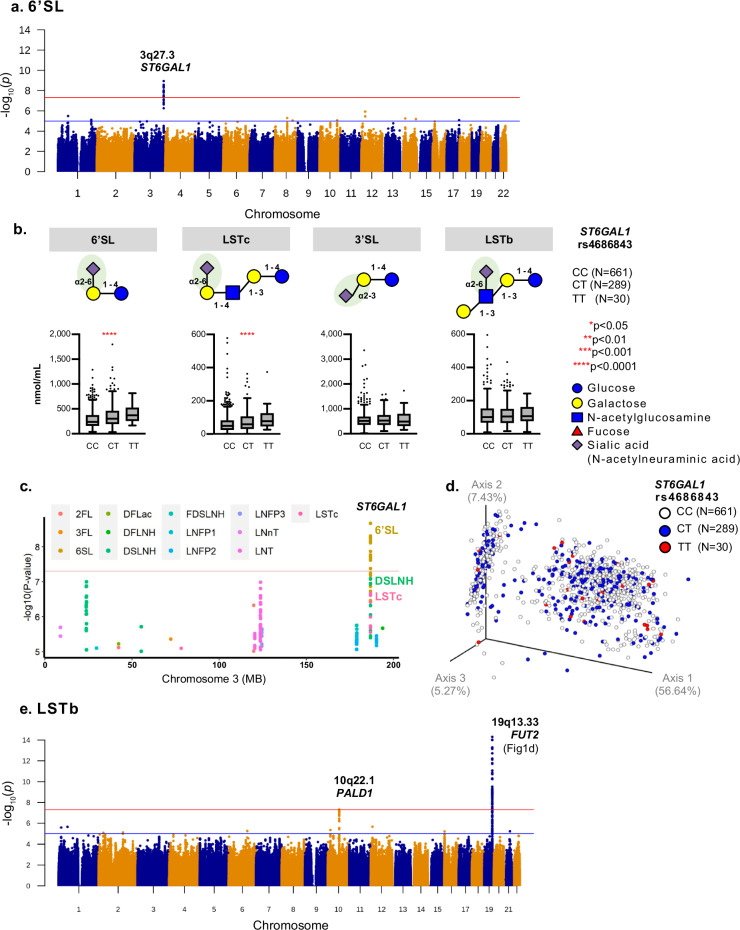
Breastfeeding provides many health benefits, but its impact on respiratory health remains unclear. This study addresses the complex and dynamic nature of the mother-milk-infant triad by investigating maternal genomic factors regulating human milk oligosaccharides (HMOs), and their associations with respiratory health among human milk-fed infants. Nineteen HMOs are quantified from 980 mothers of the CHILD Cohort Study. Genome-wide association studies identify HMO-associated loci on chromosome 19p13.3 and 19q13.33 (lowest P = 2.4e-118), spanning several fucosyltransferase (FUT) genes. We identify novel associations on chromosome 3q27.3 for 6'-sialyllactose (P = 2.2e-9) in the sialyltransferase (ST6GAL1) gene. These, plus additional associations on chromosomes 7q21.32, 7q31.32 and 13q33.3, are replicated in the independent INSPIRE Cohort. Moreover, gene-environment interaction analyses suggest that fucosylated HMOs may modulate overall risk of recurrent wheeze among preschoolers with variable genetic risk scores (P < 0.01). Thus, we report novel genetic factors associated with HMOs, some of which may protect the respiratory health of children.


Conflict of interest statement

J.C. is currently an employee of F. Hoffman-La Roche Ltd., however, the published work was done prior to this employment and does not involve/promote any of Roche’s materials or point of view. M.B.A. has consulted for DSM Nutritional Products (a food ingredient company) and serves on the Scientific Advisory Board for TinyHealth (a microbiome testing company). She has received research funding (unrelated to this project) and speaking honoraria from Prolacta Biosciences (a huma milk fortifier company). L.B. is a co-inventor on patent applications related to the use of HMOs in preventing NEC and other inflammatory diseases. The remaining authors declare no competing interests.

Figures

Fig. 1
Fig. 1. GWASs of HMOs in 980 mothers of the CHILD cohort study.
a Overlayed Manhattan plots from GWASs of 19 HMOs (linear regression analyses in PLINK): significant association of SNPs across four chromosomal regions, the strongest association at rs492602 on chromosome 19q13.33 for LNFPI (P = 2.38e–118). Additional associations were detected on chromosomes 19p13.3, 3q27.3 and 10q22.1 (Supplementary Data 1). The x-axis indicates the chromosomal position, and the y-axis indicates the significance of SNP associations (-log10(P)). The red line represents the genome-wide significance P-value threshold (P < 5e–8). The orange highlight SNPs within each of the significant regions. b Overlayed regional plots of SNP associations on chromosome 19: significant associations were detected for 18 of the 19 individual HMOs (all except 6’SL). The red horizontal line represents the genome-wide significance threshold (P < 5e–8). c Overlayed Locus Zoom plots of chromosome 19q13.33: 324 SNPs were associated with individual HMOs. The most significant SNP (rs492602, P = 2.38e–118) is indicated by a dark purple dot, which is in LD (r2 = 0.99) with the known stop-gain variant rs601338 in the FUT2 gene. The x-axis shows genes mapped to this associated genomic region (250 kb) and y-axis indicates the significance of SNP associations (-log10(P)). d Metabolic flux from LNT and LNnT to fucosylated or sialylated pentasaccharides and corresponding HMO concentrations associated with rs601338 in the FUT2 gene. The illustrated metabolic pathway shows that this SNP is associated with almost all HMOs, not just the ones that are alpha1-2-fucosylated (e.g. 2’FL or LNFP1). The green oval highlights the alpha1-2-linked fucose. Boxplots show select HMO concentrations associated with rs601338, supporting the illustrated synthesis pathways (N = 980). Box minimum: Q1, box maximum: Q3, box center: median, whiskers (farthest points that are not outliers (i.e., within 3/2 times of interquartile range). e Principal Co-ordinate Analysis (PCoA) plot of overall HMO profiles by SNP rs601338 genotypes using a Bray-Curtis distance matrix. Subjects by genotype: GG, N = 386; GA, N = 405; AA, N = 190. Each dot represents the entire HMO profile of an individual mother. Variations along the primary axis, accounting for 56.6% of overall HMO concentrations, were strongly associated with the stop-gain variant rs601338 in the FUT2 gene.
Fig. 2
Fig. 2. SNPs on chromosome 19p13.3 were associated with HMOs among 980 lactating mothers of the CHILD Cohort Study.
a Overlayed Locus Zoom plots of chromosome 19p13.3: 70 SNPs were associated with individual HMOs (linear regression analysis in PLINK; 26 independent signals and 5 lead SNPs, defined by (LD) r2 < 0.6 and r2 < 0.1, respectively). The most significant SNP (rs708686, P = 1.46e–58), located in the FUT6 gene, is represented by a dark purple dot. The x-axis identifies the genes mapped to this associated region and the y-axis indicates the significance of SNP associations (P < 5e–8). be HMO concentrations associated with rs28362459 in the FUT3 gene using Kruskal-Wallis (non-parametric) tests. Box minimum: Q1, box maximum: Q3, box center: median, whiskers (farthest points that are not outliers (i.e., within 3/2 times of interquartile range). b total HMO concentrations, P = 0.006; HMO-bound fucose, P = 0.12; and HMO-bound sialic acid, P = 5.55e–6; (c) differently sialylated lactose HMOs: 3’SL, P = 2.2e–11; 6’SL, P = 0.68; (d) differently fucosylated lactose HMOs: 2’FL, P = 9.83e–6; 3FL, P = 0.078; DFLac, P = 4.21e–4; and (e) different fucosylated pentasaccharides: LNFP1, P = 1e–12; LNFP2, P = 1e–12; LNFP3: P = 0.6468. Box minimum: Q1, box maximum: Q3, box center: median, whiskers (farthest points that are not outliers (i.e., within 3/2 times of interquartile range). f Principal Co-ordinate Analysis (PCoA) plot of overall HMO profiles by the FUT3 rs28362459 genotype using a Bray-Curtis distance matrix. Each dot represents the entire HMO profile of an individual mother. Variation along the secondary axis, which explains 7.43% of variation in overall HMO profiles, is partly driven by FUT3 rs28362459 genotype. Variation along the primary axis is driven by FUT2 secretor status (see Fig. 1e), dividing mothers into 4 groups based on FUT2 Secretor (Se) and FUT3 Lewis (Le) genotypes. Dashed lines are drawn arbitrarily to show the sectors with high or low numbers of Secretor (Se) and Lewis (Le) genotypes.
Fig. 3
Fig. 3. Novel HMO-associated loci in ST6GAL1 and PALD1 genes among lactating mothers of the CHILD Cohort Study.
a Manhattan plot of GWAS for 6’SL: 19 SNPs on chromosome 3q27.3 in the ST6GAL1 gene were significantly associated with 6’SL (P < 5e–8). The most significant lead SNP was rs4686843 located in the intron of this gene. The x-axis indicates the chromosomal position and the y-axis indicates the significance of SNP associations (-log10(P)). b HMO concentrations associated with rs4686843 using the Kruskal-Wallis test (non-parametric, not assuming normal distribution): SNP associated with higher concentrations of 6’SL (P = 5.78e–9) and LSTc (P = 6.29e–6), but not 3’SL (P = 0.98) or LSTb (P = 0.98), indicating role in alpha2-6-sialylation specific at the terminal galactose. Box minimum: Q1, box maximum: Q3, box center: median, whiskers (farthest points that are not outliers (i.e., within 3/2 times of interquartile range). c Regional plot of genetic associations for 19 individual HMOs within chromosome 3q27.3: Significant associations detected only for 6’SL. Trends detected for DSLNH and LSTc but these do not meet genome-wide significance as indicated by the red horizontal line (P = 5e–8). Blue line is indicated by the suggestive significance (P = 1e–5). d Principal Co-ordinate Analysis (PCoA) plot of overall HMO profiles by rs4686843 using a Bray-Curtis distance matrix: No evidence of substantial association between this SNP and overall HMO profile. Each dot represents the entire HMO profile of an individual mother. e Manhattan plot of LSTb: 135 SNPs on chromosome 19q13.33 (habouring genes such as FUT2, lowest P = 2.4e–31) and a single SNP on chromosome 10q22.1 in the PALD1 locus (P < 5e–8) as indicated by the red line and were significantly associated with LSTb concentration. Blue line indicates the suggestive significance (P = 1e–5).
Fig. 4
Fig. 4. Genome-wide conditional analyses of HMOs.
a Overlayed Manhattan plots from conditional GWAS analyses of 19 HMOs using linear regression to condition on 21 lead SNPs from Table 1 (N = 980). Loci highlighted in blue were novel associated loci identified by conditioning on 21 lead SNPs from chromosome 19. Loci highlighted in green are primary loci previously identified from our GWAS. Red line represents the genome-wide significance (P = 5e–8). b Overlayed Manhattan plots from conditional GWAS analyses on the lead SNP (rs492602, P = 2.38e–118) with the lowest P value at the chromosome 19q13.33 locus, which identified 3 new significant loci on chromosomes 8q24.13, 17p13.1 and 22q12.3 (highlighted in blue). Loci highlighted in green are primary loci previously identified from our GWAS. Red line represents the genome-wide significance threshold (P = 5e–8). Zoomed panel shows the loci within significance between P < 1e–05 and P < 5e–10. c Overlayed Manhattan plots from conditional GWAS analyses on the lead SNP (rs708686, P = 1.24e–58) with the lowest P value at the chromosome on 19p13.3 locus, which identified 4 new significant loci on chromosome 3p24.3, 17p13.1, 18q22.3 and 22q12.3 (highlighted in blue). Loci highlighted in green are primary loci previously identified from our GWAS. Red line represents the genome-wide significance (P = 5e–8). Zoomed panel shows the loci within significance between P < 1e–05 and P < 5e–10.
Fig. 5
Fig. 5. Replication analyses of HMO-associated loci in the INSPIRE Study.
ac Overlayed regional plots show replication of HMO-associated loci in the INSPIRE sub-cohort (N = 395): significant replications after Bonferroni correction for multiple testing surpass the red horizontal line. a SNP rs4234598 in locus 3q27.3 was associated with both 6’SL and LSTc. b Four SNPs in 7q31.32 were associated with LNT and one SNP (rs16869462) in 7q21.32 is associated with LNH. c A total of 41 SNPs in 19p13.2 and 19q13.33 loci were associated with all HMOs except 6’SL and LNnT in the INSPIRE sub-cohort. d Overlayed Manhattan plot of the meta-analyses of 19 HMOs combining the CHILD and INSPIRE sub-cohorts (N = 1375). Loci in red exceeded the genome-wide significance threshold (meta-P < 5e–08) and loci in green were suggestively associated (meta-P < 1e–05). Out of the 6 associated genomics regions, two were novel (7q21.32 and 13q33.3), not previously identified in either the CHILD or INSPIRE sub-cohorts alone.
Fig. 6
Fig. 6. Gene-environment interaction analyses: Exposure to certain fucosylated HMOs interacts with individual genetic risk to modulate risk of recurrent wheeze during childhood in the CHILD cohort.
a Association of all-asthma GRS and childhood-asthma GRS with recurrent wheeze between ages 2 and 5 years (N = 2835; P = 2.48e–10 and P = 1e–7, respectively). The x-axes indicate GRS Z-scores and the y-axes indicate the prevalence of recurrent wheeze. bd Gene-environment interaction (GxE) analyses using logistic regression analyses indicate that exposure to specific HMOs modulate risk of recurrent wheeze among human milk-fed children in the sub-cohort (N = 880 children of all mothers with HMOs and genomics data) as well as in the sub-cohort of 640 secretor mothers. Unadjusted *P < 0.05; Bonferroni adjusted **P < 0.05; FDR adjusted **~P < 0.05. Normalized HMO concentrations were categorized as Low (<–1 SD), Moderate (–1 to +1 SD) and High (>+1 SD) represented as bands and colors. Exposure to low levels of three HMOs (e.g., 2’FL, LNFP1, DFLNH) is associated with increased prevalence of recurrent wheeze among children with high GRS (P < 0.05). GxE unadjusted P values using generalized linear model: 2’FL; P = 0.004, LNFP1; P = 0.01, DFLNH; P = 0.002). In contrast, exposure to high levels of other HMOs (e.g., LNFP2, LNFP3) is associated with increased prevalence of recurrent wheeze among children with high GRS (GxE Unadjusted p values: LNFP2; P = 0.03, LNFP3; P = 0.02). Full summary statistics are provided in Supplementary Tables 4, 5.

References

    1. Victora, C. G. et al. Breastfeeding in the 21st century: epidemiology, mechanisms, and lifelong effect. Lancet387, 475–490 (2016). 10.1016/S0140-6736(15)01024-7 - DOI - PubMed
    1. Miliku, K. & Azad, M. B. Breastfeeding and the developmental origins of asthma: Current evidence, possible mechanisms, and future research priorities. Nutrients10, 995 (2018). - PMC - PubMed
    1. Lodge, C. J. et al. Breastfeeding and asthma and allergies: a systematic review and meta-analysis. Acta Paediatr.104, 38–53 (2015). 10.1111/apa.13132 - DOI - PubMed
    1. Bode, L., Raman, A. S., Murch, S. H., Rollins, N. C. & Gordon, J. I. Understanding the mother-breastmilk-infant “triad”. Science367, 1070–1072 (2020). 10.1126/science.aaw6147 - DOI - PubMed
    1. Witkowska-Zimny, M. & Kaminska-El-Hassan, E. Cells of human breast milk. Cell Mol. Biol. Lett.22, 11 (2017). 10.1186/s11658-017-0042-4 - DOI - PMC - PubMed

Publication types

MeSH terms

LinkOut - more resources