. 2024 Sep 4;11(1):967.
doi: 10.1038/s41597-024-03778-z.

Digital Microbe: a genome-informed data integration framework for team science on emerging model organisms

Affiliations

Digital Microbe: a genome-informed data integration framework for team science on emerging model organisms

Iva Veseli et al. Sci Data. .

Abstract

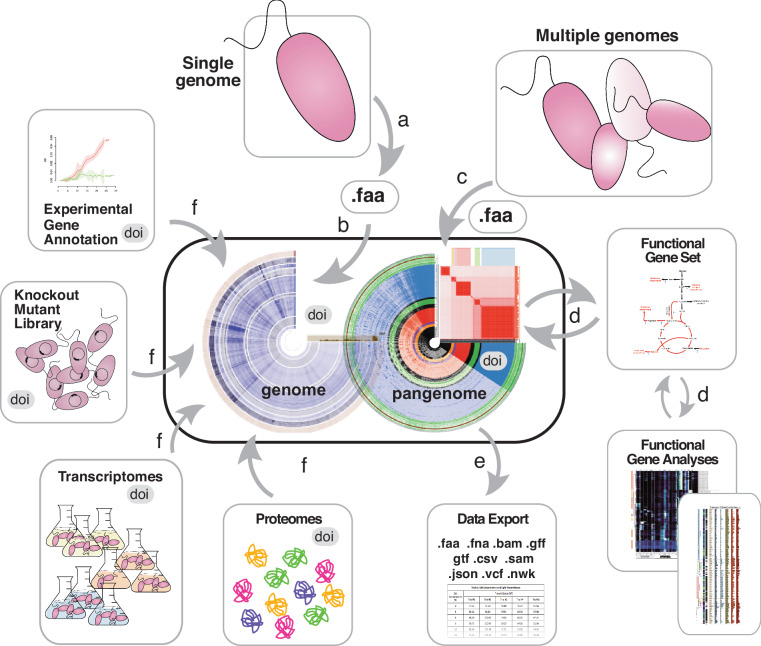
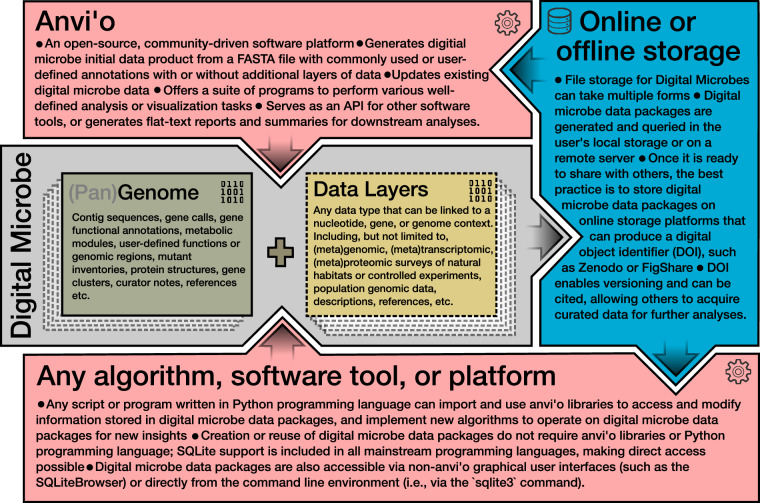
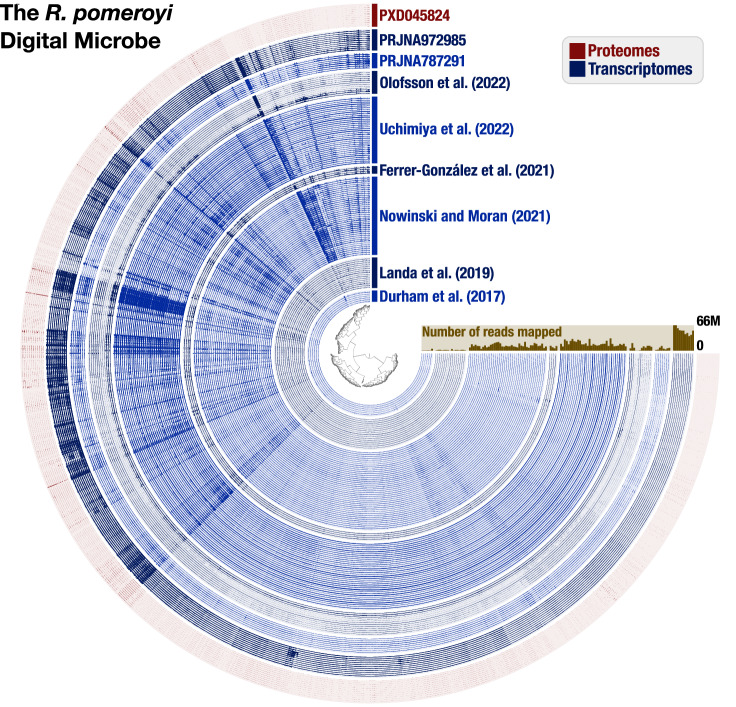
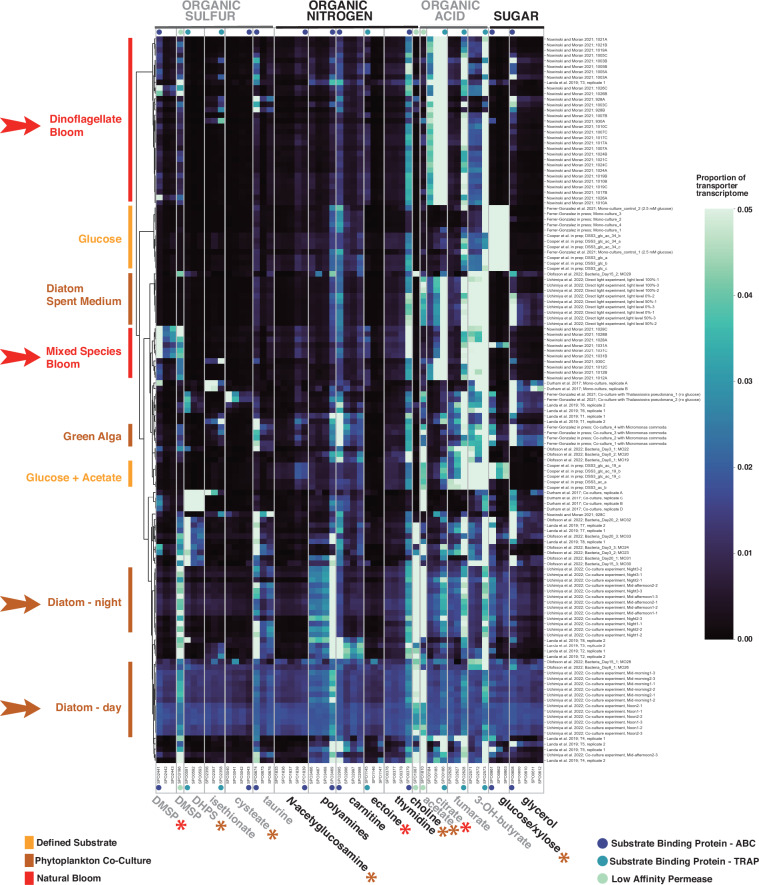
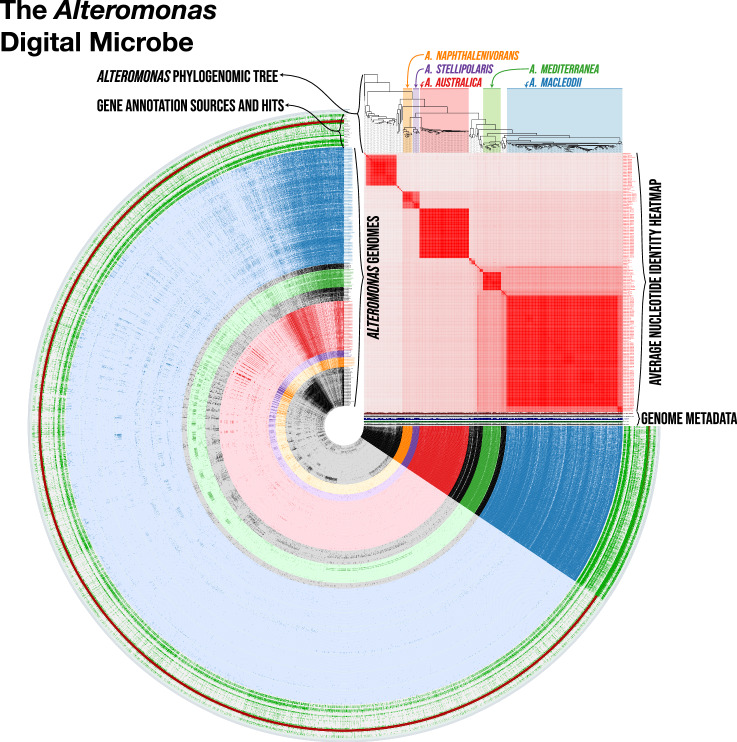
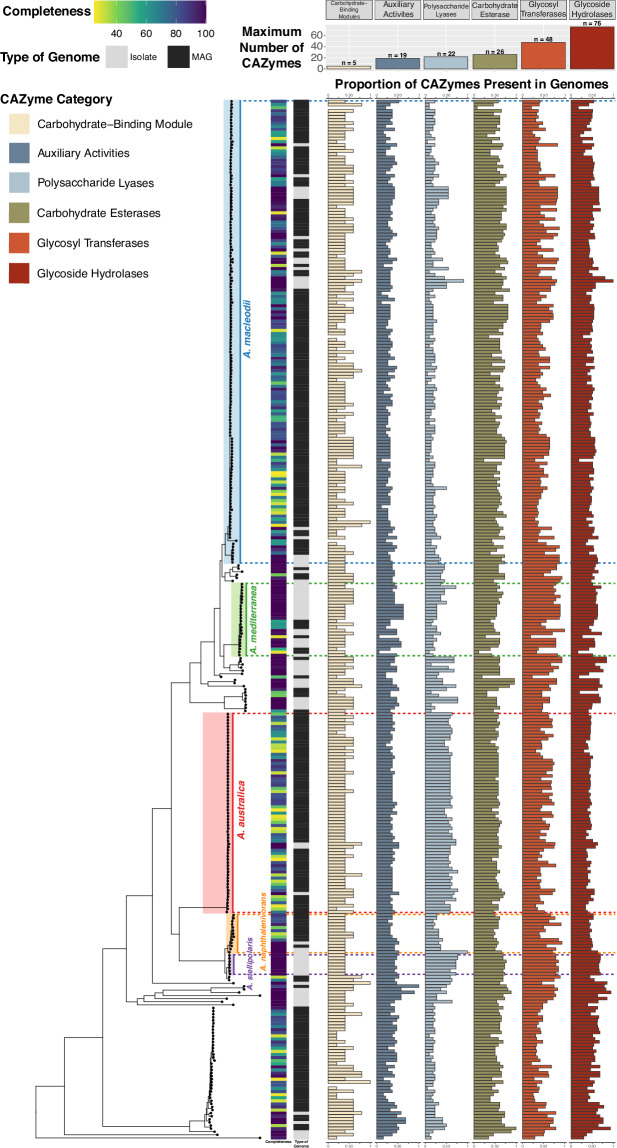
The remarkable pace of genomic data generation is rapidly transforming our understanding of life at the micron scale. Yet this data stream also creates challenges for team science. A single microbe can have multiple versions of genome architecture, functional gene annotations, and gene identifiers; additionally, the lack of mechanisms for collating and preserving advances in this knowledge raises barriers to community coalescence around shared datasets. "Digital Microbes" are frameworks for interoperable and reproducible collaborative science through open source, community-curated data packages built on a (pan)genomic foundation. Housed within an integrative software environment, Digital Microbes ensure real-time alignment of research efforts for collaborative teams and facilitate novel scientific insights as new layers of data are added. Here we describe two Digital Microbes: 1) the heterotrophic marine bacterium Ruegeria pomeroyi DSS-3 with > 100 transcriptomic datasets from lab and field studies, and 2) the pangenome of the cosmopolitan marine heterotroph Alteromonas containing 339 genomes. Examples demonstrate how an integrated framework collating public (pan)genome-informed data can generate novel and reproducible findings.


Conflict of interest statement

The authors declare no competing interests.

Figures

Fig. 1
Fig. 1
Architecture of a Digital Microbe. The genome of a model bacterium is (a) sequenced and (b) assembled and serves as the foundation of a Digital Microbe, a self-contained data package for a collaborative research team or a science community. (c) Alternatively, a pangenomic data package is assembled. (d) Intermediate datasets useful for downstream analyses are stored and reused, and (e) various data files and tables can be exported. (f) The Digital Microbe is iteratively populated with data layers referenced to individual genes, including mapped proteomes, transcriptomes, or gene-specific metadata types such as inventories of mutants or new annotations. Each Digital Microbe can be assigned a DOI (digital object identifier) and be versioned as new gene- or genome-referenced data are added.
Fig. 2
Fig. 2
Situating the Digital Microbe concept in the existing computational environment. The Digital Microbe approach facilitates collaborative science by: establishing a version-controlled (pan)genomic reference; consolidating and cross-referencing collections of experimental and environmental data associated with a genome or pangenome; facilitating access to reusable intermediate analyses; and providing data export capabilities for transitioning to other programs or analysis software. While each of these features could be established by generating new software, we chose to use the existing open-source software platform anvi’o, which implements several aspects of a Digital Microbe via (pan)genomic data storage in programmatically-queryable SQLite databases. The concept behind the Digital Microbe framework, however, is independent of any one software platform.
Fig. 3
Fig. 3
Contents of the R. pomeroyi Digital Microbe. As visualized in anvi’o ‘gene mode’, each item on the inner tree corresponds to one gene call in the R. pomeroyi genome, and the blue concentric circles display the coverage of each gene in a given transcriptome sample. The outermost red concentric circles correspond to normalized protein abundances from proteome samples (raw files available in the Proteomics Identifications Database (PRIDE) via Project PXD045824). Samples are grouped by their study of origin, with the data source indicated in text of the same color as the samples. The brown bar plot indicates the total number of reads that mapped from each transcriptome to the R. pomeroyi genome. This figure was generated from version 5.0 of the R. pomeroyi Digital Microbe databases on Zenodo.
Fig. 4
Fig. 4
Clustered heatmap of relative gene expression for 18 experimentally annotated R. pomeroyi transporters compiled in a Digital Microbe. Each row represents a single transcriptome from the Digital Microbe dataset, and each column represents all transporter proteins with experimentally confirmed cognate substrates. Row labels indicate study and sample name (Table S1). Brighter colors indicate higher proportional expression (the scale maximum is ≥5% of the sum of the 18 transporter transcriptomes) while darker colors indicate lower. Arrows point out transcriptomes collected when substrates were derived from dinoflagellate-rich natural communities (red) or diatom co-cultures (brown); significant differences in transporter protein expression between these two substrate sources are indicated with asterisks colored red (enriched with dinoflagellates) or brown (with diatoms) (T-test, p ≤ 0.05).
Fig. 5
Fig. 5
The Alteromonas Digital Microbe. Each concentric ring represents one Alteromonas genome, with colored rings identifying genomes from five clades of interest (A. macleodii, A. mediterranea, A. austalica, A. stellioolaris, and A. naphthalenivorans). The outermost green rings depict annotation sources applied to all genomes. Each spoke in the figure represents one gene cluster in the pangenome, with presence/absence denoted by darker/lighter colors, respectively. Genome metadata are shown next to each ring and include total genome length, GC content, completion, number of genes per kbp, and number of gene clusters per genome. The red heatmap above the metadata shows the average nucleotide identity (ANI) percentage scores between genomes. The tree above the ANI heatmap shows the imported phylogenomic tree, with clades of interest color-referenced in the circular portion of the figure. This figure was generated using the anvi’o ‘anvi-display-pan’ from a version of the Alteromonas digital microbe without singleton genes, which is available on Zenodo under 10.5281/zenodo.10421034.
Fig. 6
Fig. 6
Distribution of CAZYme annotations across a phylogeny of 336 isolate and MAG genomes from the genus Alteromonas. The phylogeny of the genus is displayed on the left side of the figure, with genomes represented by points on the tree and five of the clades (A. macleodii, A. mediterranea, A. australica, A. napthalenivorans, and A. stellipolaris) highlighted. Each row on the right side of the figure represents one genome. Completeness and type of genome are shown in the two heatmaps to the right of the phylogeny. The horizontal bar plots of different colors show the proportion of CAZymes in each genome relative to the maximum number of all categories of CAZymes as indicated in the legend in the inset at the upper left. The maximum number for each CAZyme category is represented by the vertical bar plot at the top of the figure.

References

    1. Wetmore, K. M. et al. Rapid quantification of mutant fitness in diverse bacteria by sequencing randomly bar-coded transposons. MBio6, e00306–15 (2015). 10.1128/mBio.00306-15 - DOI - PMC - PubMed
    1. Moore, L. R. & Chisholm, S. W. Photophysiology of the marine cyanobacterium Prochlorococcus: Ecotypic differences among cultured isolates. Limnol. Oceanogr.44, 628–638 (1999). 10.4319/lo.1999.44.3.0628 - DOI
    1. Sun, J. et al. One carbon metabolism in SAR11 pelagic marine bacteria. PLoS One6, e23973 (2011). 10.1371/journal.pone.0023973 - DOI - PMC - PubMed
    1. González, J. M. et al. Genome analysis of the proteorhodopsin-containing marine bacterium Polaribacter sp. MED152 (Flavobacteria). Proc. Natl. Acad. Sci. USA105, 8724–8729 (2008). 10.1073/pnas.0712027105 - DOI - PMC - PubMed
    1. Leonelli, S. Model Organism. in Encyclopedia of Systems Biology (eds. Dubitzky, W., Wolkenhauer, O., Cho, K.-H. & Yokota, H.) 1398–1401 (Springer New York, 2013).

LinkOut - more resources