. 2024 Sep 5;15(1):7746.
doi: 10.1038/s41467-024-52218-4.

Sortilin-mediated translocation of mitochondrial ACSL1 impairs adipocyte thermogenesis and energy expenditure in male mice

Affiliations

Sortilin-mediated translocation of mitochondrial ACSL1 impairs adipocyte thermogenesis and energy expenditure in male mice

Min Yang et al. Nat Commun. .

Abstract

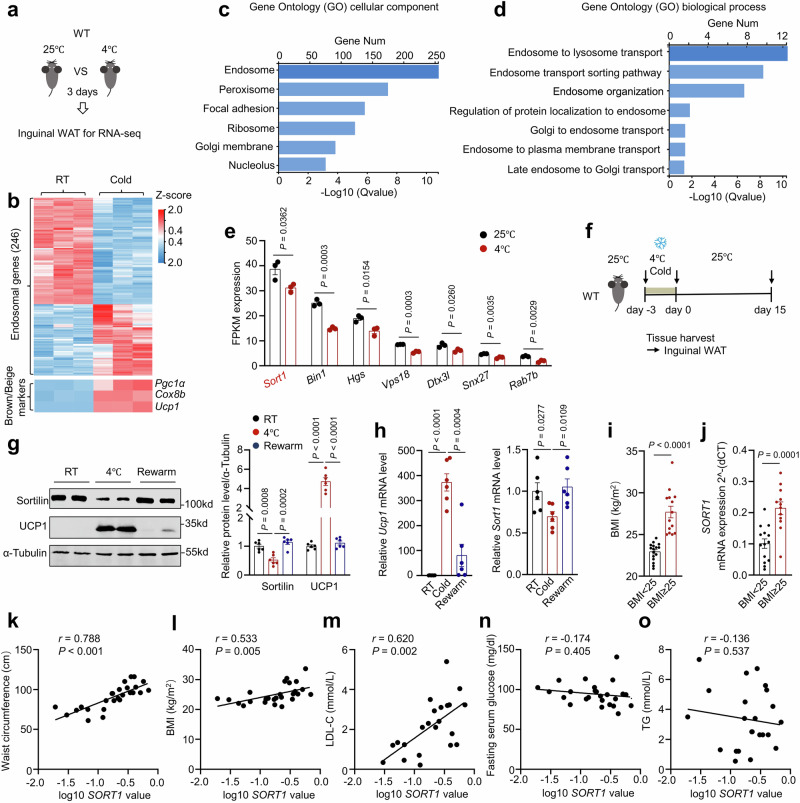
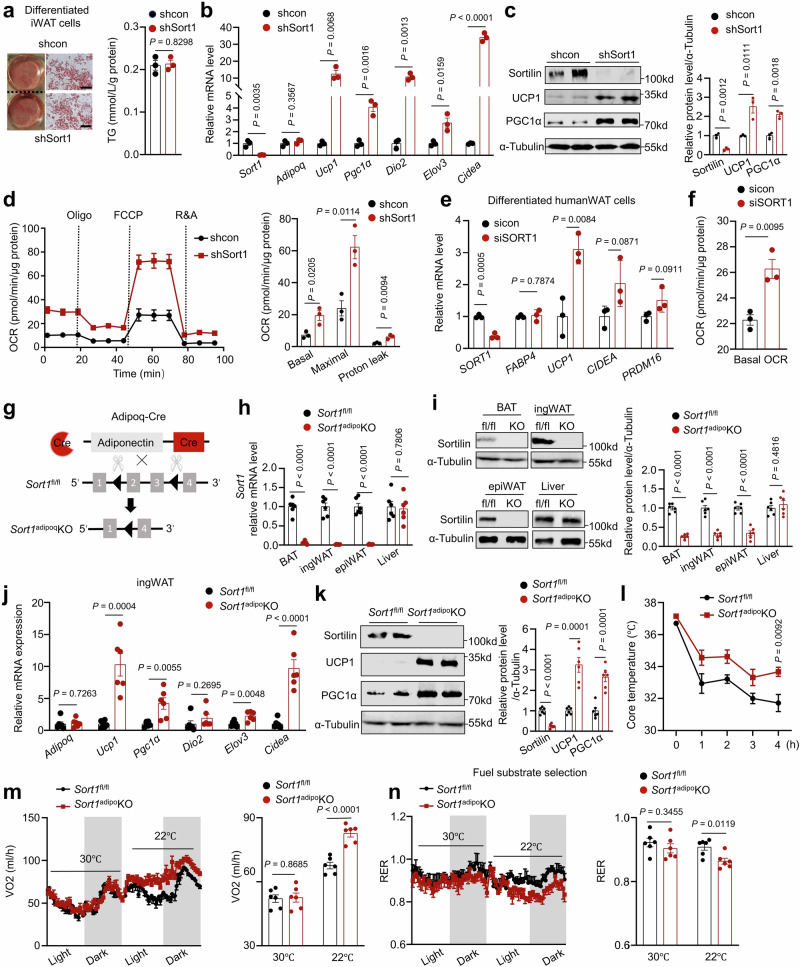
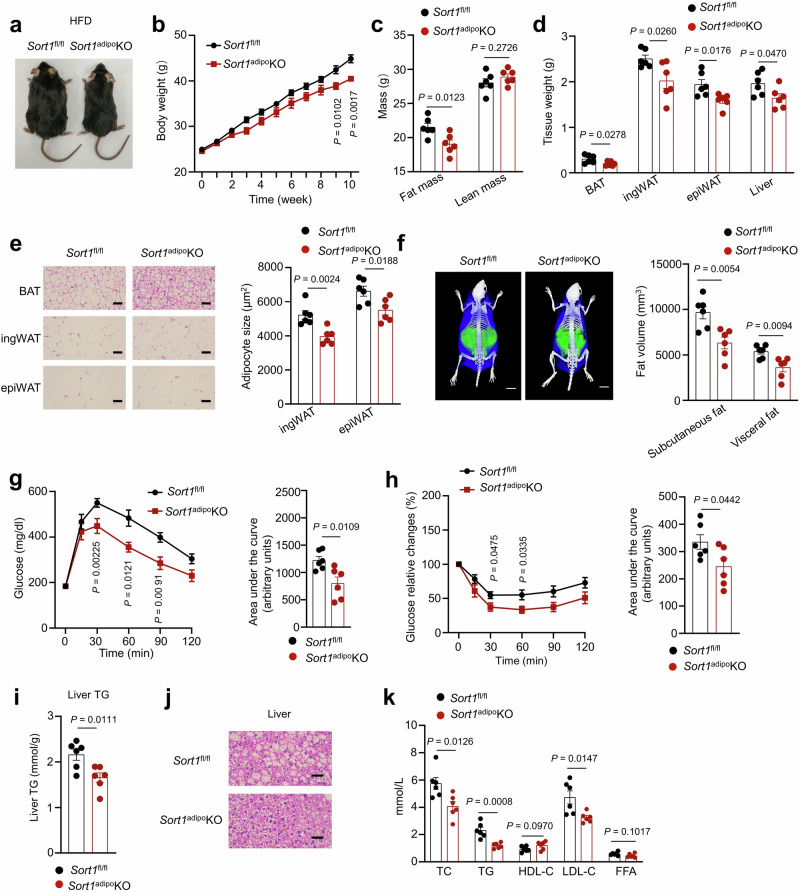
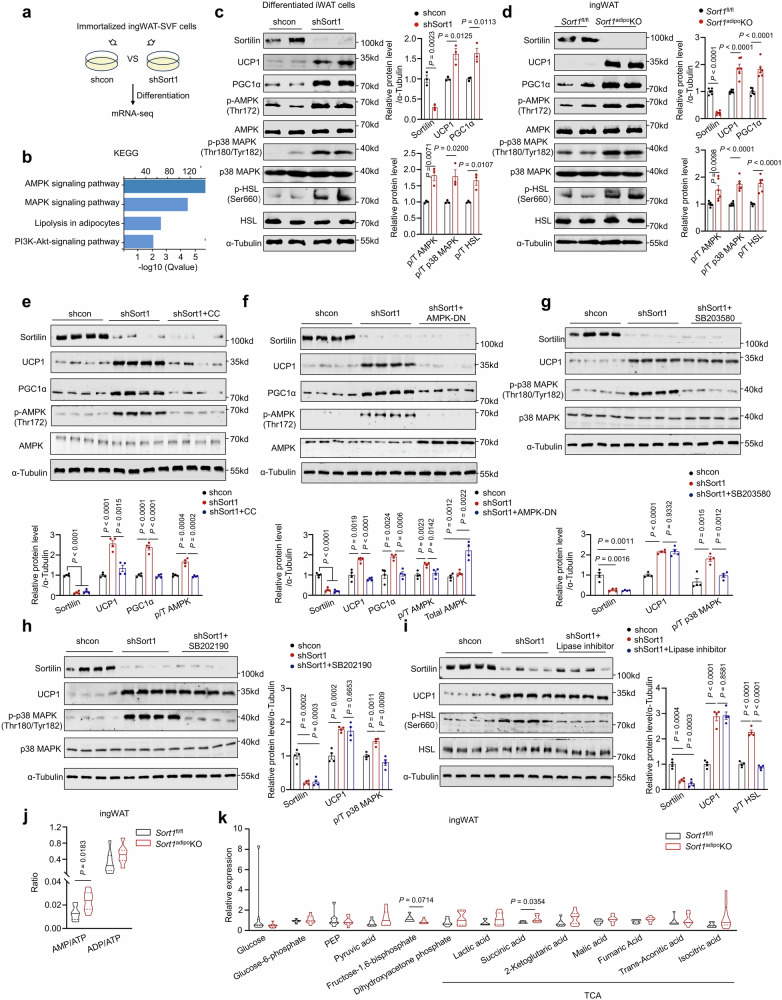
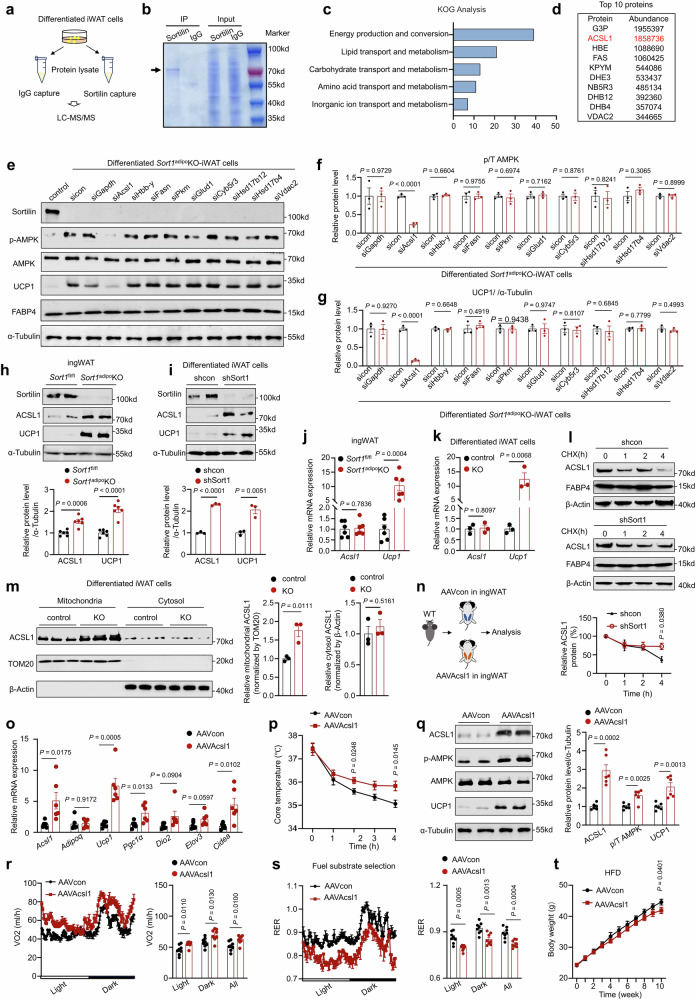
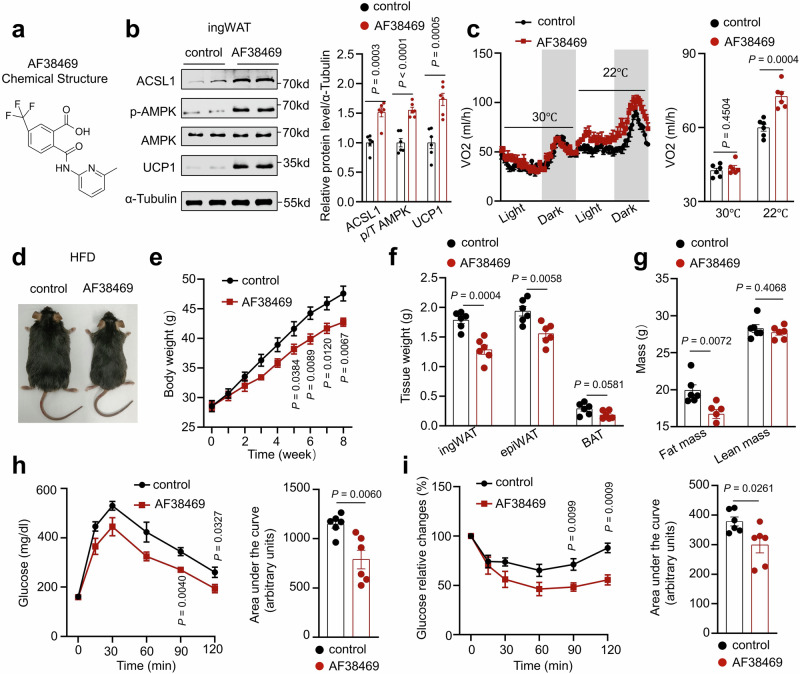
Beige fat activation involves a fuel switch to fatty acid oxidation following chronic cold adaptation. Mitochondrial acyl-CoA synthetase long-chain family member 1 (ACSL1) localizes in the mitochondria and plays a key role in fatty acid oxidation; however, the regulatory mechanism of the subcellular localization remains poorly understood. Here, we identify an endosomal trafficking component sortilin (encoded by Sort1) in adipose tissues that shows dynamic expression during beige fat activation and facilitates the translocation of ACSL1 from the mitochondria to the endolysosomal pathway for degradation. Depletion of sortilin in adipocytes results in an increase of mitochondrial ACSL1 and the activation of AMPK/PGC1α signaling, thereby activating beige fat and preventing high-fat diet (HFD)-induced obesity and insulin resistance. Collectively, our findings indicate that sortilin controls adipose tissue fatty acid oxidation by substrate fuel selection during beige fat activation and provides a potential targeted approach for the treatment of metabolic diseases.


Conflict of interest statement

The authors declare no competing interests.

Figures

Fig. 1
Fig. 1. Dynamic regulation of sortilin expression during white fat browning and its association with human metabolic status.
a Workflow of cold challenge for WT mice. b Heatmap of the RNA-seq transcriptome in ingWAT from RT or cold (4 °C) mice (n = 3 per group). All of the listed genes were significantly different (false-discovery rate (FDR) < 0.05). c GO (Gene ontology) cellular component analysis in ingWAT from RT and cold mice. d GO biological process analysis in ingWAT from RT and cold mice. e The FPKM expression of endosomal genes involved in Endosome to lysosome transport in ingWAT from RT and cold mice (n = 3 per group). f Workflow of cold challenge and rewarm for WT mice. g Left: Immunoblot analysis of sortilin and UCP1 in ingWAT of WT mice after cold challenge and rewarm. The right panel showed the quantification normalized to α-Tubulin. n  =  6 per group. h The mRNA analysis of sortilin and UCP1 in ingWAT of WT mice after cold challenge and rewarm. n = 6 per group. i BMI of human subjects. n = 16 (BMI < 25 kg/m2), n = 14 (BMI ≥ 25 kg/m2). j Detection of the mRNA expression of sortilin in human omental adipose tissues. n = 14 (BMI < 25 kg/m2), n = 12 (BMI ≥ 25 kg/m2). ko Analysis of the correlation between sortilin expression in human omental adipose tissues and waist circumference (k), BMI (l), LDL-C (m), blood glucose (n), and TG (o). n = 26 for waist circumference analysis, n = 26 for BMI analysis, n = 22 for LDL analysis, n = 25 for blood glucose analysis, and n = 23 for TG analysis respectively. Statistical significance was assessed by two-tailed Student’s t test. Values were presented as Pearson’s r correlation coefficient (ko). Data were presented as mean ± SEMs. Source data and uncropped blots are available as a Source Data file.
Fig. 2
Fig. 2. Fat-specific loss of sortilin promotes white fat browning.
In vitro experiment, iWAT cells transfected with shRNA targeting Sort1 or scrambled control. Cells were induced to adipogenic differentiation for 8 days, namely shSort1 and shcon adipocytes, respectively. a Left: Oil Red O staining of shSort1 and shcon adipocytes. Scale bar: 100 μm. Right panel showed the TG concentration normalized to protein at 8 days of adipogenic differentiation. n = 3 per group. b, c The expression of thermogenic genes (b) and Immunoblot analysis of UCP1 and PGC1α (c) in differentiated shcon and shSort1 iWAT cells. Quantification is shown right in (c). n  =  3 per group. d Left: OCRs in differentiated shcon and shSort1 iWAT cells. Calculation was shown right. n  =  3 per group. e The expression of thermogenic genes was evaluated in differentiated subcutaneous fat-derived SVF cells from human (humanWAT cells). Cells were transfected with siRNA targeting SORT1 (siSORT1) or scrambled control (sicon) for 48 h. n = 3 per group. f Basal OCR in differentiated sicon and siSORT1 HumanWAT cells. n = 3 per group. g Overview of Sort1adipoKO mice model. h The mRNA expression analysis of sortilin in fat and liver from Sort1fl/fl and Sort1adipoKO mice. n = 6 per group. i Left: immunoblot analysis of sortilin in ingWAT, epiWAT, BAT and liver in Sort1fl/fl and Sort1adipoKO mice. Quantification was shown right. n  =  6 per group. j The expression of thermogenic genes in ingWAT of Sort1fl/fl and Sort1adipoKO mice. n = 6 per group. (k) Immunoblot analysis of UCP1 and PGC1α in ingWAT of Sort1fl/fl and Sort1adipoKO mice. Quantification was shown right. n  =  6 per group. l The rectal temperature of Sort1fl/fl and Sort1adipoKO mice fed chow diet in response to a cold challenge (4 °C) from thermoneutrality (30 °C) for at least 7 days. n = 6 per group. m, n Whole-body oxygen consumption (VO2) (m) and respiratory exchange ratio (RER) (n) of Sort1fl/fl and Sort1adipoKO mice fed chow diet at thermoneutrality (30 °C) or room temperature (22 °C). The right panel showed the quantification. n = 6 per group. Statistical significance was assessed by two-tailed Student’s t test. Data were presented as mean ± SEMs. Source data and uncropped blots are available as a Source Data file.
Fig. 3
Fig. 3. Fat-specific loss of sortilin restrains the development of HFD-induced obesity.
a Representative photo of Sort1fl/fl and Sort1adipoKO mice at 12 weeks of HFD. b Body weight of Sort1fl/fl and Sort1adipoKO mice fed HFD. n = 6 per group. c Body composition (fat/lean mass) of Sort1fl/fl and Sort1adipoKO mice at 12 weeks of HFD. n = 6 per group. (d) Weights of fat tissues and liver in Sort1fl/fl and Sort1adipoKO mice at 12 weeks of HFD. n = 6 per group. e Representative H&E staining images and calculated adipocyte size of dissected tissues in Sort1adipoKO and Sort1fl/fl mice at 12 weeks of HFD. Scale bar: 50 µm. The right panel showed the quantification. One point indicated the value of one mouse’s mean adipocyte size quantification. n = 6 per group. f Representative micro-CT images (left) and quantification of adipose tissue volumes (right) of Sort1adipoKO and Sort1fl/fl mice at 12 weeks of HFD. Scale bar: 10 mm. n = 6 per group. g, h Intraperitoneal glucose tolerance test (GTT) (g) and insulin tolerance test (ITT) (h) in Sort1adipoKO and Sort1fl/fl mice at 12 weeks of HFD. n = 6 per group. i Triglyceride content in liver tissues of Sort1fl/fl and Sort1adipoKO mice at 12 weeks of HFD. n = 6 per group. j Representative HE-staining images of liver from Sort1fl/fl and Sort1adipoKO mice at 12 weeks of HFD. Scale bar: 50 µm. n = 6 per group. k Serum lipid profile of Sort1fl/fl and Sort1adipoKO mice at 12 weeks of HFD. n = 6 per group. Statistical significance was assessed by two-tailed Student’s t test. Data were presented as mean ± SEMs. Source data are available as a Source Data file.
Fig. 4
Fig. 4. Sortilin depletion-mediated white fat browning depends upon activation of AMPK signaling.
a Workflow of shcon and shSort1 adipocytes for mRNA-seq. n = 3 per group. b Kyoto Encyclopedia of Genes and Genomes (KEGG) analysis of global activated pathway in shSort1 adipocytes. c Immunoblots (proteins indicated) in shcon and shSort1 adipocytes. The right panel showed the quantification normalized to α-Tubulin, AMPK, p38 MAPK or HSL. n = 3 per group. p/T AMPK: phosphorylated AMPK/Total AMPK; p/T p38 MAPK: phosphorylated p38 MAPK/Total p38 MAPK; p/T HSL: phosphorylated HSL/Total HSL. d Immunoblots (proteins indicated) in ingWAT of Sort1fl/fl and Sort1adipoKO mice. The right panel showed the quantification normalized to α-Tubulin, AMPK, p-38 MAPK or HSL. n  =  6 per group. e Immunoblots (proteins indicated) in shcon and shSort1 adipocytes incubated with or without AMPK inhibitor CC (10 μM) for 2 h. The lower panel showed the quantification normalized to α-Tubulin or AMPK. n  =  4 per group. f Immunoblots (proteins indicated) of shcon and shSort1 adipocytes that were reverse-transfected with plasmid expressing AMPK-DN or control mock for 24 h. The lower panel showed the quantification normalized to α-Tubulin or AMPK. n  =  4 per group. g, h Immunoblots (proteins indicated) in shcon and shSort1 adipocytes incubated with or without p-38 MAPK inhibitor SB203580 (10 μM) (g) or SB202190 (5 μM) (h) for 2 h. The lower or right panels showed the quantification normalized to α-Tubulin or p-38 MAPK. n  =  4 per group. i Immunoblots (proteins indicated) in shcon and shSort1 adipocytes incubated with or without lipase inhibitor (Atglistatin, ATGL inhibitor 10 μM and CAY10499, HSL inhibitor 20 μM) (h) for 2 h. The right panel showed the quantification normalized to α-Tubulin or HSL. n  =  4 per group. j The AMP/ATP and ADP/ATP ratio in ingWAT of 8-week-old Sort1fl/fl and Sort1adipoKO mice fed chow diet. n = 7 for Sort1fl/fl group, n = 9 for Sort1adipoKO group. k Metabolites levels of glycolysis and tricarboxylic acid cycle (TCA) in ingWAT of 8-week-old Sort1fl/fl and Sort1adipoKO mice fed chow diet. n = 7 for Sort1fl/fl group, n = 9 for Sort1adipoKO group. Statistical differences were determined by two-tailed Student’s t-test; Data were presented as mean ± SEMs. Source data and uncropped blots are available as a Source Data file.
Fig. 5
Fig. 5. Sortilin controls ACSL1 protein degradation and ACSL1 promotes white fat browning and energy metabolism.
a Workflow of IP by sortilin and IgG antibody for protein capture by LC-MS/MS in differentiated iWAT cells. b Representative photo of Bis-Tris Gel which was stained with Coomassie Blue Staining in (a). c KOG analysis of proteins pulldown by sortilin in (a). d List of the top 10 abundance candidate proteins pulldown by sortilin. e Immunoblots of p-AMPK and UCP1 protein levels in differentiated Sort1adipoKO-iWAT cells and differentiated Sort1fl/fl-iWAT cells (called as control). Differentiated Sort1adipoKO-iWAT cells were transfected with corresponding siRNAs. f, g The quantification of p/T AMPK (f) and UCP1 (g) in (e). h, i Immunoblots of UCP1 and ACSL1 in ingWAT of Sort1fl/fl or Sort1adipoKO mice (h) and shcon or shSort1 adipocytes (i). Quantifications are shown below. j mRNA expression of ACSL1 and UCP1 in ingWAT of Sort1fl/fl and Sort1adipoKO mice. k mRNA expression of ACSL1 and UCP1 in differentiated Sort1adipoKO-iWAT cells (called as KO) and differentiated Sort1fl/fl-iWAT cells (called as control). l CHX chase assay showed the degradation of ACSL1 in shcon and shSort1 adipocytes. Experiment was independently repeated 3 times and the quantification was shown at below. m ACSL1 expression in mitochondrial and cytosol fraction of differentiated control or KO cells in vitro. Quantifications were shown right. n Workflow of ingWAT-specific ACSL1 overexpression: mice were injected with AAVAcsl1 and scramble (AAVcon) in bilateral ingWATs. o Thermogenic genes were evaluated in ingWAT of AAVcon and AAVAcsl1 mice. p The rectal temperature of AAVcon and AAVAcsl1 mice in response to a cold challenge (4 °C) from RT. q Immunoblots of p/T AMPK and UCP1 in ingWAT of AAVcon and AAVAcsl1 mice. Quantification was shown right. r, s VO2 (r) and RER (s) of AAVcon and AAVAcsl1 mice fed chow diet at RT. The right panel showed the quantification. (t) Body weight of AAVcon and AAVAcsl1 mice fed HFD. n = 3 each group in (f), (g), (i), and (km). n  =  6 each group in (h, j, oq, t). n = 8 each group in (r), (s). Statistical significance was assessed by two-tailed Student’s t test. Data were presented as mean ± SEMs. Source data and uncropped blots are available as a Source Data file.
Fig. 6
Fig. 6. ACSL1 acts downstream of sortilin depletion-mediated the browning of white fat.
a Workflow of ingWAT-specific sortilin/ACSL1 double depletion models: WT and Acsl1KO mice were injected with AAVshSort1 or scramble virus (AAVshcon) in bilateral ingWATs. Mice were divided into four groups. b The rectal temperature of mice fed chow diet in response to a cold challenge (4 °C) from RT. n = 6 per group. c The expressions of thermogenic genes (Ucp1 and Pgc1α) were evaluated in ingWAT of mice kept at 30 °C or RT (22 °C). n = 6 per group. d Immunoblots analysis of ACSL1, UCP1 and p-AMPK were evaluated in ingWAT of mice kept at 30 °C or RT (22 °C). n = 6 per group. The right panel showed the quantification normalized to α-Tubulin or AMPK. e Whole-body VO2 of mice kept at RT (22 °C) or 30 °C with CL-316,243 stimulation (1 mg/kg). The arrow indicated the time of drug administration. n = 6 per group. f Workflow of ingWAT-specific sortilin/ACSL1 double depletion models: Sort1fl/fl and Sort1adipoKO mice were injected with AAVshAcsl1 or scramble virus (AAVshcon) through tail vein. g The rectal temperature of mice fed chow diet in response to a cold challenge (4 °C) from RT. n = 6 per group. h The expressions of thermogenic genes (Ucp1 and Pgc1α) were evaluated in ingWAT of mice kept at 30 °C or RT (22 °C). n = 6 per group. i Immunoblots analysis of ACSL1, UCP1, and p-AMPK were evaluated in ingWAT of mice kept at 30 °C or RT (22 °C). The lower panel showed the quantification normalized to α-Tubulin or AMPK. n = 6 per group. j Whole-body VO2 of mice fed chow diet were kept at RT (22 °C) or 30 °C with CL-316, 243 stimulation (1 mg/kg). The arrow indicated the time of drug administration. n = 6 per group. Statistical significance was assessed by two-tailed Student’s t test. Data were presented as mean ± SEMs. Source data and uncropped blots are available as a Source Data file.
Fig. 7
Fig. 7. Sortilin depletion promotes white fat browning conferred by inhibitor AF38469.
a Chemical structure formula of sortilin inhibitor AF38469. b Immunoblots of ACSL1, p-AMPK, and UCP1 in ingWAT of AF38469 or vehicle treated mice. The right panel showed the quantification normalized to α-Tubulin or AMPK. n = 6 per group. c Whole-body VO2 of vehicle or AF38469 treated mice kept at 30 °C or RT (22 °C). Right panel showed the quantification. n = 6 per group. d Representative photo of vehicle or AF38469-treated mice at 12 weeks of HFD. e Body weight of vehicle or AF38469-treated mice fed HFD. n = 6 per group. f Fat tissue weights of vehicle or AF38469-treated mice at 12 weeks of HFD. n = 6 per group. g Body composition (fat/lean mass) of vehicle or AF38469-treated mice at 12 weeks of HFD. n = 6 per group. h, i GTT and ITT of vehicle or AF38469-treated mice at 12 weeks of HFD. n = 6 per group. Statistical significance was assessed by two-tailed Student’s t test). Data were presented as mean ± SEMs. Source data and uncropped blots are available as a Source Data file.

References

    1. Cohen, P. & Kajimura, S. The cellular and functional complexity of thermogenic fat. Nat. Rev. Mol. Cell Biol.22, 393–409 (2021). 10.1038/s41580-021-00350-0 - DOI - PMC - PubMed
    1. Betz, M. J. & Enerbäck, S. J. D. Human brown adipose tissue: what we have learned so far. Diabetes64, 2352–2360 (2015). 10.2337/db15-0146 - DOI - PubMed
    1. Kajimura, S., Spiegelman, BruceM. & Seale, P. Brown and Beige Fat: Physiological Roles beyond Heat Generation. Cell Metab.22, 546–559 (2015). 10.1016/j.cmet.2015.09.007 - DOI - PMC - PubMed
    1. Sponton, C. H., de Lima-Junior, J. C. & Leiria, L. O. What puts the heat on thermogenic fat: metabolism of fuel substrates. Trends Endocrinol. Metab.33, 587–599 (2022). 10.1016/j.tem.2022.05.003 - DOI - PubMed
    1. Chouchani, E. T. & Kajimura, S. Metabolic adaptation and maladaptation in adipose tissue. Nat. Metab.1, 189–200 (2019). 10.1038/s42255-018-0021-8 - DOI - PMC - PubMed

Publication types

MeSH terms

Substances

Associated data

LinkOut - more resources