

Comparison of cooking emissions mitigation between automated and manually operated air quality interventions in one-bedroom apartments
- PMID: 39232024
- PMCID: PMC11374985
- DOI: 10.1038/s41598-024-69731-7
Comparison of cooking emissions mitigation between automated and manually operated air quality interventions in one-bedroom apartments
Abstract
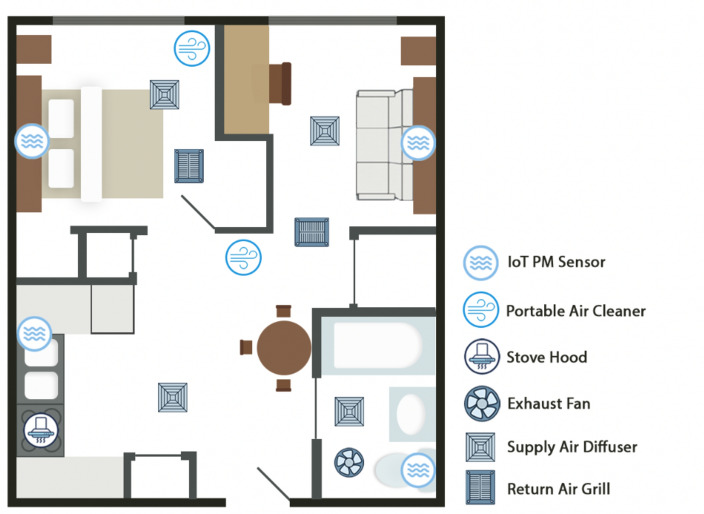
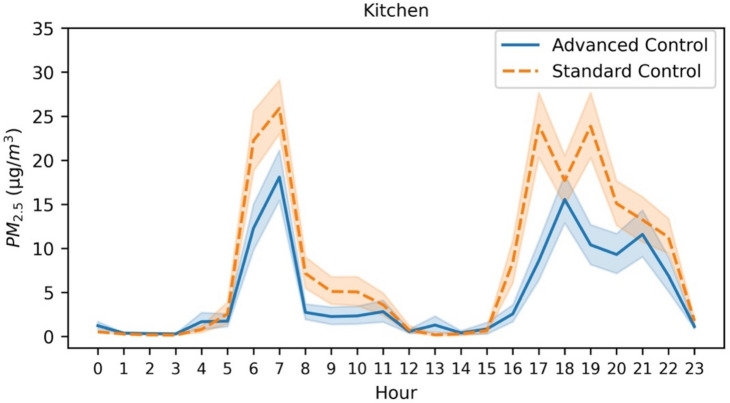
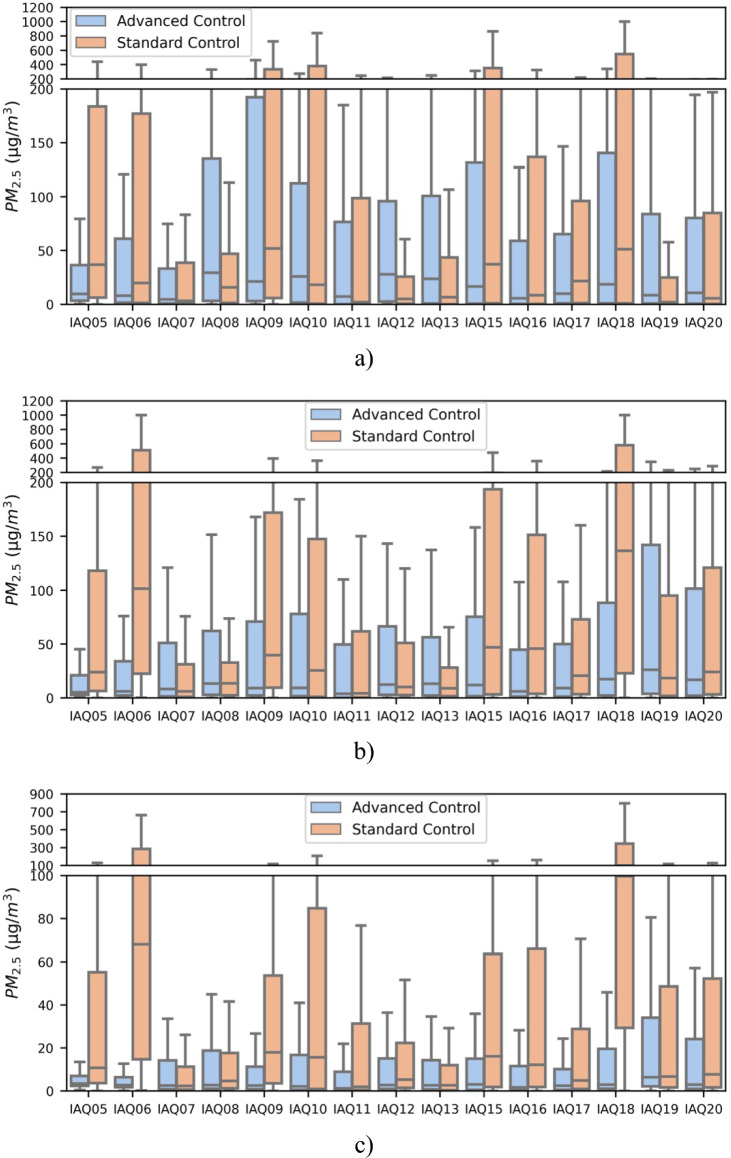
We implemented a crossover study design exposing 15 participants to two indoor air quality conditions in the Well Living Lab. The first condition, the Standard Control Condition, resembled the ventilation and air supply of a typical home in the USA with a manually operated stove hood. The second condition, Advanced Control, had an automated: (i) stove hood, (ii) two portable air cleaners (PAC), and (iii) bathroom exhaust. The PM2.5 sensors were placed in the kitchen, living room, bedroom, and bathroom. Once the sensor detected a PM2.5 level of 15 μg/m3 or higher, an air quality intervention (stove hood, PAC or bathroom exhaust) in that space was activated and turned off when the corresponding PM2.5 sensor had three consecutive readings below 6 μg/m3. Advanced Control in the overall apartment reduced PM2.5 concentration by 40% compared to the Standard Control. The PM2.5 concentration difference between Advanced and Standard Control was ~ 20% in the kitchen. This can be attributed to using the stove hood manually in 66.5% of cooking PM2.5 emission events for 323.6 h compared to 88 h stove hood used in automated mode alongside 61.9 h and 33.7 h of PAC use in living room and bedroom, respectively.
© 2024. The Author(s).
Conflict of interest statement
The authors declare no competing interests.
Figures


Similar articles
-
Home interventions are effective at decreasing indoor nitrogen dioxide concentrations.Indoor Air. 2014 Aug;24(4):416-24. doi: 10.1111/ina.12085. Epub 2014 Jan 11. Indoor Air. 2014. PMID: 24329966 Free PMC article. Clinical Trial.
-
Experimental evaluation of the impact of ventilation on cooking-generated fine particulate matter in a Chinese apartment kitchen and adjacent room.Environ Pollut. 2024 May 1;348:123821. doi: 10.1016/j.envpol.2024.123821. Epub 2024 Mar 21. Environ Pollut. 2024. PMID: 38521392
-
Characteristics of cooking-generated PM10 and PM2.5 in residential buildings with different cooking and ventilation types.Sci Total Environ. 2019 Jun 10;668:56-66. doi: 10.1016/j.scitotenv.2019.02.316. Epub 2019 Feb 21. Sci Total Environ. 2019. PMID: 30852226
-
Optimizing kitchen ventilation with integrated stove air supply and fume exhaust: enhancing PM2.5 capture efficiency and energy-saving effect.Environ Technol. 2025 Sep;46(21):4295-4308. doi: 10.1080/09593330.2025.2500783. Epub 2025 May 12. Environ Technol. 2025. PMID: 40356069
-
Indoor thermal environment and air quality in Chinese-style residential kitchens.Indoor Air. 2020 Mar;30(2):198-212. doi: 10.1111/ina.12631. Epub 2020 Jan 2. Indoor Air. 2020. PMID: 31845405 Review.
References
-
- Wan, M.-P., Wu, C.-L., Sze To, G.-N., Chan, T.-C. & Chao, C. Y. H. Ultrafine particles, and PM2.5 generated from cooking in homes. Atmos. Environ.45, 6141–6148 (2011).10.1016/j.atmosenv.2011.08.036 - DOI
-
- Zeng, L. et al. Occupant exposure and ventilation conditions in Chinese residential kitchens: Site survey and measurement for an old residential community in Shanghai. J. Build. Eng.31, 101406 (2020).10.1016/j.jobe.2020.101406 - DOI
-
- Park, Y. M. et al. Personal exposure monitoring using GPS-enabled portable air pollution sensors: A strategy to promote citizen awareness and behavioral changes regarding indoor and outdoor air pollution. J. Expo Sci. Environ. Epidemiol.33, 347–357 (2023). 10.1038/s41370-022-00515-9 - DOI - PMC - PubMed
Publication types
MeSH terms
Substances
LinkOut - more resources
Full Text Sources
Medical
Miscellaneous
