. 2024 Sep 4;14(1):20575.
doi: 10.1038/s41598-024-71462-8.

The compartment-specific manipulation of the NAD+/NADH ratio affects the metabolome and the function of glioblastoma

Affiliations

The compartment-specific manipulation of the NAD+/NADH ratio affects the metabolome and the function of glioblastoma

Myunghoon Lee et al. Sci Rep. .

Abstract

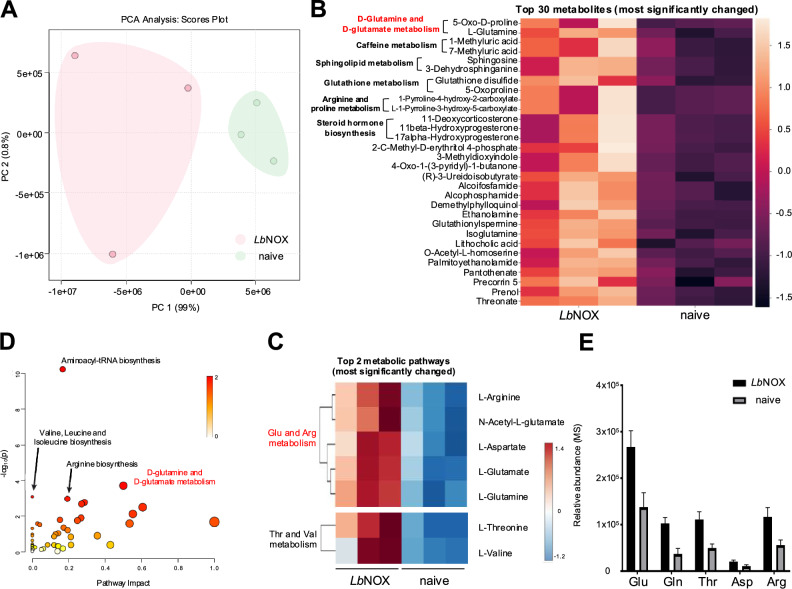
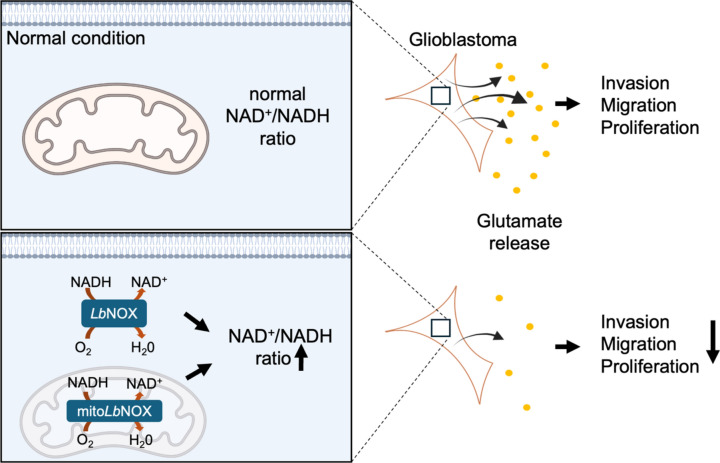
Glioblastoma multiforme (GBM) is the most aggressive type of cancer in the brain and has an inferior prognosis because of the lack of suitable medicine, largely due to its tremendous invasion. GBM has selfish metabolic pathways to promote migration, invasion, and proliferation compared to normal cells. Among various metabolic pathways, NAD (nicotinamide adenine dinucleotide) is essential in generating ATP and is used as a resource for cancer cells. LbNOX (Lactobacillus brevis NADH oxidase) is an enzyme that can directly manipulate the NAD+/NADH ratio. In this study, we found that an increased NAD+/NADH ratio by LbNOX or mitoLbNOX reduced intracellular glutamate and calcium responses and reduced invasion capacity in GBM. However, the invasion was not affected in GBM by rotenone, an ETC (Electron Transport Chain) complex I inhibitor, or nicotinamide riboside, a NAD+ precursor, suggesting that the crucial factor is the NAD+/NADH ratio rather than the absolute quantity of ATP or NAD+ for the invasion of GBM. To develop a more accurate and effective GBM treatment, our findings highlight the importance of developing a new medicine that targets the regulation of the NAD+/NADH ratio, given the current lack of effective treatment options for this brain cancer.

Keywords: LbNOX; Glioblastoma; Glutamate; Invasion; NAD+/NADH.


Conflict of interest statement

The authors declare no competing interests.

Figures

Fig. 1
Fig. 1
Effect of LbNOX, mitoLbNOX expression on NAD+/NADH ratio and ATP levels in U-87 MG. (A) The map of the lentiviral CMV-LbNOX and CMV-mitoLbNOX constructs, as well as a step-by-step procedure for virus collection and subsequent infection of U-87 MG. (B) The representative photographs of LbNOX (left) and mitoLbNOX (right) in U-87 MG, with photographs of GFP and DIC. Scale bar = 20 μm. (C) The NAD+/NADH ratio curve in each condition by time using kinetic mode measurement. Each plot contains 3 wells of data. (D) The bar graph shows the concentration of ATP in each condition (naive and mitoLbNOX: n = 6, LbNOX: n = 5). All individual dots are data from a single well. All data are reported as mean with SEM. All data were analyzed by one-way ANOVA followed by a Tukey’s multiple comparisons test. **P < 0.01, *P < 0.05.
Fig. 2
Fig. 2
LbNOX alters the intracellular glutamate pathway. An overview of metabolic profiling. (A) Principal component analysis (PCA) of naive and LbNOX-expressing U-87 MG cells. The PCA was performed on 91 metabolites selected from the metabolite profiling, which were significantly altered (± 1.5 < fold-change, P value < 0.05). Pink represents the naive sample group, and green represents the LbNOX expression group (n = 3). (B) Heatmap of the 30 most significantly changed metabolites. The color scale values on the side represent relative intensity. Among the 91 changed metabolites, the top 30 that were most significant and showed the most change were displayed. (C) Graph of pathway impact analysis using 91 altered metabolites. The analysis was performed as described using MetaboAnalyst 5.0. The color represents the ratio of altered metabolites in a given pathway; thus, in pathways with lower p-values, more metabolites were altered. The circle size is proportional to the impact score, ranging from 0 to 1.0. (D) Heatmap of metabolites in the pathways that were most significantly impacted by the pathway analysis. (E) Bar graph of the relative abundance of the metabolite that differs most between samples. Black is the LbNOX sample, and gray is the naive sample. The x-axis represents metabolites and the y-axis represents relative abundance based on mass-spectrometry. Glu, glutamate; Gln, glutamine; Thr, threonine; Asp, aspartate; Arg, arginine.
Fig. 3
Fig. 3
The release of glutamate from U-87 MG is reduced by LbNOX and mitoLbNOX. (A) Schematic image for glutamate imaging. (B) The representative photographs for glutamate imaging from U-87 MG expressed with iGluSnFR, Glutamate sensor. Scale bar = 50 μm. Fluorescence photographs from U-87 MG before and after TFLLR puffing. (C) Traces of glutamate imaging from naive cells (left, n = 39), cells expressing LbNOX (center, n = 29), and mitoLbNOX (right, n = 18). Scales bars = 0.02 ΔF/F0, 20 s time. The black trace is the glutamate signal for individual cells, and the red one is the average value of the cells. The red triangle is the puffing of 500 μM TFLLR at 20 s. (D. The bar graph shows the ΔF/F0 peak in each condition. An individual dot is data from a single cell. Data are reported as mean with SEM. Data were analyzed by a Tukey’s multiple comparisons test. *P = 0.0408, ***P = 0.0008.
Fig. 4
Fig. 4
Analysis of motility, invasion, and proliferation in GBM expressing LbNOX and mitoLbNOX. (A) The representative photographs of a wound healing assay from U-87 MG naive cells (left), LbNOX expression cells (center), and mitoLbNOX expression cells (right). These photographs show the assay at 0 h (top) and 24 h (bottom) after the scratch with the cell-free region (yellow line). Scale bar = 500 μm. (B) The bar graph shows the percentage of healing in each condition (naive and LbNOX: n = 15, mitoLbNOX: n = 9). (C) The representative photographs for the invasion assay were obtained by staining U-87 MG with DAPI for each condition. Scale bar = 500 μm. (D) The percentage of invasion was presented as a bar graph in each condition (naive: n = 3, LbNOX and mitoLbNOX: n = 5). (E) The bar graph shows the normalized proliferation O.D values (naive, LbNOX, and mitoLbNOX: n = 16). (F) The representative photographs of LbNOX (top) and mitoLbNOX (bottom) in U-373 MG, with photographs of GFP and DIC. Scale bar = 20 μm. (G–K) Same as (A–E). However, J is displayed as the number of DAPI. All individual dots are data from a single well. All data are reported as mean with SEM. All data were analyzed by one-way ANOVA followed by a Tukey’s multiple comparisons test.
Fig. 5
Fig. 5
Expression of LbNOX and mitoLbNOX reduces intracellular calcium responses. (A) The representative photographs for calcium imaging from U-87 MG loaded with Fura-2 AM. Photographs of DIC, GFP, and Fura-2 AM are from the left. Scale bar = 50 μm. Schematic image for calcium imaging (center) and pseudo-color photographs from Fura-2 AM loaded U-87 MG before and after TFLLR application (right). The scale bar on the right is the normalized 340/380 nm ratio. (B) Traces of calcium imaging from naive cells (left, n = 115), cells expressing LbNOX (center, n = 105), or mitoLbNOX (right, n = 77). Scale bars = 0.02 ratio, 100 s time. The black trace is the calcium signal for individual cells, and the red one is the average value of the cells. The blue horizontal bar is the application of 30 μM TFLLR by the time of the scale. (C) The bar graph shows the normalized 340/380 nm peak in each condition. An individual dot is data from a single cell. Data are reported as mean with SEM. Data were analyzed by one-way ANOVA followed by a Tukey’s multiple comparisons test. ****P < 0.0001, **P = 0.0026.
Fig. 6
Fig. 6
Rotenone and Nicotinamide Riboside do not affect invasion. (A) The bar graph shows the concentration of ATP in each condition (control and Rotenone: n = 6). (B) The NAD+/NADH ratio curve in each condition by time using kinetic mode measurement. Each plot contains 3 wells of data. (C) The representative photographs for the invasion assay were obtained by staining U-87 MG with DAPI for each condition. Scale bar = 500 μm. (D) The percentage of invasion was presented as a bar graph in each condition (control: n = 2, rotenone: n = 7, NR: n = 6). (E) Traces of calcium imaging from cells treated with rotenone (center, n = 108), NR (right, n = 114), and non-treated control (left, n = 78). Scale bars = 0.02 ratio, 100 s time. The black trace is the calcium signal for individual cells, and the red one is the average value of the cells. The blue horizontal bar is the application of 30 μM TFLLR by the time of the scale. The orange one is the application of 1 μM rotenone and the purple one is the application of 500 μM NR during the entire recording. (F) The bar graph shows the normalized 340/380 nm peak in each condition. An individual dot is data from a single well (A, D), and a single cell (F). All data are reported as mean with SEM. Data were analyzed by two-tailed unpaired Student's t test (A, B), and one-way ANOVA followed by a Tukey’s multiple comparisons test (D, F). ****P < 0.0001, ***P < 0.001.
Fig. 7
Fig. 7
Graphical summary of this study.

References

    1. Louis, D. N. et al. The 2021 WHO classification of tumors of the central nervous system: A summary. Neuro-oncology23, 1231–1251 (2021). 10.1093/neuonc/noab106 - DOI - PMC - PubMed
    1. Bleeker, F. E., Molenaar, R. J. & Leenstra, S. Recent advances in the molecular understanding of glioblastoma. J. Neuro-oncology108, 11–27 (2012). 10.1007/s11060-011-0793-0 - DOI - PMC - PubMed
    1. Tan, A. C. et al. Management of glioblastoma: State of the art and future directions. CA Cancer J. Clin.70, 299–312 (2020). 10.3322/caac.21613 - DOI - PubMed
    1. Tran, B. & Rosenthal, M. Survival comparison between glioblastoma multiforme and other incurable cancers. J. Clin. Neurosci.17, 417–421 (2010). 10.1016/j.jocn.2009.09.004 - DOI - PubMed
    1. Kang, S. S. et al. Caffeine-mediated inhibition of calcium release channel inositol 1, 4, 5-trisphosphate receptor subtype 3 blocks glioblastoma invasion and extends survival. Cancer Res.70, 1173–1183 (2010). 10.1158/0008-5472.CAN-09-2886 - DOI - PMC - PubMed

LinkOut - more resources