. 2024 Sep;56(9):2033-2051.
doi: 10.1038/s12276-024-01310-2. Epub 2024 Sep 4.

Immunoliposome-based targeted delivery of the CRISPR/Cas9gRNA-IL30 complex inhibits prostate cancer and prolongs survival

Affiliations

Immunoliposome-based targeted delivery of the CRISPR/Cas9gRNA-IL30 complex inhibits prostate cancer and prolongs survival

Cristiano Fieni et al. Exp Mol Med. 2024 Sep.

Abstract

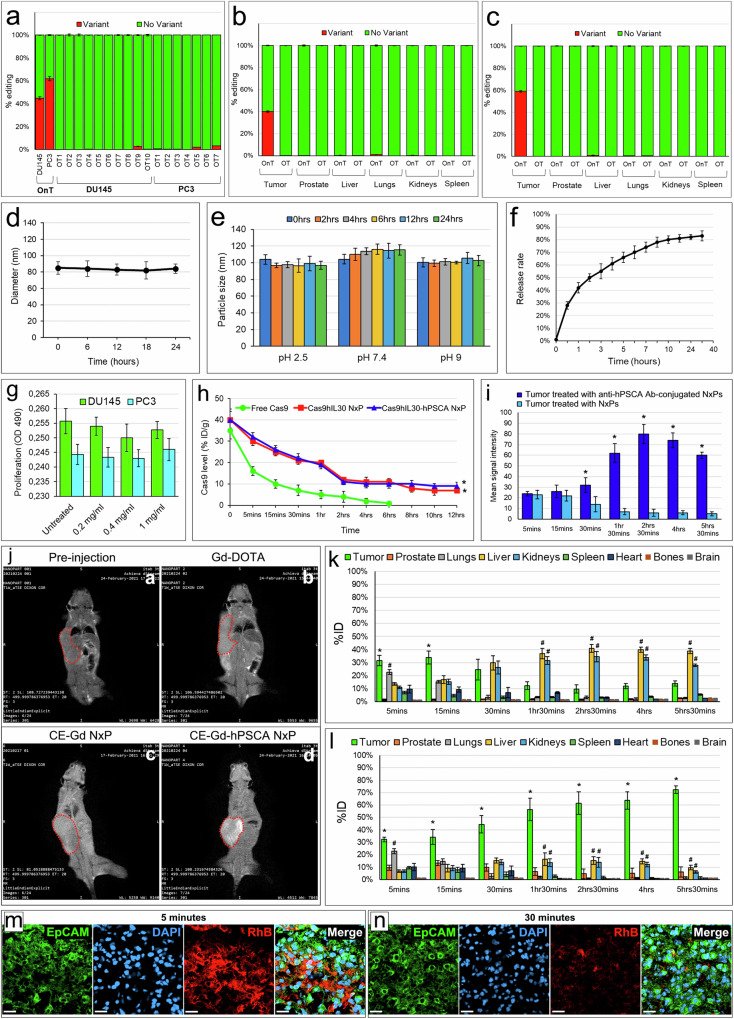
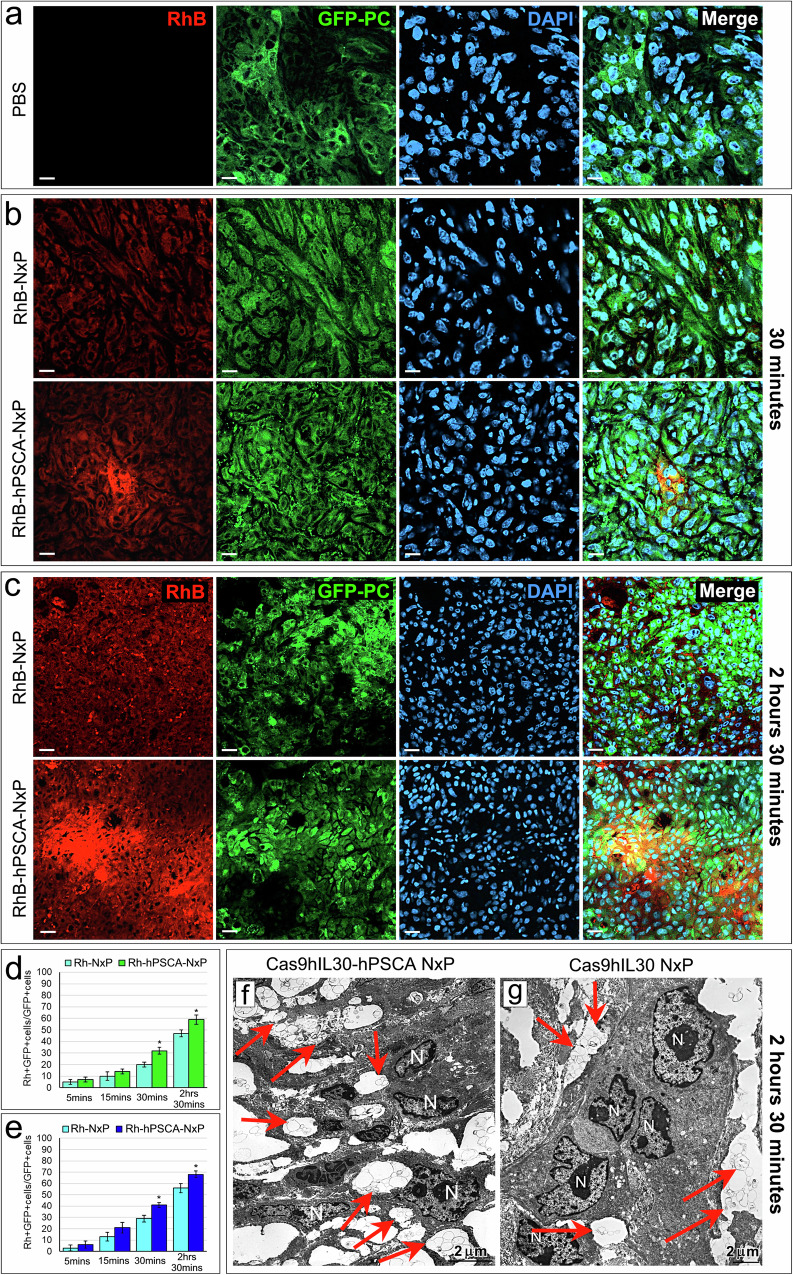
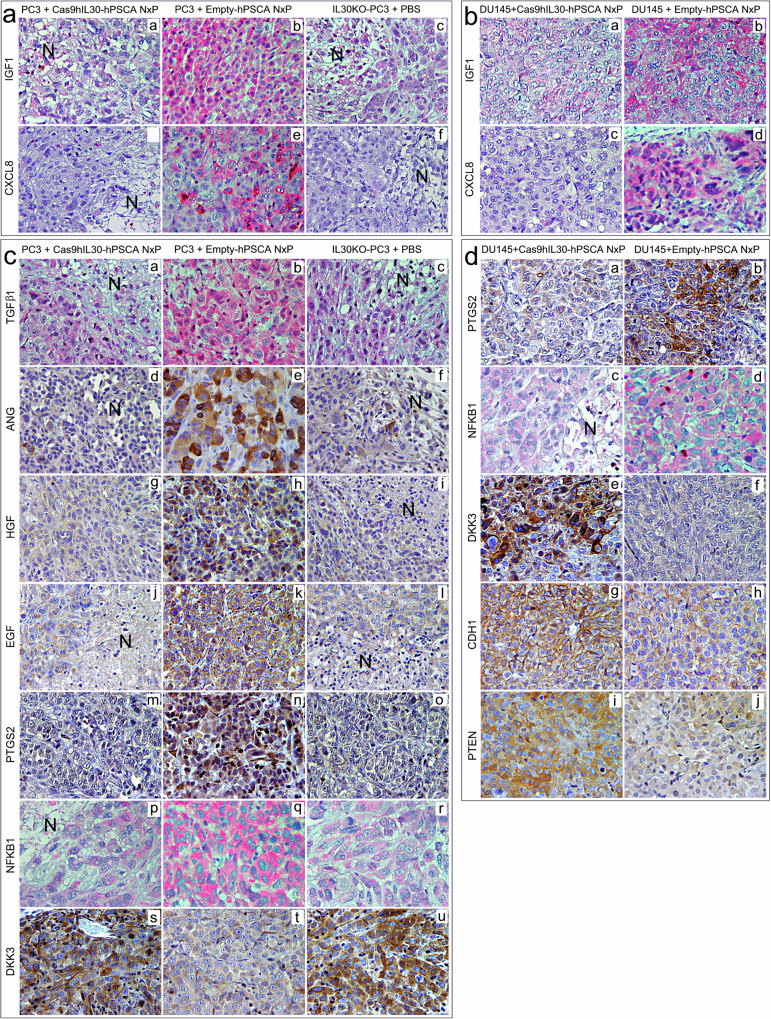
The development of selective and nontoxic immunotherapy targeting prostate cancer (PC) is challenging. Interleukin (IL)30 plays immunoinhibitory and oncogenic roles in PC, and its tumor-specific suppression may have significant clinical implications. CRISPR/Cas9-mediated IL30 gene deletion in PC xenografts using anti-PSCA antibody-driven lipid nanocomplexes (Cas9gRNA-hIL30-PSCA NxPs) revealed significant genome editing efficiency and circulation stability without off-target effects or organ toxicity. Biweekly intravenous administration of Cas9gRNA-hIL30-PSCA NxPs to PC-bearing mice inhibited tumor growth and metastasis and improved survival. Mechanistically, Cas9gRNA-hIL30-PSCA NxPs suppressed ANGPTL 1/2/4, IL1β, CCL2, CXCL1/6, SERPINE1-F1, EFNB2, PLG, PF4, VEGFA, VEGFD, ANG, TGFβ1, EGF and HGF expression in human PC cells while upregulated CDH1, DKK3 and PTEN expression, leading to low proliferation and extensive ischemic necrosis. In the syngeneic PC model, IL30-targeting immunoliposomes downregulated NFKB1 expression and prevented intratumoral influx of CD11b+Gr-1+MDCs, Foxp3+Tregs, and NKp46+RORγt+ILC3, and prolonged host survival by inhibiting tumor progression. This study serves as a proof of principle that immunoliposome-based targeted delivery of Cas9gRNA-IL30 represent a potentially safe and effective strategy for PC treatment.


Conflict of interest statement

The authors declare no competing interests.

Figures

Fig. 1
Fig. 1. PSCA expression in PC3 and DU145 cells and specific binding and uptake of nanoliposomes conjugated with anti-hPSCA Ab by tumor cells.
a PSCA expression is almost absent in the normal epithelium of the human prostate gland (a), while it is marked in the neoplastic epithelium of tumors that develop after s.c. implantation of DU145 (b) or PC3 (c) cells in NSG mice. Magnification: 630×. Scale bars: 10 µm. b Cytofluorimetric analyses of PSCA expression on the surface of DU145 (images on the left) and PC3 (images on the right) cells. Blue areas: specific Abs. Red areas: isotype controls. Representative images of the experiments performed in triplicate are shown (additional images from the flow cytometric analyses are shown in Supplementary Fig. 4a and b). c Specific binding of anti-hPSCA Ab-conjugated/rhodamine B-labeled nanoliposomes (RhB-hPSCA-NxP) to the surface of DU145 (top right picture) and PC3 (bottom right picture) cells compared to unconjugated/rhodamine B-labeled nanoliposomes (RhB-NxP) (top left and bottom left pictures). Blue areas: anti-hPSCA Ab-conjugated or unconjugated NxPs. Red areas: isotype controls. The experiments were performed in triplicate. d The immunoliposome used in this study consists of a bilayer phospholipid spheroid vesicle containing the CRISPR/Cas9gRNA-hIL30 complex and functionalized with anti-hPSCA Abs linked to PEGylated lipids. e, f DLS analysis of the zeta potential of empty-hPSCA NxP (29.17 ± 3.56 mV) (e) and of Cas9hIL30-hPSCA NxP (3.42 ± 1.49 mV) (f). g Electron microscopy analysis of nanoparticles cultured with DU145 cells showing their spherical shape and submicron size, and the high homogeneity of both features. On the right, a magnified detail of the image illustrating the ultrastructural features of the NxPs. PM: plasma membrane. M mitochondrion. N nucleus. The values of the scale bars are reported in the images. hj Ultrastructural features of DU145 cells untreated (h) or treated with Cas9hIL30-hPSCA NxPs (i), which contain spherical-shaped vesicles composed of one or more phospholipid bilayers (arrowheads). j The image shows a magnification of one of these vesicles located close to the nuclear envelope. PM: plasma membrane. M mitochondrion. N nucleus. The values of the scale bars are reported in the images. k Ultrastructural features of DU145 cells that were not treated (a, b) or treated with Cas9hIL30 NxPs (c, d) or Cas9hIL30-hPSCA NxPs (e, f). Similar to that observed in the untreated PC cells (a, b), the treated cells contained intact mitochondria and endoplasmic reticulum (c–f) with no signs of ultrastructural damage to the cytoplasmic organelles. After 2 hrs of treatment, the unconjugated NxPs largely remained on the tumor cell surface (c, arrows), whereas the anti-hPSCA Ab-conjugated NxPs were endocytosed by the tumor cell and were mostly found in the cell cytoplasm (e, arrows). Three hours after treatment, spherical vesicles containing more phospholipid bilayers (arrows) were detected in the cytoplasm of both tumor cells treated with Ab-conjugated (f) and unconjugated (d) NxPs. These results are comparable to those obtained with PC3 cells. PM plasma membrane. M mitochondrion. N nucleus. The values of the scale bars are reported in the images.
Fig. 2
Fig. 2. Physical characterization and biodistribution of Cas9hIL30-hPSCA NxPs.
a On-target and off-target characterization of CRISPR/Cas9gRNA-mediated hIL30 editing delivered using immunoliposomes in vitro. Average frequency of CRISPR/Cas9-induced variants in the IL30 gene (editing efficiency or on-target effects, OnT) and in off-target sites corresponding to recognized genetic loci (off-target effects, OTs) in DU145 and PC3 cell cultures treated with Cas9hIL30-hPSCA NxPs. The frequency of variants (OnT and OTs) in cells treated with PBS or Empty-hPSCA NxPs (controls) was <0.1%. The experiments were performed in triplicate. b, c On-target and off-target characterization of CRISPR/Cas9gRNA-mediated hIL30 editing by immunoliposomes in vivo. Average frequency of CRISPR/Cas9-induced variants in the IL30 gene (editing efficiency or on-target effects, OnT) and in off-target sites (off-target effects, OTs) in the indicated organs of DU145 (b) and PC3 (c) tumor-bearing NSG mice treated with Cas9hIL30-hPSCA NxPs. The frequency of variants (OnT and OTs) in the organs of mice treated with PBS or empty-hPSCA NxPs (controls) was <0.1%. d, e Serum (d) and pH (e) stability of Cas9hIL30-hPSCA NxPs measured at different time points over a 24-h period. The experiments were performed in triplicate. f Cas9 release profile of Cas9gRNA-hIL30 NxP. The experiments were performed in triplicate. g Viability of DU145 (green bars) and PC3 (light blue bars) cells after 48 hrs of incubation with different concentrations (0.2, 0.4, or 1.0 mg/ml) of empty-hPSCA NxPs versus PBS-treated cells. ANOVA, p > 0.05. The results obtained from untreated cells were comparable to those from PBS-treated cells. The experiments were performed in triplicate. h Pharmacokinetics of free Cas9 and Cas9hIL30 NxPs, conjugated or not with anti-hPSCA Abs, in PC3 tumor-bearing NSG mice. %ID/g = percentage of total injection dose per weight. ANOVA, p < 0.001. *p < 0.01, Tukey HSD test versus free Cas9. i Quantitative analysis of T1-weighted MR images of tumors from mice treated with CE-Gd-hPSCA NxPs versus tumors from mice treated with CE-Gd NxPs at different time points after nanoparticle injection. ANOVA: p < 0.001. *p < 0.01, Tukey HSD test versus tumors of mice injected with unconjugated NxPs at the same time point. j In vivo T1-weighted MR images of tumor-bearing NSG mice before (a) and 2 hrs 30 min after intravenous injection with Gd-DOTA (b), CE-Gd NxPs (c) or CE-Gd-hPSCA NxPs (d). The tumors are indicated with red dotted circles. MRI data obtained from DU145 tumor-bearing mice are comparable to those obtained from PC3 tumor-bearing mice. All experiments were performed in triplicate. k Quantitative analysis of T1-weighted MR images of tumors versus organs in mice treated with CE-Gd NxPs at different time points after nanoparticle injection. Signal intensity is reported as a percentage of the injected dose (%ID). ANOVA: p < 0.001. *p < 0.01, Tukey HSD test versus organs at the same time point. #p < 0.01, Tukey HSD test versus tumor and other organs at the same time point. l Quantitative analysis of T1-weighted MR images of tumors versus organs in mice treated with CE-Gd-hPSCA NxPs at different time points after nanoparticle injection. Signal intensity is reported as a percentage of the injected dose (%ID). ANOVA: p < 0.001. *p < 0.01, Tukey HSD test versus organs at the same time point. #p < 0.01, Tukey HSD test versus other organs at the same time point. m, n Confocal microscopy images of lungs labeled with anti-EpCAM Abs (green) from DU145 tumor-bearing NSG mice, 5 min (m) and 30 min (n) after i.v. inoculation of RhB-hPSCA-NxPs (red). Similar results were obtained in mice inoculated with RhB-NxPs. DAPI: DNA-stained nuclei. Magnification: 400×. Scale bars: 10 µm.
Fig. 3
Fig. 3. Tumor uptake of intravenously injected rhodamine B (RhB)-labeled NxPs (RhB-NxP) and RhB-labeled NxPs conjugated with anti-hPSCA Abs (RhB-hPSCA-NxP) in tumor-bearing NSG mice.
ac Confocal microscopy images of tumors from PBS-treated (a) or RhB-labeled nanoparticle-treated (b, c) mice showing RhB-hPSCA-NxP (red) or RhB-NxP (red) uptake by GFP-labeled DU145 tumors (green), 30 min (b) or 2 hrs 30 min (c) after i.v. inoculation of NxPs. Images of tumors from PBS-treated mice were comparable at each time point. Similar results were obtained for GFP-labeled PC3 tumor-bearing NSG mice inoculated with RhB-hPSCA-NxPs or RhB-NxPs. DAPI: DNA-stained nuclei. Magnification: 400×. Scale bars: 10 µm. d, e Quantification of NxP uptake in DU145 (d, green bars) and PC3 (e, blue bars) tumors that developed in NSG mice using LSC microscopy. Tumor uptake of the RhB-NxPs (light green or blue) and RhB-hPSCA-NxPs (dark green or blue) is expressed as the mean percentage ± SD of RhB+GFP+ cells/total number of GFP+ cells. *p < 0.01, Student’s t test vs RhB-NxPs at the same time point. f, g TEM images of tumors 2 hrs 30 min after treatment of mice with Cas9hIL30-hPSCA NxPs (f) or Cas9hIL30 NxPs (g) showing that, at this time point, unconjugated NxPs (arrows) were poorly endocytosed and predominantly localized among tumor cells. In contrast, the majority of anti-hPSCA Ab-conjugated NxPs were endocytosed and primarily found in the cell cytoplasm (arrows). N nucleus. Scale bars: 2 μm.
Fig. 4
Fig. 4. Tumor growth and survival in PC xenograft-bearing mice treated with Cas9hIL30-hPSCA NxPs.
a Treatment schedules for NSG mice bearing human-derived subcutaneous PC3 (blue arrow) or DU145 (green arrow) tumors that express membrane-anchored IL30. In both xenograft models, treatment with two weekly doses of NxPs (10 mg/ml) started when the tumors were palpable (Ø 2 mm) and stopped when the tumors reached 2 cm3 and the mice were sacrificed. b The mean volume of subcutaneous tumors developed in 4 groups of fifteen NSG male mice after s.c. implantation of IL30KO or wild-type PC3 cells and treatment with PBS, empty-hPSCA NxPs, or Cas9hIL30-hPSCA NxPs. ANOVA: p < 0.0001. *p < 0.01, Tukey HSD test versus PC3 tumors treated with PBS or empty-hPSCA NxPs. The results obtained from tumors treated with Cas9-NTgRNA-hPSCA NxPs were comparable to those from tumors treated with empty-hPSCA NxPs. The results are expressed as the mean ± SD. c The mean volume of subcutaneous tumors developed in 4 groups of 15 NSG male mice after s.c. implantation of IL30KO or wild-type DU145 cells and treatment with PBS, empty-hPSCA NxPs, or Cas9hIL30-hPSCA NxPs. ANOVA, p < 0.0001. *p < 0.01, Tukey HSD test versus DU145 tumors treated with PBS or empty-hPSCA NxPs or Cas9hIL30-hPSCA NxPs. **p < 0.01, Tukey HSD test versus DU145 tumors treated with PBS or with empty-hPSCA NxPs. The results obtained from tumors treated with Cas9-NTgRNA-hPSCA NxPs were comparable to those from tumors treated with empty-hPSCA NxPs. The results are expressed as the mean ± SD. d Kaplan–Meier survival curves of 4 groups of fifteen NSG male mice bearing tumors developed after s.c. implantation of IL30KO PC3 cells or wild-type PC3 cells and treated with empty-hPSCA NxPs, Cas9hIL30-hPSCA NxPs or PBS. Mice bearing wild-type PC3 tumors, treated with Cas9hIL30-hPSCA NxPs, and mice bearing IL30KO-PC3 tumors survived longer than mice bearing wild-type PC3 tumors, treated with PBS or empty-hPSCA NxPs (63 versus 47 days; log-rank test: p < 0.000001). Mice were sacrificed when tumors reached 2 cm3 in size. e Kaplan–Meier survival curves of 4 groups of fifteen NSG male mice bearing tumors developed after s.c. implantation of IL30KO DU145 cells or wild-type DU145 cells and treated with empty-hPSCA NxPs, Cas9hIL30-hPSCA NxPs or PBS. Mice bearing wild-type DU145 tumors treated with Cas9hIL30-hPSCA NxPs survived longer than mice bearing wild-type DU145 tumors treated with PBS or empty-hPSCA NxPs (74 versus 58 days) but less than mice bearing IL30KO-DU145 tumors (94 days) (log-rank test: p < 0.000001). The mice were sacrificed when the tumors reached 2 cm3 in size. f Percentages of mice which developed lung metastases (>500 µm) or micrometastases (≤500 µm) in wild type (or IL30KO) PC3 tumor-bearing NSG mice, treated with Cas9hIL30-hPSCA NxPs or Empty-hPSCA NxPs. The results from PBS-treated wild-type PC3 tumor-bearing mice were comparable to those from empty-NxP-treated mice. *Fisher’s exact test, p = 0.0000000012 versus mice bearing wild-type PC3 tumors and treated with PBS, empty-hPSCA NxPs or Cas9hIL30-hPSCA NxPs. g Histopathological features of lung metastasis (M) that developed in empty-hPSCA NxP-treated mice bearing PC3 tumors (a), and lung micrometastases (m) that developed in PBS-treated mice bearing IL30KO-PC3 tumors (b). Magnification: 400×. Scale bars: 10 µm. h Percentage of lung metastases spontaneously developed in wild-type (or IL30KO) DU145 tumor-bearing NSG mice treated with Cas9hIL30-hPSCA NxPs or empty-hPSCA NxPs. The results from PBS-treated wild-type DU145 tumor-bearing mice were comparable to those from empty-hPSCA NxP-treated mice. *Fisher’s exact test, p = 0.0003 versus mice bearing wild-type DU145 tumors and treated with PBS or Empty-hPSCA NxPs. i Histopathological features of lung metastasis (M) in empty-hPSCA NxP-treated mice bearing DU145 tumors (a) and healthy lung tissue from Cas9hIL30-hPSCA NxP-treated mice bearing DU145 tumors, which had not developed metastases (b). Magnification: 400×. Scale bars: 10 µm.
Fig. 5
Fig. 5. Immunopathological and molecular features of PC xenografts from mice treated with Cas9hIL30-hPSCA NxPs or Empty-hPSCA NxPs.
a, b Subcutaneous PC3 (a) and DU145 (b) tumors from Cas9hIL30-hPSCA NxP-treated animals show the absence of IL30 expression (a and b, a), multiple areas of vascular leakage (see the inset in a, b) and ischemic-coagulative necrosis (a and b, b) associated with defective vascularization (a and b, c) and low cancer cell proliferation (a and b, d), as observed in IL30KO tumors from PBS-treated mice (a, k–n). In contrast, tumors from Empty-hPSCA NxP-treated mice expressed IL30 (a, f; b, f), lacked ischemic and hemorrhagic damage (a, g; b, g), and exhibited a well-developed vascular network (a, h; b, h) and robust proliferative activity (a, i; b, i). Apoptotic events were comparable in tumors from the different treatment groups (a, e and j, o; b, e and j). The results obtained from wild-type PC3 or DU145 tumors developed in PBS-treated mice were comparable to those of tumors from empty-PSCA-treated mice. N, necrosis. Magnification: 400×. Scale bars: 10 µm (inset in a, b, 15 µm). c DU145 (green bars) and PC3 (light blue bars) cell viability after 72 h of incubation with (1.0 mg/ml) Cas9hIL30-hPSCA NxPs versus untreated and IL30KO cells. ANOVA: p < 0.001. *p < 0.01, Tukey HSD test versus untreated cells. #p < 0.01, Tukey HSD test versus Cas9hIL30-hPSCA NxP-treated cells and untreated cells. The results from untreated cells were comparable to those obtained from Empty-hPSCA NxP-treated cells. The experiments were performed in triplicate. d, e Human angiogenesis PCR array. Fold differences in the mRNAs of angiogenesis-related genes between IL30KO-DU145 cells and control NTgRNA-treated DU145 cells (d; light green bars) or PC3 cells (e; light blue bars) and between Cas9hIL30-hPSCA NxP-treated DU145 cells and control empty-hPSCA NxP-treated DU145 cells (d; dark green bars) or PC3 cells (e; dark blue bars). A significant threshold of a twofold change in gene expression corresponded to p < 0.001. Only genes with a fold change >2 are shown. The experiments were performed in duplicate. The dashed lines represent the twofold change cutoff. f Venn diagram representing the “Angiogenesis Driver Genes”, which are downregulated (red arrows pointing downward) or upregulated (blue arrows pointing upward) by IL30KO in DU145 (green circle) and PC3 cells (blue circle) and by Cas9hIL30-hPSCA NxP treatment of DU145 (purple circle) and PC3 cells (red circle). Overlapping circles illustrate the shared IL30-regulated genes between the different IL30 gene-editing approaches in the different cell lines.
Fig. 6
Fig. 6. Immunopathological aspects of PC xenografts from mice treated with Cas9hIL30-hPSCA NxPs or Empty-hPSCA NxPs.
a, b Expression of the proangiogenic genes IGF1 (g, a and b, c; h, a and b) and CXCL8 (g, d–f; h, c and d) was minimal to absent in Cas9hIL30-hPSCA NxP-treated PC3 (g, a and d) and in Cas9hIL30-hPSCA NxP-treated DU145 (h, a and c) tumors compared to empty-hPSCA NxP-treated PC3 (g, b and e) and empty-hPSCA NxP-treated DU145 (h, b and d) tumors, respectively. The immunohistochemical features of Cas9hIL30-hPSCA NxP-treated PC3 tumors (g, a and d) were similar to those observed in PBS-treated IL30KO-PC3 tumors (g, c and f). The immunohistochemical features of the control tumors that developed in the NSG after implantation of the NTgRNA-treated cells were comparable to those of the empty-hPSCA NxP-treated tumors and to those of the untreated wild-type tumors. N: necrosis. Magnification: 400×. Scale bars: 10 µm. c, d Subcutaneous PC3 (a) and DU145 (b) tumors from Cas9hIL30-hPSCA NxP-treated animals were characterized by marked inhibition of proangiogenic genes, such as TGFβ1 (a, a), ANG (a, d), HGF (a, g), EGF (a, j), and PC driver genes, such as PTGS2 (a, m; b, a) and NFKB1 (a, p; b, c), whereas tumor suppressors, such as DKK3 (a, s; b, e), CDH1/E-Cadh (b, g) and PTEN (b, i), were strongly expressed compared to empty-hPSCA NxP-treated tumors (a: b, e, h, k, n, q, t; b: b, d, f, h, j). The immunopathological features of Cas9hIL30-hPSCA NxP-treated PC3 tumors (a: a, d, g, j, m, p, s) were similar to those of PBS-treated IL30KO-PC3 tumors (a: c, f, l, o, r, u). The immunopathological features of control tumors that developed in NSGs after implantation of NTgRNA-treated cells were comparable to those of empty-hPSCA NxP-treated tumors and untreated wild-type tumors. N Necrosis. Magnification: 400× (NFKB1 immunostaining, 630×). Scale bars: 10 µm (NFKB1 immunostaining, 5 µm).
Fig. 7
Fig. 7. Morphological features of PC xenografts and organs of mice treated with Cas9hIL30-hPSCA NxPs or empty-hPSCA NxPs.
a, b TEM analyses of subcutaneous tumor xenografts, liver, and kidneys from PC3 (a) and DU145 (b) tumor-bearing NSG mice treated with Cas9hIL30-hPSCA NxPs, empty-hPSCA NxPs or PBS. Compared with the tumors of the PBS-treated mice (a, b), the tumors of the empty-hPSCA NxP- or Cas9hIL30-hPSCA NxP-treated mice exhibited cytoplasmic vacuoles that were consistent with aspects of nanoparticle endocytosis (arrows). The liver, glomeruli, and renal tubules of treated mice showed no signs of cell damage or ultrastructural features comparable to those of the respective organs of PBS-treated mice. N nucleus. M mitochondrion. PM plasma membrane. The values of the scale bars are reported in the images. c, d H&E staining showing that the lungs, heart, liver (c), kidneys, spleen, and prostate (d) of DU145 tumor-bearing NSG mice treated with Cas9hIL30-hPSCA NxPs (a, c, e) are histologically normal, with no signs of cell damage, and similar to those observed in empty-hPSCA NxP-treated mice (b, d, f). Similar results were obtained from the histopathology of the organs of PBS-treated mice. Magnification; c, a and b: 200×; c, c–f: 400×; d, a–f: 400×. Scale bars: c (a, b): 25 µm; c (c–f) and d (a–f): 15 µm.
Fig. 8
Fig. 8. Physical characterization and biodistribution of Cas9mIL30-mPSCA NxPs and their effect on tumor growth and survival in a fully immunocompetent host.
a PSCA expression in tumors developed after s.c. implantation of wild-type TRAMP-C1 and IL30-TRAMP-C1 cells in syngeneic C57BL/6J mice. Magnification: 630×. Scale bars: 10 µm. b Specific binding of anti-mPSCA-conjugated/rhodamine B-labeled nanoliposomes (RhB-mPSCA-NxPs) to the surface of IL30-TRAMP-C1 (right image) cells compared to unconjugated/rhodamine B-labeled nanoliposomes (RhB-NxPs) (left image). Blue areas: anti-mPSCA-conjugated or -unconjugated NxPs. Red areas: isotype controls. The experiments were performed in triplicate. c Ultrastructural features of IL30-TRAMP-C1 cells untreated (a) or treated with Cas9mIL30 NxPs (b, c) or Cas9mIL30-mPSCA NxPs (d, e). The nanoparticles appear spherical and have a regular, submicron size (b–e, arrows). After 2 hrs of treatment, the unconjugated NxPs largely remained on the tumor cell surface (b, arrows), showing poor penetration into the cytoplasm (c, arrowhead). In contrast, the anti-mPSCA-conjugated NxPs were endocytosed by the tumor cell and were mostly found in the cell cytoplasm (d, e, arrowheads). M mitochondrion. N nucleus. PM plasma membrane. The values of the scale bars are reported in the images. d On-target and off-target characterization of CRISPR/Cas9gRNA-mediated Il30 editing in vitro. Average frequency of CRISPR/Cas9gRNA-induced variants in the Il30 gene (editing efficiency or on-target effects, OnT) and in off-target sites corresponding to recognized genetic loci (off-target effects, OTs) in IL30-TRAMP-C1 cell cultures treated with Cas9mIL30-PSCA NxPs or Cas9mIL30-NxPs (total editing efficiency of 82% and 12%, respectively). The frequency of variants (OnT and OTs) in cells treated with empty-mPSCA NxPs or PBS (controls) was <0.1%. The experiments were performed in triplicate. e On-target and off-target characterization of CRISPR/Cas9gRNA-mediated Il30 editing in vivo. Average frequency of CRISPR/Cas9gRNA-induced variants in the Il30 gene (editing efficiency or on-target effects, OnT) and in off-target sites (OTs) in the indicated organs of IL30-TRAMP-C1 tumor-bearing C57BL/6J mice treated with Cas9mIL30-mPSCA NxPs. The frequency of variants (OnT and OTs) in the organs of mice treated with empty-mPSCA NxPs or PBS (controls) was <0.1%. f Sequencing of the sgRNA-targeted Il30 locus and mutation spectrum analysis using ICE. The image shows the percentage of frameshift or 21+ bp indels identified in IL30-TRAMP-C1 cells treated with Cas9mIL30-mPSCA NxPs or Empty-mPSCA NxPs. The data obtained from PBS-treated cells were comparable to those obtained from cells treated with empty-mPSCA NxPs. g Pharmacokinetics of free Cas9 and Cas9mIL30 NxPs conjugated or not conjugated with anti-mPSCA Abs in IL30-TRAMP-C1 tumor-bearing C57BL/6 J mice. %ID/g = percentage of total injection dose per weight. ANOVA, p < 0.001. *p < 0.01, Tukey HSD test versus free Cas9. h TEM analyses of syngeneic tumors from C57BL/6J mice treated with Cas9mIL30-mPSCA NxPs revealed spherical vesicles that were consistent with those of nanoparticles and close to (arrows) or inside (arrowheads) the tumor cells. N nucleus. PM plasma membrane. Scale bars: 2 μm. i The mean volume of wild-type and IL30-TRAMP-C1 subcutaneous tumors developed in C57BL/6J mice after treatment with Cas9mIL30-mPSCA, empty-mPSCA NxPs or PBS. ANOVA: p < 0.0001. *p < 0.01, Tukey HSD test versus IL30-TRAMP-C1 tumors treated with PBS or empty-mPSCA NxPs and PBS-treated wild-type TRAMP-C1 tumors. **p < 0.01, Tukey HSD test versus IL30-TRAMP-C1 tumors treated with PBS or Empty-mPSCA NxPs. The results are expressed as the mean ± SD. j Incidence of lung metastases in C57BL/6J mice bearing subcutaneous IL30-TRAMP-C1 tumors treated with Cas9mIL30-mPSCA, empty-mPSCA NxPs, or wild-type TRAMP-C1 treated with PBS. *Fisher’s exact test, p = 0.0005 versus IL30-TRAMP-C1 + empty-mPSCA NxPs. k Kaplan–Meier survival curves of 4 groups of fifteen C57BL/6J male mice bearing tumors developed after subcutaneous implantation of IL30-TRAMP-C1 cells or wild-type TRAMP-C1 cells treated with empty-mPSCA NxPs, Cas9mIL30-mPSCA NxPs or PBS. Mice bearing IL30-TRAMP-C1 tumors treated with Cas9mIL30-mPSCA NxPs survived longer (92 days) than mice bearing IL30-TRAMP-C1 tumors treated with PBS or empty-mPSCA NxPs (64 days) or mice bearing wild-type TRAMP-C1 tumors treated with PBS (78 days) (log-rank test: p < 0.000001). The mice were sacrificed when the tumors reached 2 cm3 in size. l TEM images of kidneys (a) and liver (b) from IL30-TRAMP-C1 tumor-bearing C57BL/6J mice treated with Cas9mIL30-mPSCA NxPs showing no signs of ultrastructural cell damage. N: nucleus. M: mitochondrion. Scale bars: 5 μm. m Subcutaneously developed IL30-TRAMP-C1 tumors from Empty-mPSCA NxP-treated animals (top panel) show a solid growth pattern with no signs of vascular damage (a), rich vascularization (b) and strong IL30 expression (c). In contrast, tumors from Cas9mIL30-mPSCA NxP-treated animals (bottom panel) showed multiple areas of vascular leakage (d, arrows) and hemorrhagic foci (arrowheads), which were associated with defective vascularization (e) and low to absent IL30 expression (f). Magnification a, c, d, f: 400×. Magnification b, e: 630×. Scale bars: a, c d, f: 25 µm; b, e: 10 µm. n Subcutaneously developed IL30-TRAMP-C1 tumors from Empty-mPSCA NxP-treated animals (top panel) showed considerable Foxp3+Treg lymphocyte (a) and NKp46+RORγt+ ILC3 (b) infiltration and high cytoplasmic and nuclear NFKB1 expression (c). Tumors from Cas9mIL30-mPSCA NxP-treated animals (bottom panel) showed few Foxp3+ Treg lymphocytes (d) and NKp46+RORγt+ ILC3 (e), and lower cancer cell expression of NFKB1 (f) compared to tumors from empty-mPSCA NxP-treated animals (c). Magnification: 400×. Scale bars: 25 µm.

Comment in

  • Immunoliposome targeting IL-30.
    Lloyd L. Lloyd L. Nat Rev Urol. 2024 Nov;21(11):649. doi: 10.1038/s41585-024-00958-9. Nat Rev Urol. 2024. PMID: 39390115 No abstract available.

References

    1. Siegel, R. L., Miller, K. D., Fuchs, H. E. & Jemal, A. Cancer statistics. CA Cancer J. Clin.72, 7–33 (2022). - PubMed
    1. Cheng, Z., Li, M., Dey, R. & Chen, Y. Nanomaterials for cancer therapy: current progress and perspectives. J. Hematol. Oncol.14, 85 (2021). - PMC - PubMed
    1. Liu, P., Chen, G. & Zhang, J. A review of liposomes as a drug delivery system: current status of approved products, regulatory environments, and future perspectives. Molecules27, 1372 (2022). - PMC - PubMed
    1. Sonju, J. J., Dahal, A., Singh, S. S. & Jois, S. D. Peptide-functionalized liposomes as therapeutic and diagnostic tools for cancer treatment. J. Control. Release329, 624–644 (2021). - PMC - PubMed
    1. Markowski, A. et al. Novel liposomal formulation of baicalein for the treatment of pancreatic ductal adenocarcinoma: design, characterization, and evaluation. Pharmaceutics15, 179 (2023). - PMC - PubMed