. 2024 Oct;43(20):4451-4471.
doi: 10.1038/s44318-024-00191-5. Epub 2024 Sep 4.

Structure of tetrameric forms of the serotonin-gated 5-HT3A receptor ion channel

Affiliations

Structure of tetrameric forms of the serotonin-gated 5-HT3A receptor ion channel

Bianca Introini et al. EMBO J. 2024 Oct.

Abstract

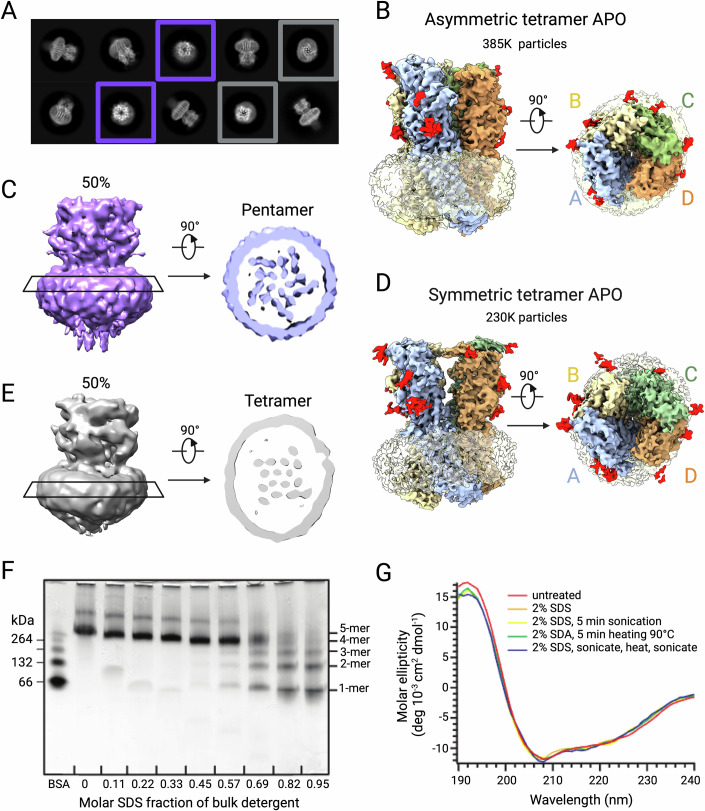
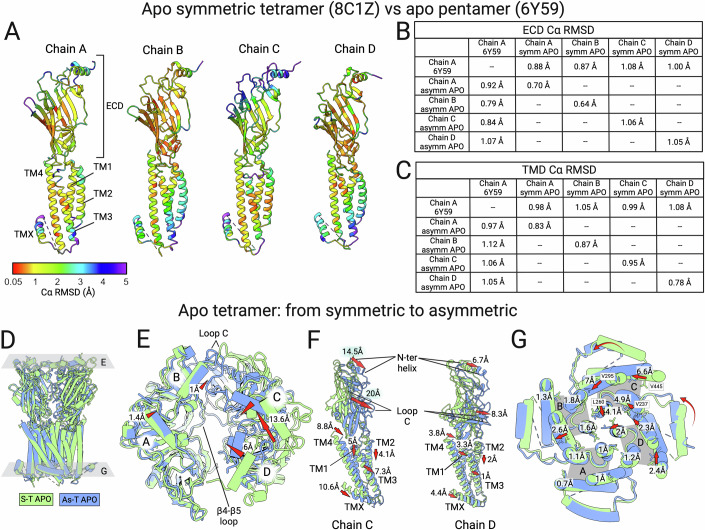
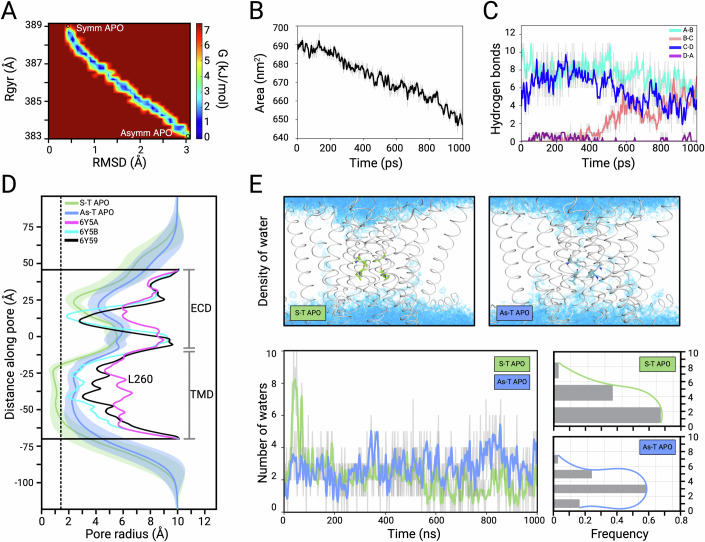
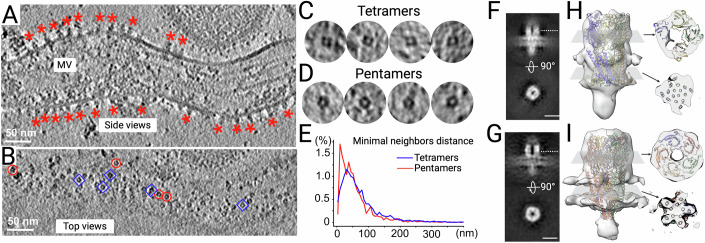
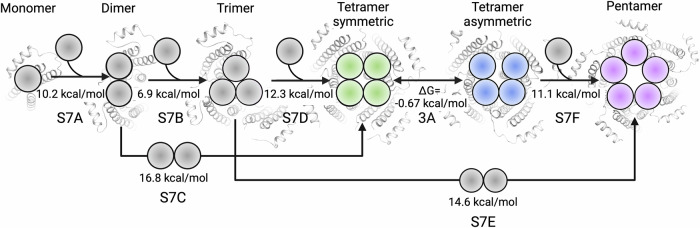
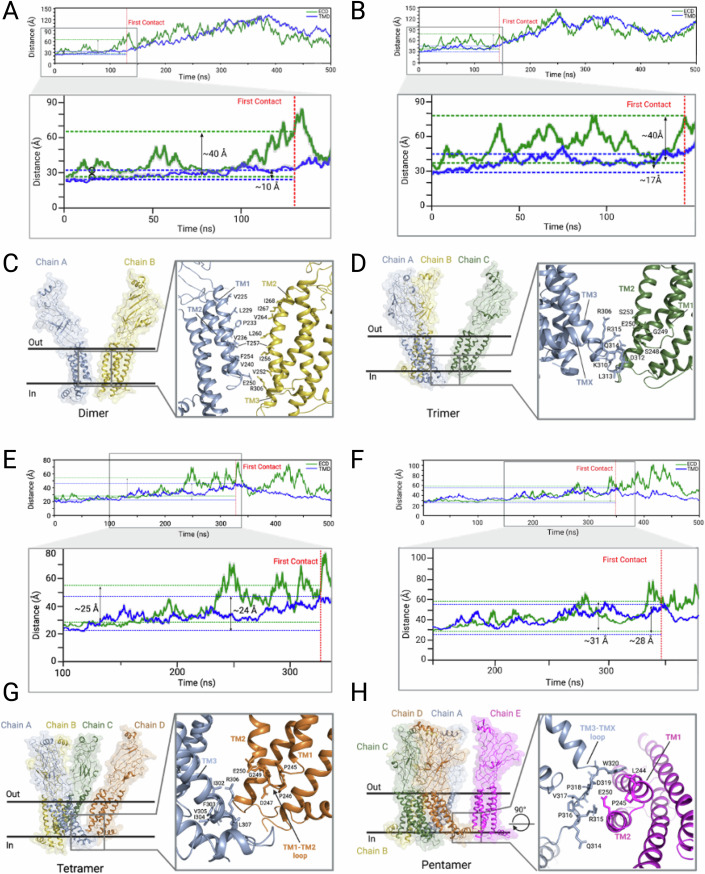
Multimeric membrane proteins are produced in the endoplasmic reticulum and transported to their target membranes which, for ion channels, is typically the plasma membrane. Despite the availability of many fully assembled channel structures, our understanding of assembly intermediates, multimer assembly mechanisms, and potential functions of non-standard assemblies is limited. We demonstrate that the pentameric ligand-gated serotonin 5-HT3A receptor (5-HT3AR) can assemble to tetrameric forms and report the structures of the tetramers in plasma membranes of cell-derived microvesicles and in membrane memetics using cryo-electron microscopy and tomography. The tetrameric structures have near-symmetric transmembrane domains, and asymmetric extracellular domains, and can bind serotonin molecules. Computer simulations, based on our cryo-EM structures, were used to decipher the assembly pathway of pentameric 5-HT3R and suggest a potential functional role for the tetrameric receptors.

Keywords: Cryo-EM; Ion Channels; Pentameric Ligand-gated Ion Channels; Serotonin Receptors.


Figures

Figure 1
Figure 1. Pentameric and lower oligomeric forms of 5-HT3AR.
(A) 2D class averages from the apo dataset of 5-HT3AR in Salipro, pentameric (purple), and tetrameric (gray) arrangements. (B) Cryo-EM map of tetrameric 5-HT3AR in an asymmetric conformation in the serotonin-free state. The subunits are color-coded: chain A is pale blue, chain B is pale yellow, chain C is green, and chain D is mustard. Salipro belt is in transparent yellow and N-glycosylations are in red. (C) Volume rendering of the apparent pentameric form of 5-HT3AR, containing approximately half of the particles. Sections through the transmembrane domain shown on the right indicate the characteristic arrangement of the subunits in the TMD. (D) Cryo-EM map of tetrameric 5-HT3AR in a symmetric conformation in the serotonin-free state. The subunits are color-coded: chain A is pale blue, chain B is pale yellow, chain C is green, and chain D is mustard. Salipro belt is in transparent yellow and N-glycosylations are in red. (E) Volume rendering of the apparent tetrameric form of 5-HT3AR, containing approximately half of the particles. Sections through the transmembrane domain shown on the right indicate the tetrameric arrangement of the subunits in the TMD. (F) BN-PAGE of 5-HT3AR unfolding by SDS. Samples were incubated for 30 min with increasing amounts of SDS (0 to 10 mM) and separated by native PAGE. Oligomers of BSA were used as size indicators (66, 132, 198, and 264 kDa). Oligomers of the receptor are indicated as 1-mer (monomer), 2-mer (dimer), 3-mer (trimer), 4-mer (tetramer), and 5-mer (pentamer). (G) Unfolding of 5-HT3AR by SDS measured by CD spectroscopy. Samples containing 150 μg 5-HT3AR were denatured by incubation with 2% SDS and a combination of sonication and heating, showing similar spectral profiles.
Figure 2
Figure 2. Comparison of the protomers of tetrameric and pentameric forms of the 5-HT3AR.
(A) Atomic models of single subunits of the tetramer, colored based on Cα RMSD value in Å when compared to a subunit of the pentameric apo C5 5-HT3AR (PDB ID: 6Y59). (B, C) Tables showing values of Cα RMSD (Å) at the level of the extracellular domain (ECD) and transmembrane domain (TMD) between the indicated chains. (DG) Superposition of atomic models of the apo symmetric and asymmetric tetramers aligned at subunits A. (E) Top view of superposed symmetric (i.e., S-T APO) and asymmetric (i.e., As-T APO) tetramers. Red arrows indicate the differences between the N-terminal helices of the symmetric and the asymmetric structures. (F) Comparison of chains C and D of symmetric (sage green) and asymmetric (cornflower blue) apo structures when aligned with respect to subunit A. (G) Superposition of structures at L260 (9′ position) of TM2. Displacements measured at the Cα atoms of indicated residues on each helix in the same cross-section are shown for (EG). A downward displacement of both C and D helices is observed in the transition from symmetric to asymmetric. Source data are available online for this figure.
Figure 3
Figure 3. MD simulations of the structural rearrangements from symmetrical to asymmetrical tetramer.
(A) Free energy surface obtained from enforced rotation simulation (ERS) during the rearrangement, depicted as a function of RMSD (X-axis) and the radius of gyration (Rgyr) as the Y-axis. Gibbs free energy values (G, kJ/mol) are represented by a rainbow color code. (B) Changes in Solvent Accessible Surface Area (SASA) of tetramer structures over simulation time in the ERS. (C) Number of hydrogen bonds at the interface between two specific subunits during the transition from symmetric (time = 0 ps) to asymmetric tetramer (time = 1000 ps) in the ERS. (D) Pore radius for different structures. Solid lines represent the average radius over 1 μs conventional simulations, with the shaded area indicating the standard deviation. The vertical dashed line denotes the radius of a water molecule (1.4 Å). (E) Average water molecule density in the TMD within 4 Å from L260 during conventional MD. Top: Water molecule densities are shown in blue; the subunits of the indicated model are gray. For each subunit, the residue L260 is shown as sticks. Bottom: Number of water molecules observed for the apo tetramer symmetric (S-T APO, in sage green) and asymmetric (As-T APO, in cornflower blue)) over 1 μs simulations (left panel). The histograms (right panels) show the averaged distribution of the number of water molecules observed during the simulation on the left. Source data are available online for this figure.
Figure 4
Figure 4. The binding of serotonin does not lead to conformational changes in the transmembrane domain.
(A, B) Superposition of the apo- (i.e., As-T APO) and serotonin-bound (i.e., As-T 5-HT) structures for the asymmetric tetramer. (A) Red arrows indicate the direction of the movement of the N-terminal helices. As we observed for the symmetric form, the HOLO conformation showed densities for serotonin only in two LBPs (numbered 1 and 2). (B) Cross-sections at the TMD residue L260 (9′ position) of M2. Displacements measured at the Cα atoms of the indicated residues on each helix in the same cross-section are shown. No large movements were observed. (C, D) Close-up of the LBPs of the apo and serotonin-bound tetramers. Serotonin is shown in orange. (E) Depicts the planes shown in (A) and (B) and serotonin densities are shown in orange. (F) Solvation-free energy gain (ΔiG, kcal/mol) on formation of the interface between indicated chains and ligands. Negative values indicate a hydrophobic interface, thus the more negative the value, the stronger the interaction. The ΔiG P-value is defined in (Krissinel, 2009). It is a measure of the specificity of the interface, P < 0.5 indicates interfaces with a higher-than-expected hydrophobicity, suggesting a specific molecular interaction. ΔiG and ΔiG P-values were calculated using the PDBePISA server (Krissinel and Henrick, 2007). PDB IDs of each tetrameric form deposited is reported above each panel. (G, H) Superpositions of the LBPs occupied by serotonin of the HOLO tetrameric 5-HT3R (As-T 5-HT) with the respective LBPs of the pentameric 5-HT3R (PDB ID:6Y5A). Serotonin molecules bound to the tetramers are displayed in orange while those bound to 6Y5A are in lavender
Figure 5
Figure 5. Structural analysis of tetrameric and pentameric forms of 5-HT3AR in plasma membrane vesicles.
(A, B) Slices through tomograms of native microvesicles (MV) from cells overexpressing 5-HT3AR. Scale bars: 50 nm. (A) Side views of the individual receptors are marked with red asterisks. (B) Top views of the receptors in the same vesicle; red circles highlight pentamers, blue squares—tetramers. (C, D) Views through individual tetramers (C) and pentamers (D). (E) Distance between closest neighbors in plasma membrane-derived microvesicles. (F, G) Subtomogram average structures of a tetramer (F) and a pentamer (G). The dotted white line indicates the slice of extracellular domain shown in (H) and (I). Scale bars are in solid white: 10 nm. (H, I) Volume-rendered visualizations of the average structures in native microvesicles overlaid with the atomic models of the asymmetric tetramer (H) and of the pentamer (I, PDB ID: 6Y59). Source data are available online for this figure.
Figure 6
Figure 6. Proposed model for pentamer assembly pathway.
The energy barrier values necessary to transit from one oligomeric state to another are expressed in kcal/mol. Under each arrow S7A–F refers to one of the FES representations shown in Fig. EV5A–F and 3A refers to Fig. 3A.
Figure 7
Figure 7. Formation of 5-HT3AR oligomers from precursors simulated by guided MD.
Graphs depict the closest distance between ECDs (green) and TMDs (blue) centers of an oligomer over simulation time. Subunits were pulled apart; invert time scale for assembly view. Close-ups show TMD centroid distances at first contact, e.g., 10 Å (A), 17 Å (B), marked by red dashed lines. All curves are triplicate averages. Models display the first contact residues for each simulation: dimer (A, B), trimer (C, D), tetramer (E, F), and pentamer formation (G, H). Source data are available online for this figure.
Figure EV1
Figure EV1. The binding of serotonin does not lead to conformational changes in the transmembrane domain.
(A, B) Superposition of apo- (i.e., S-T APO) and serotonin-bound (i.e., S-T 5-HT) structures for the symmetric tetramer, with serotonin densities in dark orange. Red arrows indicate N-terminal helices movement. Serotonin densities were resolved in two LBPs for the HOLO conformation. (B) Cross-sections at the TMD residue L260 (9′ position) of M2 show no large movements. Displacements measured at the Cα atoms of indicated residues on each helix are shown. (C, D) Close-up of the LBPs of the apo and serotonin-bound tetramers, with serotonin in orange. (E) Depicts the planes shown in (A) and (B) and shows the locations of 5-HT molecules in red. (F) Solvation-free energy gain (ΔiG, kcal/mol) on the formation of the interface between indicated chains and ligands, calculated using PDBePISA server (Krissinel and Henrick, 2007). Negative values indicate a hydrophobic interface, with more negative values indicating stronger interaction. The ΔiG P-value is defined in (Krissinel, 2009). It is a measure of the specificity of the interface, P-values less than 0.5 suggest a specific molecular interaction. PDB IDs of each tetrameric form are reported above each panel. (G, H) Superpositions of the LBPs occupied by serotonin of the HOLO tetrameric 5-HT3AR with the respective LBPs of the pentameric 5-HT5HT3AR (PDB ID:6Y5A). Serotonin molecules bound to the tetramers are displayed in orange, and those bound to 6Y5A are in lavender.
Figure EV2
Figure EV2. The transition from symmetric to asymmetric tetramer involves the major movement of two subunits.
Superposition of the models of the holo symmetric and holo asymmetric tetramers when aligned to subunit A. (A) Lateral view of the indicated superposed channels with the positions of the cross-sections analyzed in (B), (C), and (D). The models in (A) are visualized as chain traces. (B) Top view of the superposed channels. Red arrows indicate the direction of the movement of the N-terminal helices. (C) Cross-section at LBPs Serotonin molecules from the symmetric holo tetramer is shown in red, while those from the asymmetric holo tetramer are in orange. (D) Cross-sections at the TMD residue L260 (9′ position) of M2. Displacements measured at the Cα atoms of the indicated residues on each helix in the same cross-section are shown. Also, in the presence of the ligand, both C and D helices are experiencing a downward movement while transitioning from symmetric to asymmetric.
Figure EV3
Figure EV3. The addition of CaCl2 and serotonin does not cause relevant movements at the transmembrane level.
(A) Cryo-EM map of asymmetric 5-HT3AR tetramer in the presence of serotonin and 2 mM CaCl2 at a resolution of 6.55 Å. Positions of the cross-sections analyzed in (C), (D), and (E) are highlighted. (B) Estimating the resolution of the maps by FSC. (CE) Maps of the asymmetric tetramer in the APO (green), HOLO desensitized (blue) and HOLO with CaCl2 (salmon) were superposed and gaussian-filtered (standard dev 2.51) to facilitate comparison. (C) top view of the superposed maps. (D) Cross-section at the level of the ligand binding pockets (LBPs). The serotonin molecules visualized as balls and sticks are from the asymmetric holo tetramer (PDB ID: 8C21). The map suggests that in the presence of CaCl2, there is a closure of the loop C of the LBP. (E) Cross-sections at the TMD at the level of the residue L260 (9′ position) of M2.
Figure EV4
Figure EV4. Overview of the workflow of cryo-ET and subtomogram classification and averaging.
(A) Representative slice of a tomogram. (B) The particles were identified using GPU-accelerated template matching implemented in TomoBEAR (Balyschew et al, 2023). (C) Initially picked particles were subject to classification in Dynamo (Castaño-Díez et al, 2012). (D) Pentamer-looking classes were merged and processed to 19.6 Å resolution. and (E) the tetramer-looking classes were merged to produce a 25 Å map. No symmetry was applied.
Figure EV5
Figure EV5. Free energy surfaces (FES) acquired from metadynamics simulations for the assembly process of the 5-HT3AR.
(AF) Free energy surfaces (FES) acquired from metadynamics simulations. X-axis represents the distance between the extracellular regions of the two subunits in Å, Y-axis represents the distance between the transmembrane regions of the two subunits in Å. The computed Gibbs free energy values (G) are expressed in kcal/mol and are represented by isoenergy lines drawn every 1 kJ/mol and shown in rainbow color. The black circle at the intersection of the two dotted lines represents the highest energy well (x, y, and z1) of the starting complex (i.e., the structure obtained from the cryo-EM experiment). The red circle represents the location of the lowest energy well (x, y, and z2) near the starting structure. A white circle represents a second low-energy well. The energy barrier is calculated as the difference between z1 and z2. The resulting value corresponds to the energy barrier (kcal/mol) that has to be overcome for the transition to a certain higher oligomeric organization. For each transition this value is depicted in Fig. 6G. A: monomer + monomer = dimer; B: dimer + monomer = trimer; C: dimer + dimer = symmetric tetramer; FD trimer + monomer = symmetric tetramer; E: trimer + dimer = pentamer; F: tetramer + monomer = pentamer.

References

    1. Balyschew N, Yushkevich A, Mikirtumov V, Sanchez RM, Sprink T, Kudryashev M (2023) Streamlined structure determination by cryo-electron tomography and subtomogram averaging using TomoBEAR. Nat Commun 14:6543 - PMC - PubMed
    1. Barducci A, Bonomi M, Parrinello M (2011) Metadynamics. WIREs Comput Mol Sci 1:826–843
    1. Barducci A, Bussi G, Parrinello M (2008) Well-tempered metadynamics: a smoothly converging and tunable free-energy method. Phys Rev Lett 100:020603 - PubMed
    1. Barrera NP, Henderson RM, Edwardson JM (2008) Determination of the architecture of ionotropic receptors using AFM imaging. Pflüg Arch - Eur J Physiol 456:199–209 - PubMed
    1. Bas DC, Rogers DM, Jensen JH (2008) Very fast prediction and rationalization of pKa values for protein–ligand complexes. Proteins Struct Funct Bioinforma 73:765–783 - PubMed

LinkOut - more resources