. 2024 Oct;43(20):4668-4698.
doi: 10.1038/s44318-024-00207-0. Epub 2024 Sep 4.

Disordered regions in the IRE1α ER lumenal domain mediate its stress-induced clustering

Affiliations

Disordered regions in the IRE1α ER lumenal domain mediate its stress-induced clustering

Paulina Kettel et al. EMBO J. 2024 Oct.

Abstract

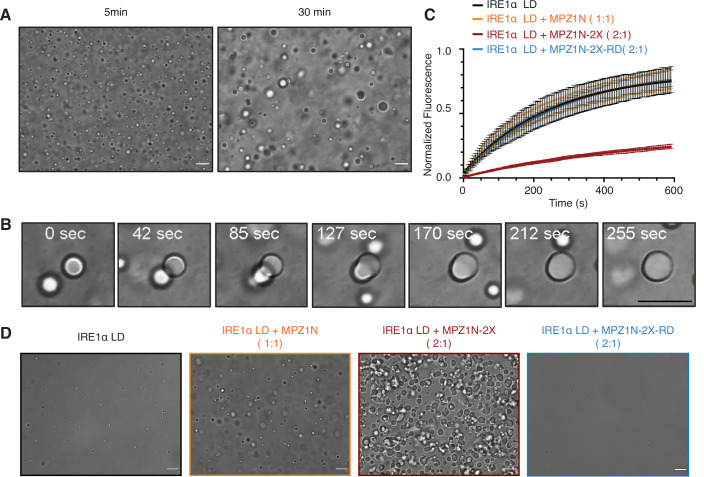
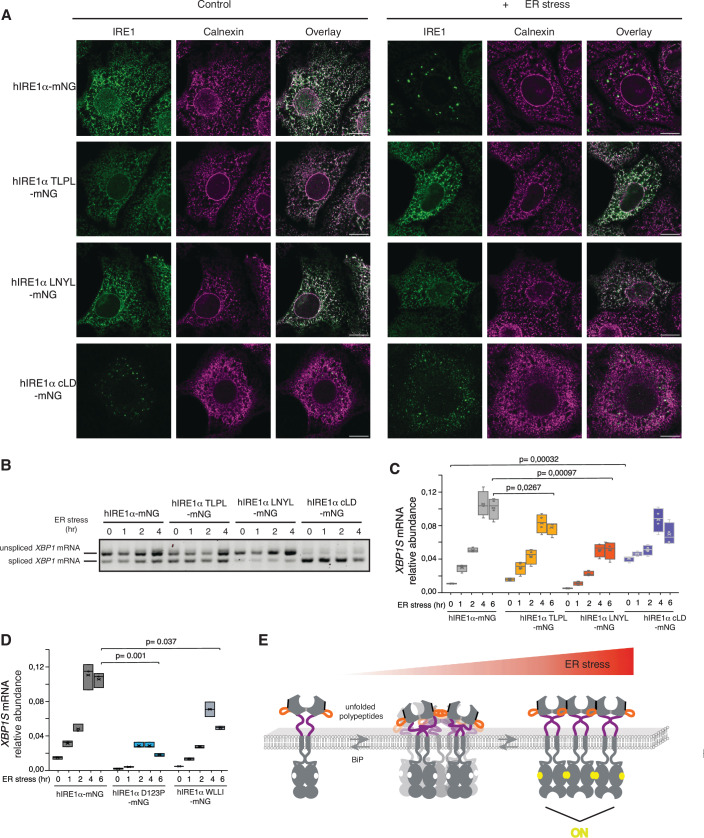
Conserved signaling cascades monitor protein-folding homeostasis to ensure proper cellular function. One of the evolutionary conserved key players is IRE1, which maintains endoplasmic reticulum (ER) homeostasis through the unfolded protein response (UPR). Upon accumulation of misfolded proteins in the ER, IRE1 forms clusters on the ER membrane to initiate UPR signaling. What regulates IRE1 cluster formation is not fully understood. Here, we show that the ER lumenal domain (LD) of human IRE1α forms biomolecular condensates in vitro. IRE1α LD condensates were stabilized both by binding to unfolded polypeptides as well as by tethering to model membranes, suggesting their role in assembling IRE1α into signaling-competent stable clusters. Molecular dynamics simulations indicated that weak multivalent interactions drive IRE1α LD clustering. Mutagenesis experiments identified disordered regions in IRE1α LD to control its clustering in vitro and in cells. Importantly, dysregulated clustering of IRE1α mutants led to defects in IRE1α signaling. Our results revealed that disordered regions in IRE1α LD control its clustering and suggest their role as a common strategy in regulating protein assembly on membranes.

Keywords: Biomolecular Condensates; IRE1; Supported Lipid Bilayers; Unfolded Protein Response.


Conflict of interest statement

The authors declare no competing interests.

Figures

Figure 1
Figure 1. IRE1α LD forms clusters on supported lipid bilayers (SLB).
(A) Schematic illustration of IRE1α domain architecture within the ER membrane. (B) Schematic illustration of the SLB setup. (C) TIRF images of mCherry-IRE1α LD-10His clustering on an SLB in the absence (left) and presence of 11% PEG. Scale bar = 5 µm. (D) Fusion events of mCherry-IRE1α LD-10His clusters on SLBs at the indicated time points. Scale bar = 5 µm, zoom in scale bar = 1 µm. Red circles display fusion of clusters. (E) FRAP images of mCherry-IRE1α LD-10His on SLBs in presence of 11% PEG within 300 s. Scale bar = 5 µm. Red circles indicate the photobleached cluster. (F) TIRF images displaying clustering of mCherry-IRE1α LD-10His tethered to SLBs via 1% Ni-NTA lipids in the presence of the indicated concentrations of PEG. Clustering is visible by the formation of fluorescent intense spots. Scale bar = 5 µm. (G) TIRF images displaying clustering of mCherry-IRE1α LD-10His in the presence of PEG and 10 µM model unfolded polypeptide ligand MPZ1N. Scale bar = 5 µm. (H) TIRF images displaying the phase diagram of mCherry-IRE1α LD-10His in the presence of PEG and 1 µM model unfolded polypeptide ligand MPZ1N-2X. Scale bar = 5 µm. (I) TIRF images displaying the phase diagram of mCherry-IRE1α LD-10His in the presence of the indicated concentrations of PEG and 1 µM control peptide MPZ1N-2X-RD. Scale bar = 5 µm.
Figure 2
Figure 2. IRE1α LD forms dynamic condensates in solution.
(A) DIC microscopy images showing IRE1α LD condensates imaged after 5 min (left) and 30 min incubation with PEG (50 µM IRE1 LD, 6% PEG). Scale bar for all images = 10 μm. (B) Fusion of IRE1α LD condensates imaged by DIC microscopy. The condensates were imaged after 30 min incubation with PEG at the indicated time points (50 µM IRE1 LD, 6% PEG). Scale bar = 10 μm. (C) FRAP curves showing normalized fluorescent recovery of IRE1α LD condensates after 30 min incubation with 6% PEG. IRE1α LD (25 µM IRE1 LD, 6% PEG) in the absence (black curve) and in the presence of MPZ1N peptide (1:1 stoichiometry, orange curve), in the presence of MPZ1N-2X peptide (2:1 stoichiometry, dark red curve), in the presence of MPZ1N-2X-RD peptide (2:1 stoichiometry, blue curve). Curve marks show the mean value, error bars display the standard deviation. n = 3 independent experiments were performed while 3 condensates were bleached each experiment. (D) DIC microscopy images displaying LLPS behavior of IRE1α LD alone (50 µM IRE1α LD, 5% PEG) (left) and IRE1α LD in complex with MPZ1N (1:1 stoichiometry), MPZ1N-2X (2:1 stoichiometry) and the control MPZ1N-2X-RD. Images were taken 30 min after induction of phase separation with PEG. Scale bar = 10 μm.
Figure 3
Figure 3. Disordered regions in IRE1α LD have potential to form clusters.
(A) Schematic description of DRs in IRE1α LD and boundaries of the core LD. The numbers correspond to the amino acid number at the domain boundaries. SS Signal sequence, DR disordered region. (B) IRE1α cLD dimeric structure based on the crystal structure of human IRE1α (pbd: 2hz6). The DRs that are not resolved in the structure are depicted by dashed lines. (C) Superposition of frames of an all-atom cLD simulation. Molecular dynamic simulations of IRE1α cLD shows flexibility of the DRs at 600 ns time scale. (D) Molecular Dynamics Simulations of 33 copies of DR2. These simulations reveal that DR2 forms clusters. (E) Molecular Dynamics Simulations of 33 copies of the linker region. These simulations reveal that the linker region forms clusters. (F) DIC images of IRE1α LD (left) and IRE1α cLD (right) reveal that IRE1α cLD is sufficient to form condensates. All images were obtained for 50 µM protein after incubation with 6% PEG for 30 min. Scale bar = 10 μm. (G) FRAP curve showing the time-dependent, normalized fluorescent recovery of 25 µM IRE1α LD (black) and IRE1α cLD (red) condensates after 30 min incubation with 6% PEG. Curve marks show the mean value, error bars display the standard deviation and the values are fitted to a one-phase association curve displaying a lower mobile fraction and longer half-life time for the IRE1α cLD condensates. n = 3 independent experiments were performed where 3 condensates were bleached each experiment.
Figure 4
Figure 4. Mutations in disordered segments in IRE1α LD impair phase separation.
(A) Schematic description of the mutations (1–8) introduced to IRE1α LD. SS Signal sequence, DR disordered region. (B) DIC images showing LLPS behavior of IRE1α LD wild type and the mutants at 50 µM after their incubation with 6% PEG for 5 min (left) and 30 min (right). Scale bar = 10 μm. (C) Analytical ultracentrifugation sedimentation velocity curves of 25 µM wild type IRE1α LD (top), IRE1α LD 312TLPL315-GSGS (middle) and IRE1α LD 352LNYL355-GSGS (bottom) mutants.
Figure 5
Figure 5. Membrane-tethering facilitates IRE1α LD self-assembly.
(A) Size distribution of mCherry-IRE1α LD-10His, 312TLPL315-GSGS, 352LNYL355-GSGS and D123P mutants on SLBs measured by mass photometry experiments. The lines and the dashed lines show experimental replicates at different protein concentrations coupled to SLBs. (B) Size distribution of mCherry-IRE1α LD-10His, 312TLPL315-GSGS, 352LNYL355-GSGS and D123P mutants in solution at 100 nM measured by mass photometry experiments. The lines and the dashed lines show experimental replicates protein concentration. (C) TIRF images of mCherry-IRE1α LD-10His and the 312TLPL315-GSGS, 352LNYL355-GSGS mutants on SLBs in the presence of 11% PEG at different protein concentrations (100–200 nM). Scale bar = 5 µm. (D) TIRF images of mCherry-IRE1α LD-10His and D123P mutant on SLBs in the presence of 11% PEG at 200 nM. Scale bar (SB) = 5 µm.
Figure 6
Figure 6. IRE1α LD DR mutants dysregulate its clustering and activity in vivo.
(A) Immunofluorescence images of MEFs treated with 400 nM doxycycline expressing IRE1α-mNG or its mutants in the absence (left panel) of stress and treated with 5 µg/ml ER stressor Tunicamycin for 4 h (right panel). IRE1α-mNG and its mutants are visualized by mNG fluorescence (green) and the ER-chaperone Calnexin is stained by anti-calnexin antibody (purple). Scale bar = 10 µm. (B) Semi-quantitative PCR reaction to monitor splicing of XBP1 mRNA by IRE1α-mNG and its mutants at different time points after induction of ER stress by addition of 5 µg/ml Tunicamycin. The expression of the IRE1α variants is induced by a 24-h treatment of MEFs with 400 nM doxycycline before induction of ER stress. The bands are indicated as unspliced and spliced XBP1 variants. (C) qRT-PCR to monitor splicing of XBP1 mRNA by IRE1α-mNG and its mutants at different time points after induction of ER stress by the addition of 5 µg/ml Tunicamycin. The expression of the IRE1α variants is induced by a 24-h treatment of MEFs with 400 nM doxycycline before induction of ER stress. Displayed are the values of n = 4 independent experiments resulting in the displayed P value. The P values were determined by the two-sided Student’s t test. The data are shown as box plots. The central line in the box plot marks the median and the cross shows the mean, the boxes mark the first and third quartiles and the whiskers display the maximum and the minimum points. (D) qRT-PCR to monitor splicing of XBP1 mRNA by IRE1α-mNG, the dimerization mutant (IRE1α-D123P-mNG) and the oligomerization mutant (IRE1α-WLLI-mNG) at different time points after induction of ER stress by the addition of 5 µg/ml Tunicamycin. The expression of the IRE1α variants is induced by a 24-h treatment of MEFs with 400 nM doxycycline before induction of ER stress. Shown are the values from n = 3 independent experiments resulting in the displayed P value. The P values were determined by a two-sided Student’s t test. The data are shown as box plots. The central line in the box plot marks the median and the cross shows the mean, the boxes mark the first and third quartiles and the whiskers display the maximum and the minimum points. (E) Model describing the role of DRs in IRE1α clustering. During ER stress, the ER-resident chaperone BiP is released from the DRs in IRE1α LD allowing these segments to self-associate through multivalent weak interactions. Concurrently, direct binding of misfolded proteins accumulating in the ER enhances the formation of dynamic IRE1α assemblies through additional multivalent interactions. These dynamic assemblies efficiently transition into stable IRE1α clusters with distinct signaling competent interfaces (light grey: dimerization interface, black: oligomerization interface) and conformation allowing for IRE1α trans-autophoshorylation and RNase activity.
Figure EV1
Figure EV1. Unfolded polypeptides induce clustering of human IRE1α LD on SLBs.
(A) TIRF images of FRAP experiments of Atto488 labeled DPPE lipids (top) and mCherry-IRE1α LD-10His (bottom) on SLBs showing the dynamic behavior within the indicated time. Scale bar = 5 µm. (B) FRAP curves of mCherry-IRE1α LD-10His tethered to SLBs by 1% Ni-NTA labeled lipids. The SLBs are incubated 10 min with the indicated concentration of the crowding agent PEG before the images are taken. The mobile fraction and diffusion values are decreasing with increasing PEG concentration. (C) FRAP curves displaying the fluorescent intensity of Atto488 labeled DPPE lipids within SLBs treated with the indicated concentration of the crowding agent PEG over time. (D) TIRF images displaying mCherry-10His control and the membrane (Atto488 DPPE) with and without PEG. Scale bar = 5 µm. (E) FRAP curves displaying the fluorescent intensity of Atto488 labeled DPPE lipids within SLBs treated with the indicated concentration of the crowding agent PEG over time. n = 3 independent experiments were performed to obtain the data for the FRAP curves. The error bars represent the standard deviation. (F) FRAP curves displaying the fluorescent intensity of mCherry-10His control on SLBs treated with the indicated concentration of the crowding agent PEG over time. n = 4 independent experiments were performed to obtain the data for the FRAP curves. The error bars represent the standard deviation. (G) TIRF images of mCherry-hIRE1α LD-10His tethered to SLBs by 1% Ni-NTA labeled lipids in the absence of PEG, in presence of 11% PEG and where PEG is washed out from the well. Scale bar = 5 µm. (H) Amino acid sequences of model unfolded polypeptides MPZ1N and MPZ1-N-2X and the control non-binding derivate MPZ1N-N-2X-RD. (I) Fluorescence anisotropy experiments monitor the interaction of N-terminal fluorescein labeled MPZ1N-2X and its derivative MPZ1N-2X-RD with IRE1α LD. MPZ1N-2X interacts with IRE1α LD at 2 µM affinity, whereas the MPZ1N-2X-RD is impaired in binding. n = 2 independent anisotropy experiments were performed to obtain the data for the curves. The error bars represent the standard deviation. (J) Diagram summarizing mCherry-IRE1α LD-10His clustering on SLBs in the presence of peptides at various PEG concentrations. “X” depicts no cluster and “O” cluster formation. (K) FRAP curves of mCherry-IRE1α LD-10His on SLBs in the absence (black curve) and presence of 10 µM MPZ1N (orange curve), 1 µM MPZ1N-2X (red curve) and 1 µM MPZ1N-2X-RD (blue curve) peptides. Curve marks show the mean value, error bars display the standard deviation and the values are fitted to a one-phase association curve. N = 3 independent experiments were performed. The error bars represent the standard deviation. (L) FRAP curves illustrate the mobility of Atto488 labeled DPPE lipids within the SLB belonging to the conditions in (K). The color code corresponds to the one used in (K). n = 3 independent experiments were performed to obtain the data for the FRAP curves. The error bars represent the standard deviation.
Figure EV2
Figure EV2. Unfolded polypeptide-binding stabilizes human IRE1α LD condensates.
(A) DIC images of IRE1α LD representing the phase diagram of IRE1α LD. Scale bar = 10 µm. (B) Schematic phase diagram of IRE1α LD condensates at 12.5, 25 and 50 µM at 30 min incubation with 4–9% PEG as in (A). No phase separation (PS) is indicated by a cross and phase separation (PS) is indicated by a circle. The smaller circle refers to condensates with diameter <1 µm. (C) DIC images of 100 µM IRE1α LD in the presence of 5% PEG (top) or 17% Ficoll 400. Scale bar = 10 μm. (D) DIC images of 50 µM IRE1α LD incubated with 6% PEG for 30 min. The images are obtained at the bottom or top of the well. Scale bar = 10 μm. (E) Fluorescence images of 25 µM mCherry-10His control, mCherry-IRE1α LD-10His and the dimerization mutant of IRE1α LD, mCherry-IRE1α LDD123P-10His after 30 min incubation with 6% PEG. Scale bar = 10 µm. (F) Confocal (left) and bright field (right) images displaying the recruitment of Fluorescein-labeled MPZ1N-2X (red) peptide into preformed IRE1α LD condensates. Scale bar = 13 μm. (G) Confocal (left) and bright field (right) images displaying the recruitment of Fluorescein-labeled MPZ1N-2X-RD (blue) peptides into preformed IRE1α LD condensates. Scale bar = 13 μm. (H) DIC microscopy images of 50 µM IRE1α LD incubated with MPZ1N (2:1 stoichiometry, left), MPZ1N-2X (4:1 stoichiometry, middle) or MPZ1N-2X-RD (4:1 stoichiometry, right panel) at 30 min after induction of phase separation with 5% PEG. Scale bar = 10 μm. (I) DIC microscopy images of 25 µM mCherry-IRE1α LD (top) or mCherry-IRE1α LDD123P in the presence of 5% PEG and MPZ1N peptide at 1:1 and 1:2 molar ratio. Scale bar = 10 μm. (J) DIC images of 25 µM MPZ1N-2X peptide in the presence of 6% PEG. Scale bar = 10 μm. (K) DIC images of 50 µM MPZ1N peptide in the presence of 6% PEG. Scale bar = 10 μm. (L) FRAP images of a single IRE1α LD condensate in absence and presence of the model unfolded peptides at the indicated stoichiometry taken before and at the indicated time points after photobleaching. Scale bar = 5 µm. (M) FRAP curves of 25 µM IRE1α LD and 6% PEG in the absence (black curve) and in the presence of MPZ1N peptide (2:1 stoichiometry, light orange curve, 1:1 stoichiometry orange curve), MPZ1N-2X peptide (4:1 stoichiometry, red, 2:1 stoichiometry dark red) and MPZ1N-2X-RD control peptide (4:1 stoichiometry, light blue, 2:1 stoichiometry blue). n = 9 condensates in 3 independent experiments were performed to obtain the data for the FRAP curves.
Figure EV3
Figure EV3. Human IRE1α cLD forms rigid condensates.
(A) DIC Images of IRE1α cLD representing the phase diagram at 12.5, 25 and 50 µM acquired after 30 min incubation with PEG at concentrations ranging from 4 – 9%. Scale bar = 10 µm. (B) Phase diagram of IRE1α cLD based on images in (A). No phase separation (PS) is indicated by a cross, phase separation (PS) is indicated by a circle and condensates that resemble beads on a string are represented by a black circle (bundles). The smaller circle refers to smaller condensates (diameter < 1 µm). (C) DIC images of IRE1α cLD (left) and IRE1α LD (right), the condensates that fail to fuse are shown with red arrows. Scale bar = 10 μm. (D) DIC images of the bottom of the well of IRE1α cLD (50 µM) condensates taken 60 min after induction of phase separation via addition of 6% PEG showing the phase separation propensity and wetting effect. Scale bar = 10 μm. (E) Fluorescence images of 25 µM IRE1α LD (top) or IRE1α cLD (bottom) condensates at the indicated time points after 30 min incubation with 6% PEG following the recruitment of 2% mCherry labeled IRE1α LD or cLD, respectively. mCherry-IRE1α LD-10His is recruited to the center of preformed IRE1α LD condensates, whereas mCherry-IRE1α cLD-10His could only associate with the outer shell of the preformed IRE1α cLD condensates. Scale bar = 5 µm.
Figure EV4
Figure EV4. Mutagenesis analyses reveal the critical role of the DRs in IRE1α LD clustering.
(A) DIC images of 25 µM WT IRE1α LD and IRE1α LD 320QTDG323-GSGS mutant showing LLPS behavior 30 min after induction of phase separation by the addition of 6% PEG. (B) DIC images of 25 µM WT IRE1α cLD and IRE1α cLD 346LKSK349-GSGS mutant showing LLPS behavior 30 min after induction of phase separation by the addition of 6% PEG. (C) DIC images of 50 µM WT IRE1α cLD and IRE1α cLD 354YLR356-GSG mutant showing LLPS behavior 30 min after induction of phase separation by the addition of 5% PEG. (D) DIC images comparing the LLPS behavior of WT IRE1α LD (left column) and IRE1α LD 359WLLI323-GSGS mutant (right column) 30 min after induction of phase separation at 50 µM protein concentration and 5% PEG (top row) at 25 µM protein concentration and 6% PEG (middle row) and at 50 µM protein concentration and 6% PEG (bottom row). Scale bar for all images = 10 μm. (E) TIRF images of mCherry-IRE1α LD-10His (top) and the mCherry tagged mutants 352LNYL355-GSGS (middle) and 312TLPL315-GSGS (bottom) tethered to SLBs by 1% Ni-NTA labeled lipids at concentrations between 100 – 200 nM displaying an evenly distributed fluorescent signal at all concentrations. Scale bar = 5 µm. (F) FRAP curves of mCherry-IRE1α LD-10His, the mCherry tagged mutants 352LNYL355-GSGS and 312TLPL315-GSGS and mCherry control tethered to SLBs by 1% Ni-NTA labeled lipids at a concentration of 200 nM. Curve marks show the mean value, error bars display the standard deviation. n = 4 independent experiments were performed. (G) FRAP curves of Atto488 labeled DPPE lipids within SLBs belonging to the tethered proteins in (E). (H) Intensity plot analyses of the mCherry signal in the TIRF images in Fig. 5C for mCherry-IRE1α LD-10His at 100 (top), 150 (middle) and 200 nM (bottom) in the absence (3 lines, colored) and in the presence of 11% PEG (9 lines from three different field of views on the same membrane, black). (I) Intensity plot analyses of the mCherry signal in the TIRF images in Fig. 5C for mCherry-312TLPL315-GSGS-10His similarly displayed as in (H). (J) Intensity plot analyses of the mCherry signal in the TIRF images in Fig. 5C for mCherry-3352LNYL355-GSGS-10His similarly displayed as in (H). (K) Intensity plot analyses of the mCherry signal in the TIRF images in Fig. 5D for mCherry-D123P-10His at 200 nM in the absence (3 lines, blue) and in the presence of 11% PEG (9 lines from three different field of views on the same membrane, black).
Figure EV5
Figure EV5. IRE1α LD DR mutants display impaired IRE1α clustering and activity in vivo.
(A) Immunofluorescence images of MEFs treated with 100 nM doxycycline to induce expression of IRE1α-mNG and the IRE1α cLD-mNG mutant in the absence (top row) of stress and treated with 5 µg/ml ER stressor Tunicamycin for 4 h (bottom row). IRE1α-mNG and its mutants are visualized by mNG fluorescence (green). Scale bar = 10 µm. (B) qRT-PCR to monitor splicing of XBP1 mRNA by IRE1α-mNG and its mutants at different time points after induction of ER stress by addition of 5 µg/ml Tunicamycin. Cells are treated with 25 nM doxycycline for 24 h to induce expression of IRE1α-mNG and its mutants. Displayed are the values of n = 3 independent experiments and the P value. The P values were determined by a two-sided Student’s t-test. The data are shown as box plots. The central line in the box plot marks the median and the cross shows the mean, the boxes mark the first and third quartiles and the whiskers display the maximum and the minimum points. (C) Immunofluorescence images of MEFs treated with 400 nM doxycycline expressing IRE1α-mNG or its mutants in the absence (left panel) of stress and treated with 5 µg/ml Tunicamycin for 4 h (right panel). IRE1α-mNG and its mutants are visualized by mNG fluorescence (green) and the ER-chaperone Calnexin is stained by anti-calnexin antibody (purple). Scale bar = 10 µm. (D) qRT-PCR to monitor splicing of XBP1 mRNA by IRE1α-mNG and its mutants at different time points after induction of ER stress by addition of 5 µg/ml Tunicamycin. Cells are treated with 25 nM doxycycline for 24 h to induce expression of IRE1α-mNG and its mutants. Displayed are the values of n = 3 independent experiments and the P value. The P values were determined by a two-sided Student’s t test. The data are shown as box plots. The central line in the box plot marks the median and the cross shows the mean, the boxes mark the first and third quartiles and the whiskers display the maximum and the minimum points. (E) qRT-PCR to monitor CHOP mRNA levels in cells expressing IRE1α-mNG and its mutants (400 nM doxycycline) at different time points after induction of ER stress by addition of 5 µg/ml Tunicamycin. Displayed are the values of n = 4 independent experiments.

References

    1. Acosta-Alvear D, Zhou Y, Blais A, Tsikitis M, Lents NH, Arias C, Lennon CJ, Kluger Y, Dynlacht BD (2007) XBP1 controls diverse cell type- and condition-specific transcriptional regulatory networks. Mol Cell 27(1):53–66 - PubMed
    1. Alberti S, Dormann D (2019) Liquid-liquid phase separation in disease. Annu Rev Genet 53:171–194 - PubMed
    1. Alberti S, Hyman AA (2021) Biomolecular condensates at the nexus of cellular stress, protein aggregation disease and ageing. Nat Rev Mol Cell Biol 22(3):196–213 - PubMed
    1. Amin-Wetzel N, Neidhardt L, Yan Y, Mayer MP, Ron D (2019) Unstructured regions in IRE1alpha specify BiP-mediated destabilisation of the luminal domain dimer and repression of the UPR. eLife 8:e50793 - PMC - PubMed
    1. Amin-Wetzel N, Saunders RA, Kamphuis MJ, Rato C, Preissler S, Harding HP, Ron D (2017) A J-protein co-chaperone recruits BiP to monomerize IRE1 and repress the unfolded protein response. Cell 171(7):1625–1637.e1613 - PMC - PubMed

MeSH terms

Substances

LinkOut - more resources