. 2024 Sep;3(9):1035-1048.
doi: 10.1038/s44161-024-00522-z. Epub 2024 Sep 4.

Endothelial γ-protocadherins inhibit KLF2 and KLF4 to promote atherosclerosis

Affiliations

Endothelial γ-protocadherins inhibit KLF2 and KLF4 to promote atherosclerosis

Divyesh Joshi et al. Nat Cardiovasc Res. 2024 Sep.

Abstract

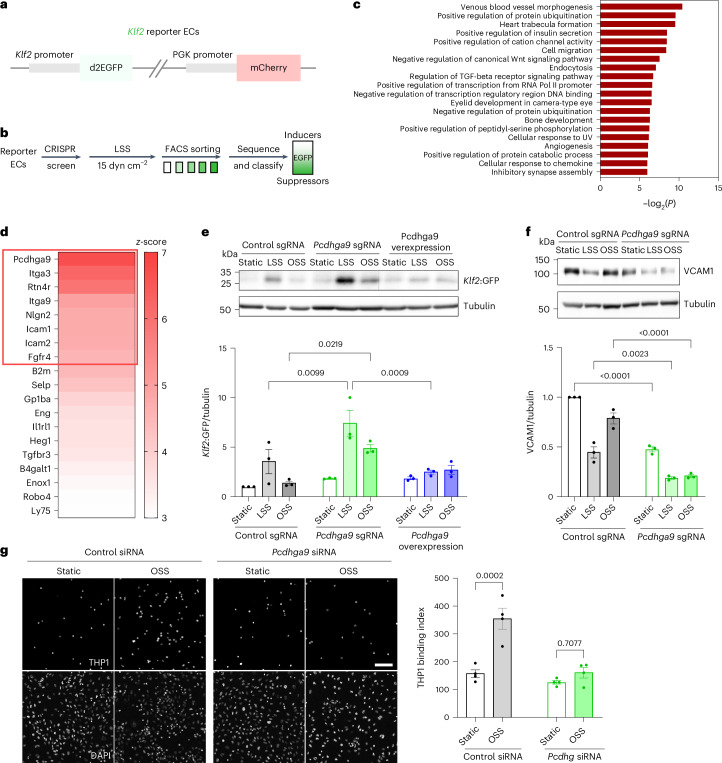
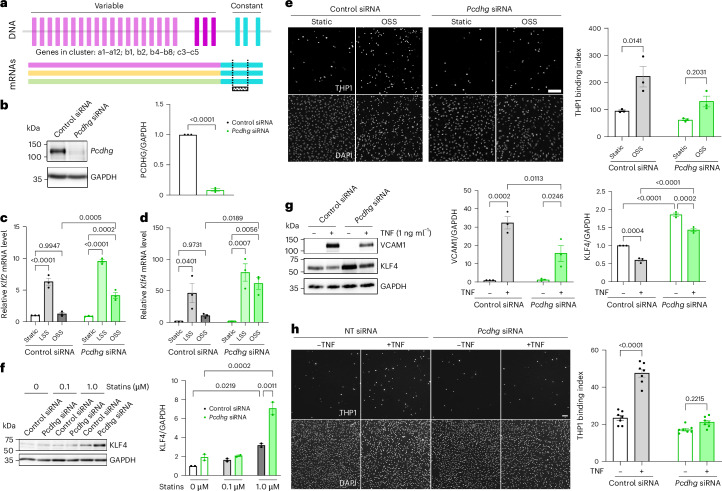
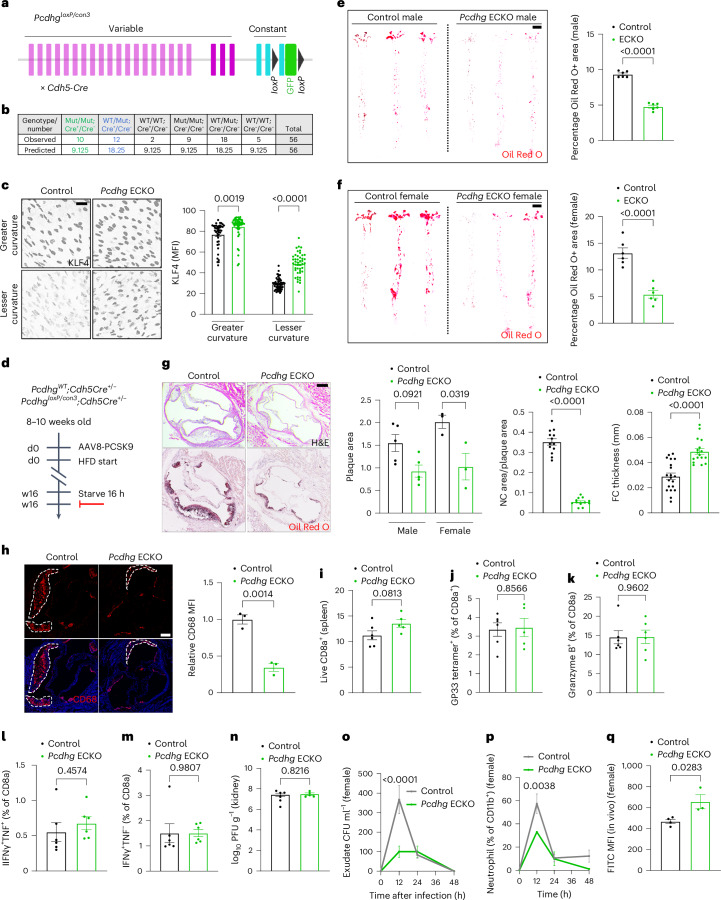
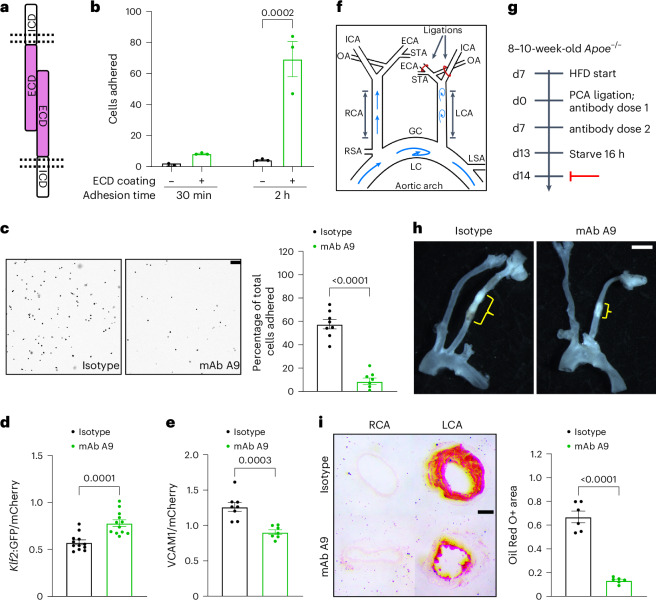
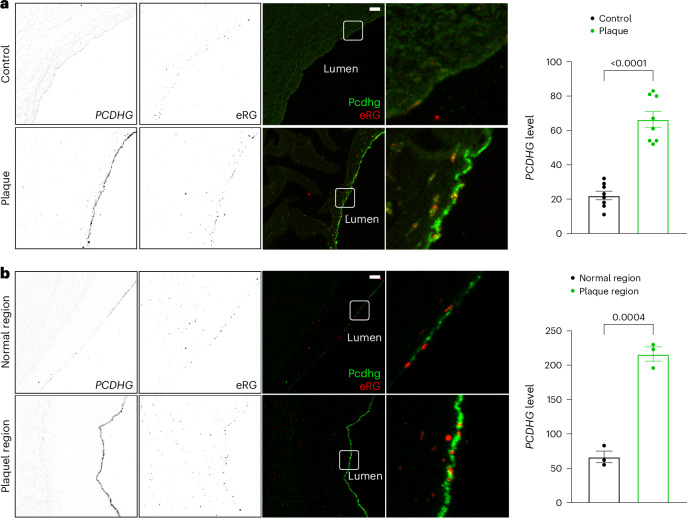
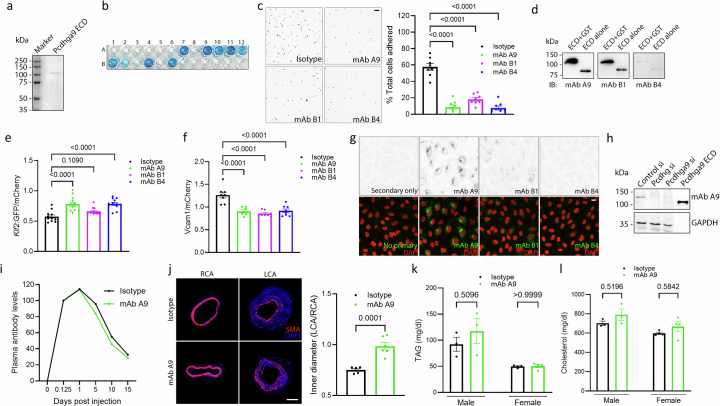
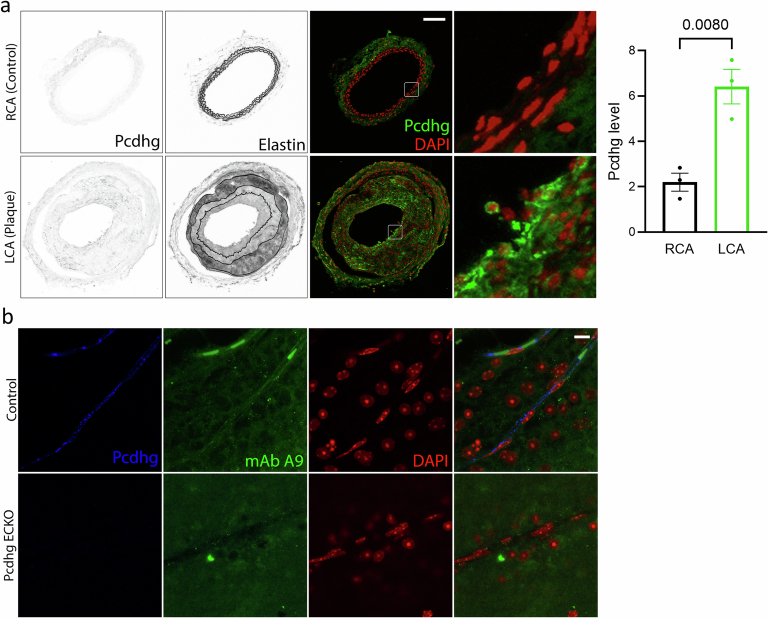
Atherosclerotic cardiovascular disease (ASCVD) is the leading cause of mortality worldwide. Laminar shear stress from blood flow, sensed by vascular endothelial cells, protects from ASCVD by upregulating the transcription factors KLF2 and KLF4, which induces an anti-inflammatory program that promotes vascular resilience. Here we identify clustered γ-protocadherins as therapeutically targetable, potent KLF2 and KLF4 suppressors whose upregulation contributes to ASCVD. Mechanistic studies show that γ-protocadherin cleavage results in translocation of the conserved intracellular domain to the nucleus where it physically associates with and suppresses signaling by the Notch intracellular domain. γ-Protocadherins are elevated in human ASCVD endothelium; their genetic deletion or antibody blockade protects from ASCVD in mice without detectably compromising host defense against bacterial or viral infection. These results elucidate a fundamental mechanism of vascular inflammation and reveal a method to target the endothelium rather than the immune system as a protective strategy in ASCVD.


Conflict of interest statement

M.A.S. and D.J. are listed as inventors in a US Provisional Patent Application no. 63/621,466 filed by Yale University for inhibitors of Pcdhga9. The other authors declare no competing interests.

Figures

Fig. 1
Fig. 1. A genome-wide CRISPR screen identifies KLF2 suppressors.
a, Schematic of the Klf2 reporter stably expressed in MAECs (Klf2:GFP reporter). Short-lived enhanced GFP is driven by the Klf2 promoter while mCherry is driven by a constitutive PGK promoter as an internal control. b, Schematic of the genome-wide CRISPR screen to identify modifiers (activators and suppressors) of KLF2 induction under LSS (15 dyn cm2 LSS for 18 h). c, Functional categorization of the candidate KLF2 suppressors (cumulative z-score greater than 4, 160 hits) using ingenuity pathway analysis (QIAGEN). d, Candidate suppressors intersecting with ‘cell-surface exposed proteins on outer plasma membrane’ Gene Ontology term to identify candidates amenable to function neutralization by blocking antibodies (red box: validated hits). e, Klf2:GFP reporter MAECs were transduced with Cas9 plus control sgRNA, PCDHGA9 sgRNA or with a human PCDHGA9 (Hs Pcdhga9) vector. Cells were exposed to static, LSS or OSS for 16 h and immunoblotted for Klf2:GFP (n = 3 independent experiments). Graph: quantitation of Klf2:GFP normalized to tubulin loading control. f, Immunoblot for the inflammatory marker VCAM1 in control or PCDHGA9-depleted MAECs exposed to Static, LSS or OSS (n = 3 independent experiments). Graph: quantitation of VCAM1 normalized to tubulin loading control. g, THP1 monocyte binding to control siRNA or PCDHGA9 siRNA HUVECs exposed to static or OSS for 16 h (n = 4 independent experiments, mean value per experiment). Graph: quantitation of bound THP1 monocytes per field (THP1 binding index). Values are shown as the mean ± s.e.m. Statistical analysis was carried out using a one-way analysis of variance (ANOVA). Scale bar, 100 μm.
Fig. 2
Fig. 2. Pcdhg gene cluster suppresses KLF2 and KLF4.
a, Top, schematic of Pcdhg gene cluster organization consisting of 22 genes with their unique and variable first exon (and individual promoter, not shown) and three common and constant 3′ exons that form the common cytoplasmic domain. Bottom, strategy for silencing (knocking down) the entire Pcdhg gene cluster with an siRNA targeting the common region (shaded bar and dashed lines). b, Validation of siRNA-mediated knockdown of the entire Pcdhg gene cluster (22 genes) in HUVECs by immunoblot with an antibody to the common cytoplasmic domain (n = 3 independent experiments). Right, quantitation of PCDHG levels normalized to glyceraldehyde 3-phosphate dehydrogenase (GAPDH) loading control. c,d, Quantitative PCR with reverse transcription (RT–qPCR) for Klf2 (c) and Klf4 (d) in control and PCDHG-depleted HUVECs exposed to static, LSS and OSS for 16 h (n = 3 independent experiments). e, THP1 monocyte binding to control siRNA or Pcdhg siRNA HUVECs exposed to static or OSS for 16 h (n = 3 independent experiments, mean value per experiment). Right, quantitation of THP1 monocytes per field per condition (THP1 binding index). f, Left, immunoblot for KLF4 in control siRNA or PCDHG siRNA HUVECs, treated with lovastatin (0, 0.1 or 1.0 μM) for 16 h (n = 2 independent experiments). Right, quantitation of KLF4 normalized to GAPDH loading control. g, Left, immunoblot for VCAM1 and KLF4 in control siRNA or PCDHG siRNA HUVECs, untreated or treated with TNF (1 ng ml−1) for 16 h (n = 3 independent experiments). Middle and right, quantitation of VCAM1 and KLF4 normalized to GAPDH loading control with or without TNF. h, THP1 monocyte binding to control siRNA or PCDHG siRNA HUVECs untreated or treated with TNF (1 ng ml−1) for 16 h (n = 7 images across three independent experiments). Right, quantitation of THP1 monocytes per field per condition. Values are shown as the mean ± s.e.m. Statistical analysis was carried out using a one-way ANOVA. Scale bars, 100 μm (e), 250 μm (h).
Fig. 3
Fig. 3. Pcdhg endothelial KO protects against atherosclerosis.
a, Schematic showing the PcdhgloxP/con3 mouse line, and generation of ECKO by crossing PcdhgloxP/con3 with Cdh5-Cre. The third constant exon was tagged with GFP and floxed. Cre-mediated recombination excises this exon, creating a premature stop codon leading to nonsense-mediated decay. b, Analysis of progeny genotype showing Pcdhg ECKO at the expected Mendelian ratio. c, Aortic arch from control or Pcdhg ECKO adult mice immunostained for KLF4 and examined en face (mean fluorescence intensity (MFI) per nucleus from n = 3 animals). Greater curvature denotes the region of laminar shear while lesser curvature denotes a region of low, disturbed shear. Right, quantitation of the MFI per cell. d, Schematic of the atherosclerosis study: 8–10-week-old control or Pcdhg ECKO mice were injected with AAV8-PCSK9 and maintained on an HFD for 16 weeks, starved overnight and analyzed for blood lipids and vessel histology. e,f, Whole aortas were stained with Oil Red O to mark lipid-rich regions and imaged en face (n = 6 animals for each sex). Right, quantitation of percentage Oil Red O+ area for males (e) and females (f). g, Sections from aortic roots were stained with H&E (n = 5 animals) or Oil Red O (n = 5 animals). Right, quantitation of atherosclerotic plaque area (per animal), NC area (per plaque) and FC thickness (per plaque). h, Atherosclerotic plaques (dotted area) in aortic root sections were stained for the macrophage and monocyte marker CD68 (n = 3). Right, quantitation of CD68 MFI. in, Immune function in control or Pcdhg ECKO tested according to infection with LCMV clone 13 and measuring spleen cell readouts and function (n = 6 animals). Percentage of live CD8a+ cells on day 7 after infection (i), GP33 tetramer+ CD8a cells (j), granzyme B+ CD8a cells (k), IFNγ+TNF+ (l) or IFNγ+TNF (m) CD8a cells after restimulation with LCMV-specific GP33 peptide and viral loads in kidneys (n). oq, Response in control or Pcdhg ECKO to intraperitoneally injected E. coli by measuring CFUs (o), neutrophil numbers (percentage of CD11b+) (p) and phagocytic function (q) in the peritoneal exudates at the indicated times after infection (n = 3–4 animals). Values are shown as the mean ± s.e.m. Statistical analysis was carried out using an unpaired two-tailed Student’s t-test (eg (middle adn right graphs) and h,in), one-way ANOVA (c,g, left graph) or two-way ANOVA with Bonferroni’s multiple comparisons test (oq). Scale bars, 50 μm (c), 500 μm (e,f), 200 μm (g,h).
Fig. 4
Fig. 4. A physical and functional PCDHG–Notch axis regulates KLF2 and KLF4.
a, Gene organization of the Pcdhg cluster with the three 3′ exons (blue) coding for the CCD shared by all 22 members, and mutant construct design. b,c, HUVECs transfected with the indicated constructs (GFP tagged for b and Flag tagged for c) and treated with LSS for 16 h. Left, immunoblotting confirmed expression of mutants and the effects on endogenous KLF4 (n = 2–3 independent experiments). Right, quantitation of KLF4 normalized to GAPDH loading control. The mutants were expressed at comparable levels (GFP, FLAG immunoblots). Full, Full length; ΔCCD, deleted CCD; ICD, VCD + CCD; ΔNLS, deleted NLS. d, Schematic of bulk RNA-seq analysis of control siRNA, Pcdhg siRNA and Pcdhg+Klf2 and Klf4 triple siRNA HUVECs to identify Pcdhg-dependent and Klf2 and Klf4-independent DEGs (green shaded area). e, Immunoblot validation of Pcdhg and Klf4 depletion (n = 3 independent experiments). f, Upstream regulatory pathway and process analysis from the DEGs using Enrichr. g, Heatmap of upregulated Notch target genes in Pcdhg siRNA and Pcdhg siRNA + Klf2 and Klf4 siRNA compared to control siRNA from the RNA-seq analysis. h, Top, control siRNA or Pcdhg siRNA HUVECs were exposed to static or LSS for 2 h and immunoblotted for the cleaved NICD (Val1744) (n = 3 independent experiments). Bottom, quantitation of NICD Val1744 normalized to GAPDH loading control. i, NICD-dependent transcription was blocked with RIN1, a pharmacological inhibitor of Notch-RBPJ interaction (RBPJi) or with RBPJ siRNA. Top, HUVECs were exposed to LSS for 16 h and immunoblotted for KLF4 (n = 3 independent experiments). Bottom, quantitation of KLF4 normalized to GAPDH loading control. j, Schematic showing Notch1. The asterisks show the NICD peptides identified in the mass spectrometry analysis of the IPs of full but not the ΔCCD Pcdhg mutant. k,l, Co-immunoprecipitation of Pcdhg and NICD Val1744. Inputs were used as loading controls for IPs. k, HUVECs expressing full or ΔCCD Pcdhg (C terminus, GFP-tagged) were immunoprecipitated with GFP nanobody beads and immunoblotted for NICD Val1744 (n = 3). Vector alone was used as negative control for the immunoprecipitation. l, HUVECs expressing CCD or ΔNLS-CCD mutant (C terminus, FLAG-tagged) were immunoprecipitated with FLAG antibody beads and immunoblotted for NICD Val1744 (n = 3). m, Top, Notch transcriptional reporter in cells cotransfected with NICD-V5 and PICD-FLAG, as indicated. Bottom, quantitation of Notch activity reporter (GFP) normalized to GAPDH loading control (n = 3 independent experiments). Values are shown as the mean ± s.e.m. Statistical analysis was carried out using a one-way ANOVA. *P < 0.05, **P < 0.01, ***P < 0.001, ****P < 0.0001.
Fig. 5
Fig. 5. PCDHGA9 blocking antibody in experimental atherosclerosis.
a, Schematic of homophilic adhesion assay and function-blocking mAb generation from PCDHGA9 ECD. b, PCDHGA9 ECD was immobilized in 96 wells and the percentage of MAECs that adhered was measured (n = 3 independent experiments, mean value per experiment). c, Left, adhesion of MAECs to ECD in the presence of isotype control or function-blocking mAb A9 (n = 8 images from four independent experiments). Right, quantitation of percentage total cells adhered to the ECD. d,e, Klf2:GFP reporter MAECs with isotype control or mAb A9 tested for d. Klf2:GFP expression after 16-h LSS (n = 12 images across three independent experiments) or e immunostained for VCAM1 after 16-h OSS (n = 7–8 images across three independent experiments). Quantitation of Klf2:GFP and VCAM1 levels normalized to the mCherry internal control. f, Schematic of the partial carotid artery (PCA) ligation model of accelerated atherosclerosis. ECA, external carotid artery; ICA, internal carotid artery; LSA, left subclavian artery; RSA, right subclavian artery; STA, superficial temporal artery g, Experimental design. Antibodies were administered via intraperitoneal injection into in Apoe−/− mice. h, Whole-mount brightfield image showing the branching of the LCA and RCA from the aorta, with atherosclerotic plaque (yellow brackets) visible in the ligated LCA. i, Left, LCA and RCA sections were stained with Oil Red O to identify lipid-rich atherosclerotic plaques (n = 6). Right, quantitation of Oil Red O+ area fraction. Values are shown as the mean ± s.e.m. Statistical analysis was carried out using a one-way ANOVA (b) or an unpaired two-tailed Student’s t-test (ce,i). Scale bars, 100 μm (c,i), 1 mm (h). *P < 0.05, **P < 0.01, ***P < 0.001, ****P < 0.0001.
Fig. 6
Fig. 6. PCDHG in human atherosclerosis.
a, Left, artery sections from patients with CVD and healthy controls stained for PCDHG and for eRG to mark ECs (n = 8). Right, quantitation of PCDHG level in ECs. b, Left, human coronary artery sections from older donors stained for PCDHG levels, comparing the plaque region to segments of the same artery without evident plaque (normal region). Sections were stained for Erg to mark ECs (n = 3). Right, quantitation of PCDHG staining intensity in ECs. Values are shown as the mean ± s.e.m. Statistical analysis used an unpaired two-tailed Student’s t-test. Scale bars, 50 μm. *P < 0.05, **P < 0.01, ***P < 0.001, NS (not significant) > 0.05.
Extended Data Fig. 1
Extended Data Fig. 1. Validation of Klf2 reporter.
(a) Immunoblot validation of LSS-mediated induction of Klf2:GFP in reporter MAECs; reporter is also sensitive to statin treatment, another potent inducer of Klf2 used as a positive control (N = 3 independent experiments). (b) Rank-ordered candidate suppressors from the CRISPR screen to identify Klf2 modifiers (z < 4 gray, z > 4 blue), with validated cell-surface exposed candidates which are amenable to function neutralization marked in red, and known positive controls, Ccm2 and Pdcd10, marked in black. (c) qRT-PCR validation of siRNA mediated knockdown of Pcdhga9 in MAECs (Pcdhga9 si) (N = 3 independent experiments). (d) Immunoblot validation of human Pcdhga9-FLAG overexpression (Hs Pcdhga9 OE) in MAECs (N = 3 independent experiments). (e) Control si and Pcdhga9 si Klf2 reporter MAECs were exposed to static (St), LSS, or oscillatory shear stress (OSS) for 16 h and immunoblotted for Klf2:GFP (N = 3 independent experiments). (f) qRT-PCR for endogenous Klf2 levels in Control si and Pcdhga9 si in Human Umbilical Vein Endothelial Cells (HUVECs) exposed to St or OSS for 16 h (N = 3 independent experiments). Values are means ± SEM. Statistical analysis used one-way ANOVA.
Extended Data Fig. 2
Extended Data Fig. 2. Protocadherin gamma (Pcdhg) gene cluster promotes inflammatory signaling.
(a) Validation of siRNA mediated knockdown of Pcdhg gene cluster in HUVECs using two different siRNAs targeting the common region in the 3′ end, by qRT-PCR for Pcdhgc3, the highest expressed Pcdhg member in HUVECs (N = 3 independent experiments). (b) qRT-PCR for the OSS induced pro-inflammatory marker E-selectin (Sele) in control and Pcdhg depleted HUVECs exposed to St, LSS and OSS for 16 h (N = 3 independent experiments). (c) Immunoblot for VCAM1 in Control si or Pcdhg si HUVECs, after treatment with indicated doses of TNFα for 16 h (N = 3 independent experiments). Graph: quantitation of VCAM1 normalized to Tubulin loading control. Values are means ± SEM. Statistical analysis used one-way ANOVA.
Extended Data Fig. 3
Extended Data Fig. 3. Validation and blood lipid analysis of Pcdhg ECKO mouse.
(a) Generation of Pcdhg endothelial knockout (ECKO) by crossing Pcdhgfcon3 with Cdh5Cre, and confirmation by genotyping PCR. wt: wild type for Pcdhg allele; flox: Pcdhg floxed; Cre: Cdh5Cre (N > 10 animals). (b, c) Analysis of progeny genotype showing no significant deviation from Mendelian ratio as tested by Chi-squared analysis. (d–g) Plasma triglycerides, cholesterol, HDL-C and body weights of male and female Control or Pcdhg ECKO mice injected with pCSK9-Adeno Associated Virus 8 (AAV8) and maintained on High Fat Diet (HFD) for 16 weeks, starved overnight before analysis (N = 5). Values are means ± SEM. Statistical analysis was carried out using one-way ANOVA.
Extended Data Fig. 4
Extended Data Fig. 4. Pcdhg ECKO does not affect immune function.
(a-c) Mice were infected with Lymphocytic Choriomeningitis Virus (LCMV) Clone 13 and spleen myeloid cell frequency measured on Day 7 post infection (N = 6 animals). Graphs: (a) percentages of live CD11b+ or CD11c + CD11b- non T/B-cells; (b) monocyte (Ly6c + Ly6g-) and neutrophil/granulocyte (Ly6c + Ly6g + ) population of the CD11b+ cells; (c) subsets of CD11b+ cells, as indicated. (d-i) Immune response in Control or Pcdhg ECKO to intraperitoneally injected E. coli by measuring CFUs (d) and representative LB agar plates showing CFUs in males (e), CFUs in blood (f), flow cytometry quantification of neutrophils (CD45+CD11b+F4/80Ly6CLy6G+) and monocytes (CD45+CD11b+F4/80Ly6GLy6C+), and macrophages (CD45+CD11b+F4/80+) numbers (g, h) and cell numbers in peritoneal exudate (i) (N = 3). (j, k) Phagocytic function in the peritoneal exudates at 12 h post infection (N = 3). (l) Phagocytic function of bone marrow neutrophils from uninfected Control or Pcdhg ECKO (j) (N = 4). Values are means ± SEM. Statistical analysis was carried out using unpaired two-tailed Student’s t-test (a-c, j, l) or two-way ANOVA (d, i, h).
Extended Data Fig. 5
Extended Data Fig. 5. Conserved nuclear ICD region of Pcdhg associates with Notch ICD and is necessary and sufficient for function.
(a) Pcdhg mutants were expressed in HUVECs which were treated with Static, LSS or OSS and immunoblotted for GFP, Klf4 and GAPDH (N = 3 independent experiments). (b) GFP was imaged in HUVECs expressing the above mutants (N = 3 independent experiments). (c) HUVECs expressing additional mutants (C-terminal FLAG-tagged) were immunostained for FLAG and counterstained with DAPI to mark nuclei (N = 3 independent experiments). (d) Multiple sequence alignment to test domain homology domains, using Pcdhga9 as an example, showing near-complete conservation in CCDs (highlighted in yellow). Percent conservation shown in the box. (e) RBPJ-Notch DNA-binding consensus motif. (f) RBPJ-Notch binding motifs in mouse and human Klf2 and Klf4 promoters. (g) NICD peptides detected in proteomic analysis of the IPs of full but not the ΔCCD Pcdhg mutant. Scale bar: (b, c) 20 μm.
Extended Data Fig. 6
Extended Data Fig. 6. Pcdhga9 blocking antibody generation and validation.
(a) Pcdhga9 ECD (ECD-FLAG-TEV-GST) protein run on a 10% Polyacrylamide SDS gel and visualized using Imperial Protein stain (Thermo Scientific) (N = 3 independent experiments). (b) ELISA for the 24 selected high affinity monoclonal antibody (mAb) from clones labeled as A1-12 and B1-12 using ECD alone (GST cleaved off using TEV protease). (c) Adhesion of MAECs to ECD in the presence of Isotype control or mAbs A9, B1 and B4 (N = 8 images across 4 independent experiments). Graph: quantitation of percent total cells adhered to ECD. (d) Immunoblot with mAbs A9, B1, B4 shows detection of both ECD-FLAG-TEV-GST and ECD-FLAG (N = 3 independent experiments). (e, f) Klf2:GFP reporter MAECs tested for Klf2:GFP reporter expression after 16 h LSS (N = 12 images across 3 independent experiments) (e) or immunostained for VCAM1 when exposed to OSS for 16 h OSS (N = 7-8 images across 3 independent experiments) (f), in the presence of Isotype control or mAbs A9, B1 and B4 as indicated. Graphs: quantitation of Klf2:GFP and VCAM1 levels normalized to mCherry internal control. (g) Immunofluorescence with mAbs A9, B1, B4 showing highest signal from A9. (h) Immunoblot of Pcdhg knockdown cells with mAb A9. Purified ECD used as positive control. (i) Antibody half-life in vivo. A single dose of 1 μg of Isotype control or mAb A9 antibody was administered IP, and plasma levels of antibody were measured using an ELISA as described in Methods. mAb levels at 3 h post injection were considered 100%. (j) LCA and RCA sections were stained for smooth muscle specific Acta2 (SMA) for marking plaque neointima (N = 6). Graph: quantitation of the LCA to RCA inner diameter. (k, l) Plasma triglycerides and cholesterol in Isotype control or mAb A9 injected male and female Apoe−/− mice on HFD from Fig. 5h, i (N = 6). Values are means ± SEM. Statistical analysis was carried out using unpaired two-tailed Student’s t-test (j) or one-way ANOVA (c, e, f, k, l). Scale bar: (c) 100 μm, (g) 20 μm, (j) 100 μm.
Extended Data Fig. 7
Extended Data Fig. 7. Pcdhg level correlates with atherosclerosis.
(a) Mouse carotids from the Partial Carotid Artery (PCA) Ligation model of accelerated atherosclerosis stained for Pcdhg and counter stained with DAPI to mark nuclei (N = 3 animals). RCA: Right Carotid Artery (control), LCA: Left Carotid Artery (atherosclerotic plaque. Graph: quantitation of Pcdhg staining intensity. (b) Commercial Pcdhg antibody and mAb A9 staining of retinal vasculature from Control and Pcdhg ECKO mouse (N = 3 animals). mAb A9 is specific to mouse Pcdhga9 and Pcdhg antibody targets the conserved region in 22 Pcdhg genes, also conserved between mouse and human. Values are means ± SEM. Statistical analysis was carried out using unpaired two-tailed Student’s t-test. Scale bar: (a) 100 μm, (b) 10 μm.

Update of

References

    1. Baeyens, N. et al. Defective fluid shear stress mechanotransduction mediates hereditary hemorrhagic telangiectasia. J. Cell Biol.214, 807–816 (2016). 10.1083/jcb.201603106 - DOI - PMC - PubMed
    1. Kwak, B. R. et al. Biomechanical factors in atherosclerosis: mechanisms and clinical implications. Eur. Heart J.35, 3013–3020 (2014). 10.1093/eurheartj/ehu353 - DOI - PMC - PubMed
    1. Andreou, I. et al. How do we prevent the vulnerable atherosclerotic plaque from rupturing? Insights from in vivo assessments of plaque, vascular remodeling, and local endothelial shear stress. J. Cardiovasc. Pharmacol. Ther.20, 261–275 (2015). 10.1177/1074248414555005 - DOI - PubMed
    1. Papafaklis, M. I. et al. Effect of the local hemodynamic environment on the de novo development and progression of eccentric coronary atherosclerosis in humans: insights from PREDICTION. Atherosclerosis240, 205–211 (2015). 10.1016/j.atherosclerosis.2015.03.017 - DOI - PubMed
    1. Siasos, G. et al. The role of shear stress in coronary artery disease. Curr. Top. Med. Chem.23, 2132–2157 (2023). 10.2174/1568026623666230329085631 - DOI - PubMed

MeSH terms