. 2024 Sep;633(8028):155-164.
doi: 10.1038/s41586-024-07789-z. Epub 2024 Sep 4.

Immune system adaptation during gender-affirming testosterone treatment

Affiliations

Immune system adaptation during gender-affirming testosterone treatment

Tadepally Lakshmikanth et al. Nature. 2024 Sep.

Erratum in

  • Author Correction: Immune system adaptation during gender-affirming testosterone treatment.
    Lakshmikanth T, Consiglio C, Sardh F, Forlin R, Wang J, Tan Z, Barcenilla H, Rodriguez L, Sugrue J, Noori P, Ivanchenko M, Piñero Páez L, Gonzalez L, Habimana Mugabo C, Johnsson A, Ryberg H, Hallgren Å, Pou C, Chen Y, Mikeš J, James A, Dahlqvist P, Wahlberg J, Hagelin A, Holmberg M, Degerblad M, Isaksson M, Duffy D, Kämpe O, Landegren N, Brodin P. Lakshmikanth T, et al. Nature. 2024 Oct;634(8033):E5. doi: 10.1038/s41586-024-08081-w. Nature. 2024. PMID: 39317781 Free PMC article. No abstract available.

Abstract

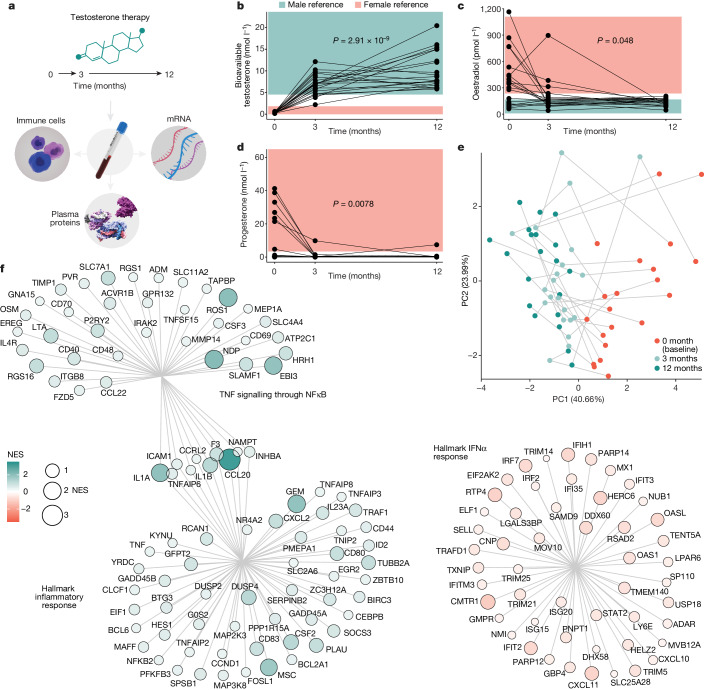
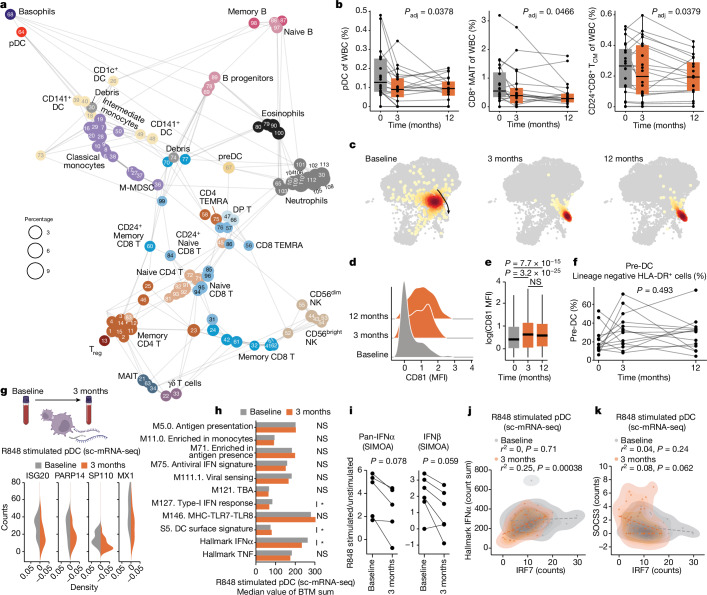
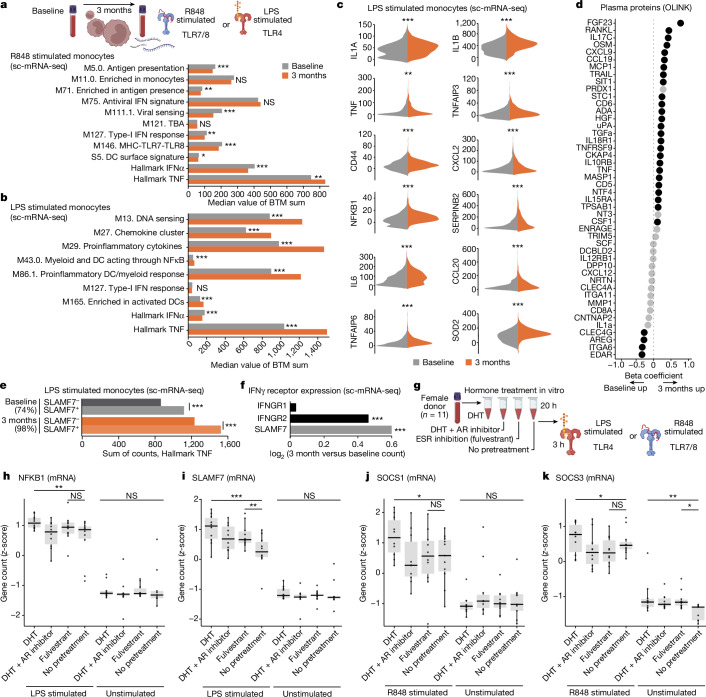
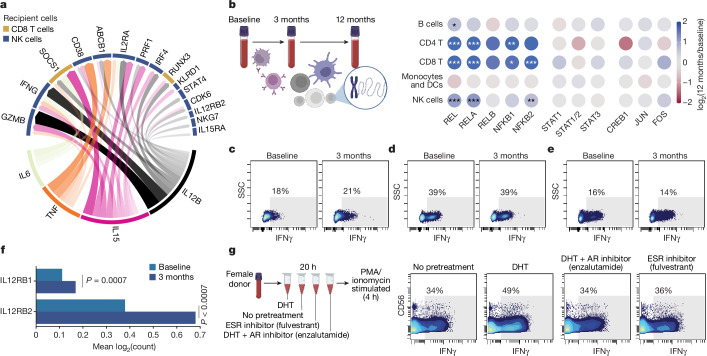
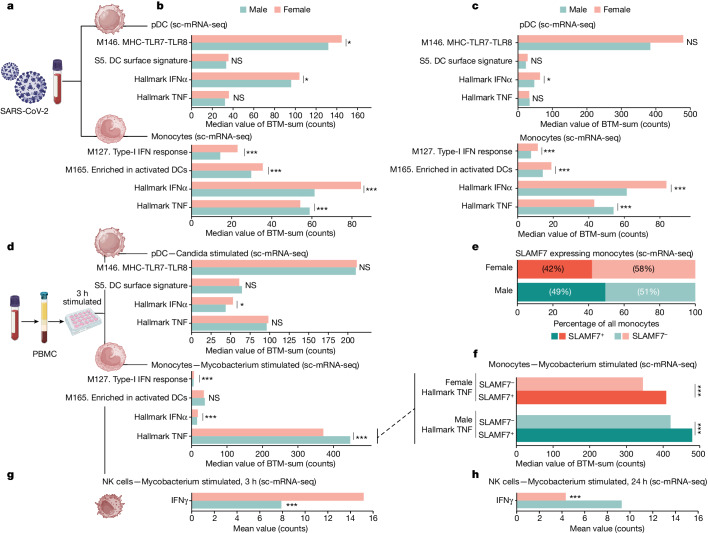
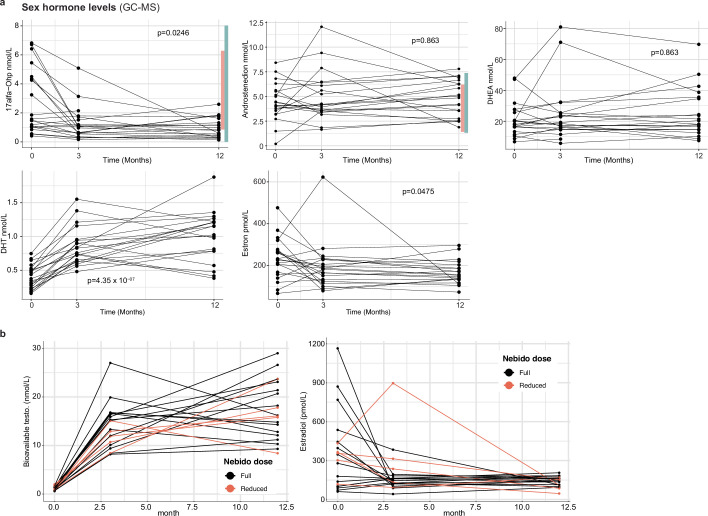
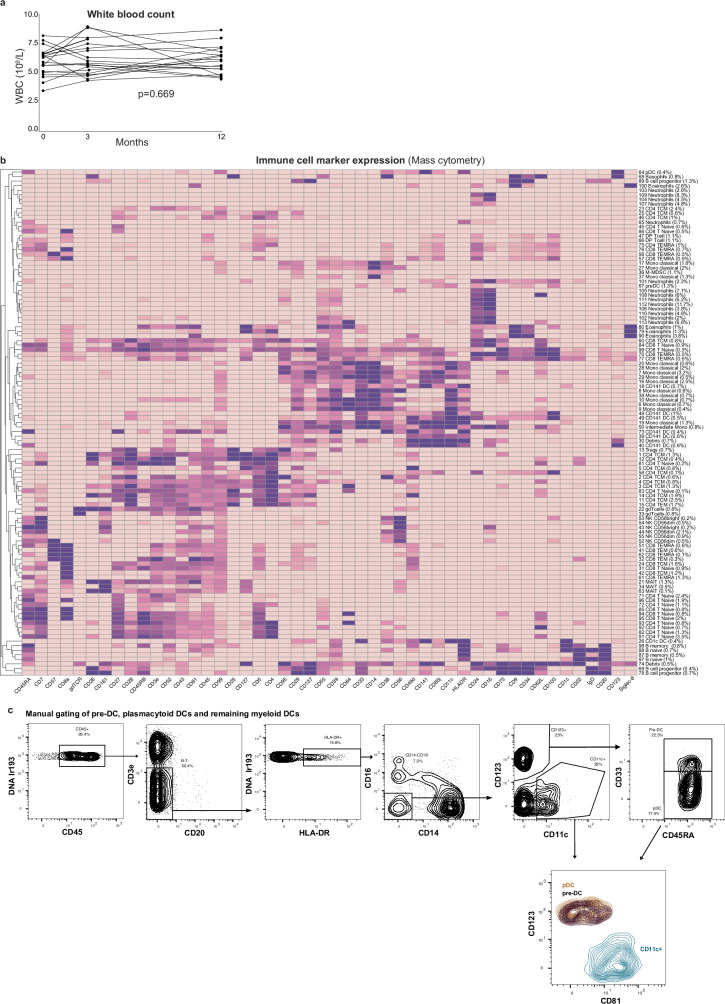
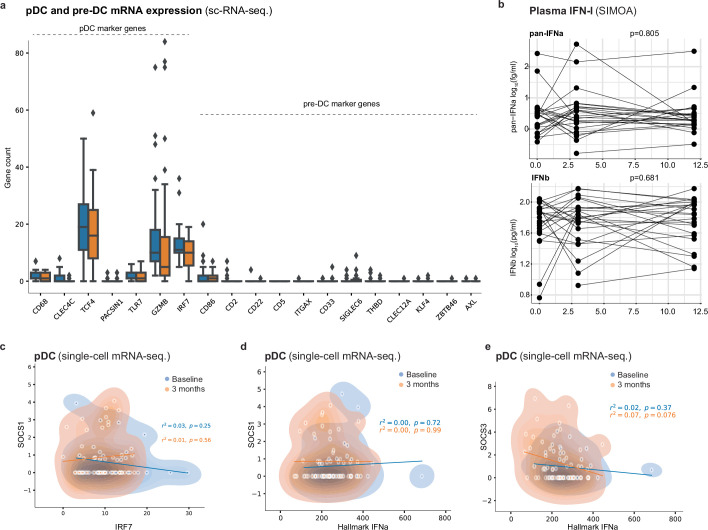
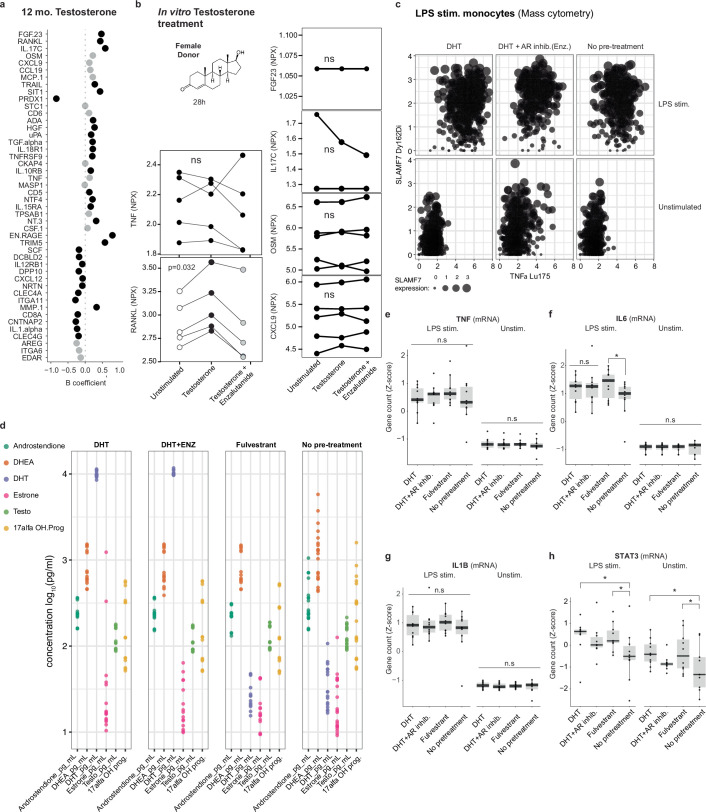
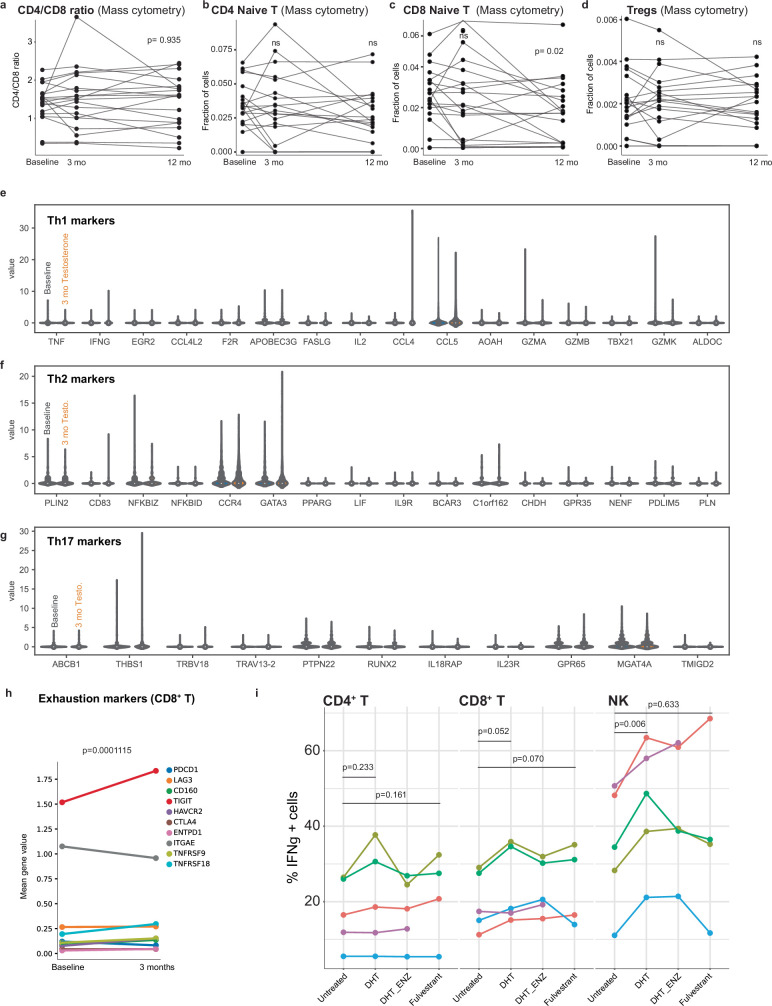
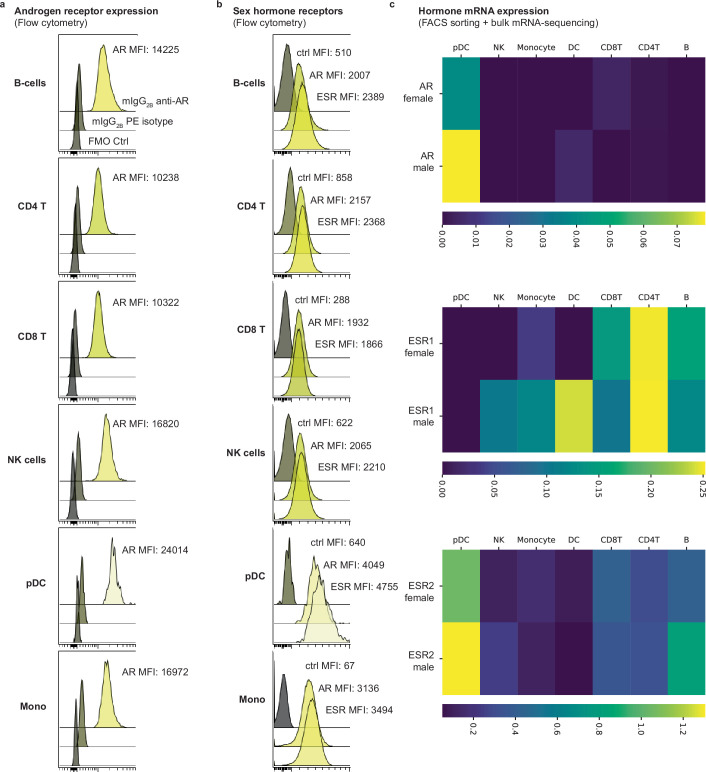
Infectious, inflammatory and autoimmune conditions present differently in males and females. SARS-CoV-2 infection in naive males is associated with increased risk of death, whereas females are at increased risk of long COVID1, similar to observations in other infections2. Females respond more strongly to vaccines, and adverse reactions are more frequent3, like most autoimmune diseases4. Immunological sex differences stem from genetic, hormonal and behavioural factors5 but their relative importance is only partially understood6-8. In individuals assigned female sex at birth and undergoing gender-affirming testosterone therapy (trans men), hormone concentrations change markedly but the immunological consequences are poorly understood. Here we performed longitudinal systems-level analyses in 23 trans men and found that testosterone modulates a cross-regulated axis between type-I interferon and tumour necrosis factor. This is mediated by functional attenuation of type-I interferon responses in both plasmacytoid dendritic cells and monocytes. Conversely, testosterone potentiates monocyte responses leading to increased tumour necrosis factor, interleukin-6 and interleukin-15 production and downstream activation of nuclear factor kappa B-regulated genes and potentiation of interferon-γ responses, primarily in natural killer cells. These findings in trans men are corroborated by sex-divergent responses in public datasets and illustrate the dynamic regulation of human immunity by sex hormones, with implications for the health of individuals undergoing hormone therapy and our understanding of sex-divergent immune responses in cisgender individuals.


Conflict of interest statement

P.B., T.L. and J.M. are cofounders of Cytodelics AB (Stockholm, Sweden), which produces and distributes the whole blood cell stabilizer solutions used in this study. P.B. is an executive board member of Kancera AB, scientific advisor for Pixelgen Technologies AB, Helaina Inc., Scailyte AG, Oxford Immune Algorithmics Ltd, Sention Health AB and the Swedish Olympic Committee. The other authors declare no competing interests.

Figures

Fig. 1
Fig. 1. Immunological investigation in individuals undergoing gender-affirming testosterone therapy.
a, Systems-level assessment of blood immune system in individuals assigned female sex at birth (trans men) in blood samples collected at baseline, and after 3 and 12 months of oral testosterone therapy (n = 23). bd, Sex hormone concentrations measured in serum samples (n = 66) using liquid chromatography with tandem mass spectrometry in a single experiment and shown in relation to female (pink) and male (blue) reference ranges before and during testosterone therapy. Kruskal–Wallis tests (5% false discovery rate (FDR) corrected) for bioavailable testosterone (b), oestradiol (c) and progesterone (d). e, PCA on the basis of nine sex hormones, first two principal components (PC1 and PC2; percentage variance explained) and sample points coloured by sample timepoint. f, Bulk RNA-seq from whole blood samples (n = 60) and differently expressed mRNA transcripts analysed by normalized enrichment scores (NES) for Hallmark pathways. Hallmark IFNα responses decrease after 12 months of testosterone treatment, TNF signalling through NFκB and Hallmark inflammatory responses increased after 12 months of testosterone treatment as compared with baseline.
Fig. 2
Fig. 2. Immune cell changes during gender-affirming testosterone therapy.
a, Immune cell clusters (FlowSOM) of 12,377,068 cells by 50-marker mass cytometry. N = 113 clusters annotated to lineages (n = 35). Cluster-IDs match expression heatmap (Extended Data Fig. 2b). b, Cell frequencies in n = 60 samples from 20 participants, four experiments, linear mixed-effects models with visit and age as fixed and participant as random effect. Boxplot centre, median; maximum, Q3 + 1.5 × IQR (IQR values ranging from Q1 to Q3); minimum whisker, Q1 − 1.5 × IQR; P values 5% FDR corrected. c, Two-dimensional embedding (ForceAtlas2) of pDCs (n = 742) analysed by mass cytometry in a single donor and one representative experiment of four. d, CD81 expression in pDCs from samples in c. e, Summary of CD81 concentrations in pDCs from 18 donors across four experiments (n = 15,197). Boxplot centre, median; maximum, Q3 + 1.5 × IQR (IQR values ranging from Q1 to Q3); minimum whisker, Q1 – 1.5 × IQR. Two-sided, uncorrected Wilcoxon rank sum test. f, Manually gated pre-DCs in lineage negative, HLA-DR+ cells (Extended Data Fig. 2c) in 42 samples, 14 participants from three experiments by one-way analysis of variance. g, Normalized counts of four IFN-I response genes in R848-stimulated pDCs by sc-mRNA-seq at baseline (n = 41) and 3 months (n = 47), of two experiments. Counts in stimulated cells, subtracting median counts in unstimulated pDCs. h, Median sums of genes assigned to indicated BTMs in R848-stimulated pDCs by sc-mRNA-seq at baseline and 3 months. *P < 0.05. Uncorrected, two-sided Student’s t-test. i, pan-IFNα and IFNb protein ratios (R848-stimulated versus unstimulated) in PBMC cultures; P values comparing ratios at baseline and 3 months by one-sided, paired Student’s t-tests. j,k, pDC sc-mRNA-seq of R848-stimulated pDCs at baseline (n = 41) and 3 months (n = 47) in two independent experiments by uncorrected, two-sided Student’s t-tests and R-values from Pearson correlation coefficients, IRF7 counts versus Hallmark IFNα count sum (j), and IRF7 versus SOCS3 counts (k). MAIT, mucosa-associated invariant T cells; MFI, mean fluorescence intensity; NS, non-significant.
Fig. 3
Fig. 3. Monocyte responses following testosterone treatment.
a, Median sum gene counts compared by two-sided, independent samples Student’s t-test, Bonferroni corrected P values for the indicated BTM in R848-stimulated (3 h) monocytes from baseline (n = 466) and after 3 months of testosterone (n = 851) treatment across two independent experiments. b, Median sum gene counts compared by two-sided, independent samples Student’s t-test with Bonferroni corrected P values for the indicated BTMs in LPS-stimulated (3 h) monocytes at baseline (n = 1,297) and 3 months (n = 1,050) from two independent experiments. c, log-transformed counts from sc-mRNA-seq of LPS-stimulated monocytes as in b after subtracting median expression of unstimulated cells at baseline (n = 1,297; grey) and 3 months (n = 1,050; orange) across two independent experiments. Twelve genes in the Hallmark TNF pathway are shown. d, Analysis of plasma proteins (Olink Target 96 inflammation and immune response panels) in samples from n = 20 participants at baseline and 3 months of testosterone in a single experiment. Black dots significantly different at 12 months over baseline (P < 0.05) by Kruskal–Wallis tests. e, sc-mRNA-seq and Hallmark TNF responses upon LPS stimulation (3 h) in SLAMF7 high versus low monocytes as in b. Fraction of SLAMF7+ monocytes at baseline (n = 1,297) and after 3 months of testosterone (n = 1,050) shown on top. Two-sided, independent samples and uncorrected Student’s t-test; ***P < 0.001. f, The log2 (fold change, 3 months versus baseline) gene counts for IFNGR1, IFNGR2 and SLAMF7 mRNA in monocytes (baseline, n = 1,297 and 3 months, n = 1,050). g, Blood from 11 healthy cis female participants incubated for 20 h with DHT with/without AR inhibitor (Enzalutamide) or ESR inhibitor/degrader (Fulvestrant) and then stimulated (3 h) by LPS or R848 and analysed for induced mRNA (n = 560) by Nanostring nCounter. hk, z-score transformed mRNA counts of LPS-induced NFKB1 (h), SLAMF7 (i), R848-induced SOCS1 (j) and SOCS3 (k). One-sided, paired measurements, uncorrected Student’s t-tests, *P < 0.05; **P < 0.01; ***P < 0.001.
Fig. 4
Fig. 4. NFkB activation and IFNγ induction in NK cells following testosterone therapy.
a, NicheNet analysis of monocytes from single-cell transcriptome data of LPS-stimulated PBMC comparing 3 months of in vivo testosterone treatment versus baseline. All target genes (top half of circle) are upregulated after testosterone treatment in vivo in NK cells and CD8+ T cells. Most explanatory genes in monocytes are shown in the lower half of the circle. Arrow width and density correspond to strength of inferred relationship. b, Blood T cells analysed for TF binding site chromatin accessibility as log-fold enrichment at 12 months versus baseline for a given TF with indicated cell populations using sc-ATAC-sequencing of PBMC (n = 12,773) from three participants sampled before and during testosterone treatment. Cells were assigned to indicated cell populations on the basis of gene activity for canonical marker genes. Adjusted P values: *P < 0.05, **P < 0.01, ***P < 0.001. ce, PBMCs obtained at baseline or after 3 months of testosterone treatment were simulated with PMA/ionomycin for 4 h in vitro and intracellular IFNγ production in NK cells (c), CD8+ T cells (d) and CD4+ T cells (e) was analysed using flow cytometry. Numbers indicate percentage IFNγ+ cells. f, Expression of IL12RB1 and IL12RB2 mRNA in NK cells at baseline and after 3 months of in vivo testosterone treatment by sc-mRNA-seq. Two-sided, independent samples and uncorrected Student’s t-test; ***P < 0.001. g, Blood from one healthy cisgender female participant was incubated for 20 h with DHT with/without Enzalutamide or Fulvestrant followed by stimulation with PMA/ionomycin for 4 h, staining for intracellular cytokines and analysis by mass cytometry. Manually gated NK cells are shown and the fraction of IFNγ+ cells was determined on the basis of staining controls as indicated.
Fig. 5
Fig. 5. Sex-divergent responses confirmed in public datasets.
a, Male and female patients infected with SARS-CoV-2. b, sc-mRNA-seq data from patients infected with SARS-CoV-2 selected for pDCs (n = 144 (male, 103; female, 41)) and monocytes (n = 33,887 (male, 18,262; female, 15,625)) and gene count sum for the indicated BTM. Two-sided, independent samples and uncorrected Student’s t-test: *P < 0.05; **P < 0.01; ***P < 0.001. c, PBMC data from SARS-CoV-2 infected patients analysed by sc-mRNA-seq and divided into pDCs (n = 21 (male, 10; female,11)) and monocytes (n = 4,521 (male, 2,672; female, 1,849)). Two-sided, independent samples and uncorrected Student’s t-test: *P < 0.05; **P < 0.01; ***P < 0.001. d, PBMCs from healthy male and female participants stimulated in vitro (3 h) and analysed by sc-mRNA-seq. pDCs (n = 262 (male, 162; female, 100)) were selected from cells stimulated with C. albicans, and monocytes (n = 12,961 (male, 6,652; female, 6,309)) were selected from cells stimulated with mTB. Two-sided, independent samples and uncorrected Student’s t-test: *P < 0.05; **P < 0.01; ***P < 0.001. e,f, Monocytes in d subdivided according to SLAMF7 expression (e), and Hallmark TNF gene count following mTB stimulation in vitro for SLAMF7+ and SLAMF7 monocytes (f). Two-sided, independent samples and uncorrected Student’s t-test: *P < 0.05; **P < 0.01; ***P < 0.001. g,h, Single NK cell transcriptome analyses following in vitro exposure to mTB for 3 h (g) and 24 h (h) and mean mRNA count for IFNγ are shown. Two-sided, independent samples and uncorrected Student’s t-test: *P < 0.05; **P < 0.01; ***P < 0.001.
Extended Data Fig. 1
Extended Data Fig. 1. Modeling of whole blood mRNA transcriptome data.
Sex hormone measurements by LCMS over time during testosterone treatment in n = 22 subjects and 3 timepoints per subject. Shaded areas represent male (blue) and female (pink) reference ranges where available. P-values from Kruskal-Wallis tests (5% FDR corrected) b) Testosterone and estradiol levels in patients receiving full dose (1000 mg, black) or reduced doses (750 mg, orange) of Nebido at one or more timepoints.
Extended Data Fig. 2
Extended Data Fig. 2. Immune cell changes during gender affirming testosterone therapy.
a) White blood counts as measured by clinical chemistry analyses at baseline and following 3- and 12-months of testosterone therapy. Repeated measures ANOVA, unadjusted p-value. b) Marker expression (Z-score transformed per marker) across all 113 immune cell clusters and n = 12,377,068 cells c) Manual gating strategy to identify pDC, pre-DC and CD11c+ DC populations among lineage negative HLA-DR+ cells analyzed by Mass cytometry.
Extended Data Fig. 3
Extended Data Fig. 3. pDC functional responses.
a) pDc and pre-DC marker genes as reported by Villani et al shown in n = 41 pDCs from baseline and n = 47 pDCs at 3-months from two independent experiments. Boxplot centre = median, max whisker = Q3 + 1.5*IQR (IQR = values ranging from Q1-Q3), min whisker = Q1 – 1.5*IQR. b) Plasma pan-IFNα and IFNβ protein levels measured by SIMOA in 71 samples from 24 subjects across two experiments at baseline and following 3 and 12 months of testosterone therapy. Repeated measures ANOVA, unadjusted p-values. c) pDC RNA counts for IRF7 vs SOCS1 following R848 stimulation in vitro comparing pDCs collected at baseline (n = 41) and following 3 months of testosterone (n = 47) across two independent experiments. Uncorrected, 2-sided t-tests and R-values from pearson correlation-coefficients, d) pDC RNA counts for SOCS1 v.s. Hallmark IFNα following R848 stimulation and, e) pDC RNA counts for SOCS3 v.s. Hallmark IFNα following R848 stimulation.
Extended Data Fig. 4
Extended Data Fig. 4. TNF family proteins and monocyte responses.
a) Olink Target96TM inflammation panel analyses of plasma samples from n = 20 subjects sampled 12 months after initiating Gender affirming testosterone therapy shown as mixed-effects modeling coefficients. b) In vitro testosterone treatment (28 h) of blood from a healthy female with/without AR antagonist Enzalutamide and analyses by Olink Target 96 Inflammation. Linear mixed effects analysis with treatment as fixed effect and subject as random effect and 5% FDR corrected p-values, n.s: non-significant c) Blood from a healthy female incubated (20 h) with dihydrotestosterone (DHT) with/without AR inhibitor (Enzalutamide) and stimulated by LPS (4 h) followed by Mass cytometry analysis of intracellular TNFα and SLAMF7 surface protein. Randomly down sampled (5%) of cells and visualized with dot size corresponding to SLAMF7 expression show TNFαhi cells predominantly expressing high SLAMF7 upon DHT pre-treatment. A single representative experiment of three. d) Blood from eleven healthy cis females incubated (20 h) with dihydrotestosterone (DHT) with/without androgen receptor inhibitor (Enzalutamide) or oestradiol-receptor blocker and degrader (Fulvestrant). Resulting culture supernatants were analyzed for Androstenedione, DHEA, DHT, Estrone, Testosterone and 17a-Hydroxyprogesterone using GC-MS. e) Cultures were stimulated by LPS for 3 h and analyzed for mRNA-abundances (n = 560) by Nanostring nCounter. Z-score transformed mRNA (counts) of LPS induced TNF, f) IL6, g) IL1B, and h) STAT3. P-values: *p < 0.05, n.s: non-significant, by uncorrected pairwise t-tests. Boxplot centre = median, max whisker = Q3 + 1.5*IQR (IQR = values ranging from Q1-Q3), min whisker = Q1 – 1.5*IQR.
Extended Data Fig. 5
Extended Data Fig. 5. T cell adaptation to testosterone treatment.
a) CD4/CD8 ratio, b) Naive CD4 + T cells, and c) Naive CD8 + T cell fractions before and during testosterone treatment. P-values from two-sided, paired and uncorrected t-tests. n.s = non-significant. d) Mass cytometry analyses of Treg frequency. P-values from two-sided, paired and uncorrected t-tests. n.s = non-significant. e) Single cell mRNA sequencing from PBMCs at baseline and after 3 months of testosterone in vivo selected on memory CD4 + T cells and transcripts related to Th1, f) Th2 and g) Th17 markers shown. h) Expression of the indicated T cell exhaustion markers for CD8 + T cells at baseline and 3 months following testosterone analyzed by single cell mRNA sequencing. P-value from 2-sided, uncorrected t-test indicating global module expression at baseline vs. 3 months. i) Five healthy female donors, pretreated with DHT, DHT + AR inhib. (Enzalutamide) or ESR inhibitor (Fulvestrant) followed by PMA/Ionomycin stimulation (4 h) and analyzed by intracellular IFNγ in CD4+ T, CD8+ T and NK cells analyzed by repeated measures ANOVA with Tukey’s Honest Significant Differences posthoc multiple hypothesis test.
Extended Data Fig. 6
Extended Data Fig. 6. Sex-hormone receptor expression.
a) Flow cytometry analysis of intracellular staining of the androgen receptor, AR in the indicated cell populations. Staining control (fluorescence minus one, FMO) and mouse anti-human IgB2B PE isotype control in grey. Mean Fluorescence Intensity, MFI is indicated. b) Flow cytometry analysis of AR and pan-ESR in the indicated cell populations. Staining control (fluorescence minus one, FMO) in grey. c) PBMCs from healthy men and women sorted based on canonical surface markers and subject to bulk mRNA-sequencing and expression nTPM (normalized Transcripts per million bases) for the indicated sex hormone receptor mRNA in three female and three male donors combined.

References

    1. Brodin, P. Immune determinants of COVID-19 disease presentation and severity. Nat. Med.27, 28–33 (2021). - PubMed
    1. Choutka, J., Jansari, V., Hornig, M. & Iwasaki, A. Unexplained post-acute infection syndromes. Nat. Med.28, 911–923 (2022). - PubMed
    1. Klein, S. L., Marriott, I. & Fish, E. N. Sex-based differences in immune function and responses to vaccination. Trans. R. Soc. Trop. Med. Hyg.109, 9–15 (2015). - PMC - PubMed
    1. Cooper, G. S. & Stroehla, B. C. The epidemiology of autoimmune diseases. Autoimmun. Rev.2, 119–125 (2003). - PubMed
    1. Brodin, P. et al. Studying severe long COVID to understand post-infectious disorders beyond COVID-19. Nat. Med.28, 879–882 (2022). - PubMed

MeSH terms

LinkOut - more resources