. 2024 Sep;633(8028):198-206.
doi: 10.1038/s41586-024-07882-3. Epub 2024 Sep 4.

Mechanisms that clear mutations drive field cancerization in mammary tissue

Collaborators, Affiliations

Mechanisms that clear mutations drive field cancerization in mammary tissue

Marta Ciwinska et al. Nature. 2024 Sep.

Abstract

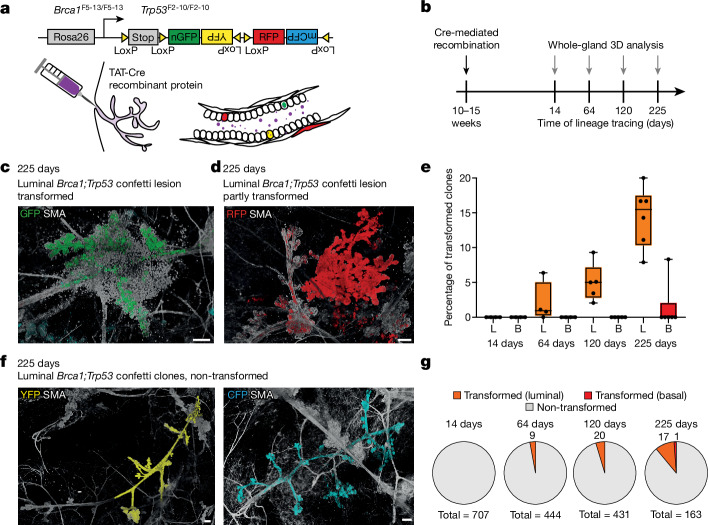
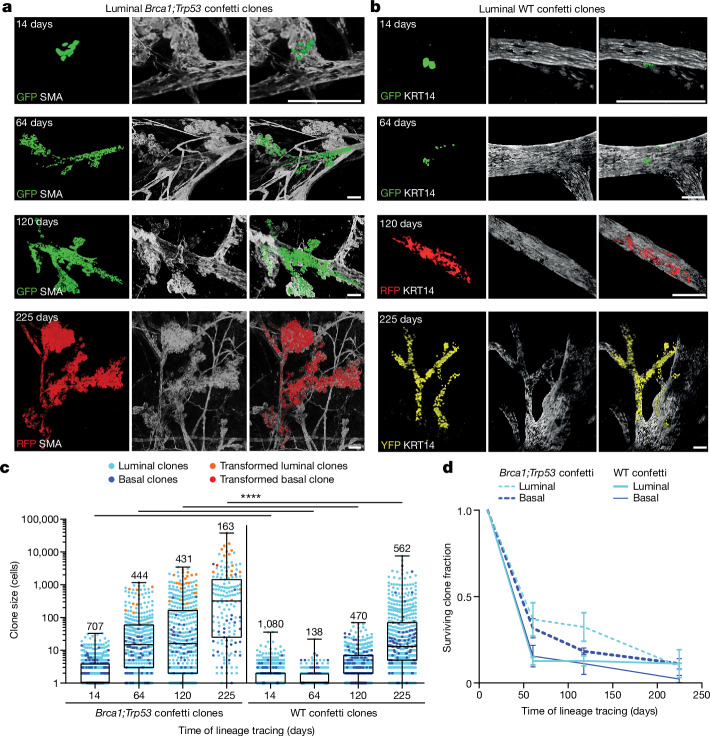
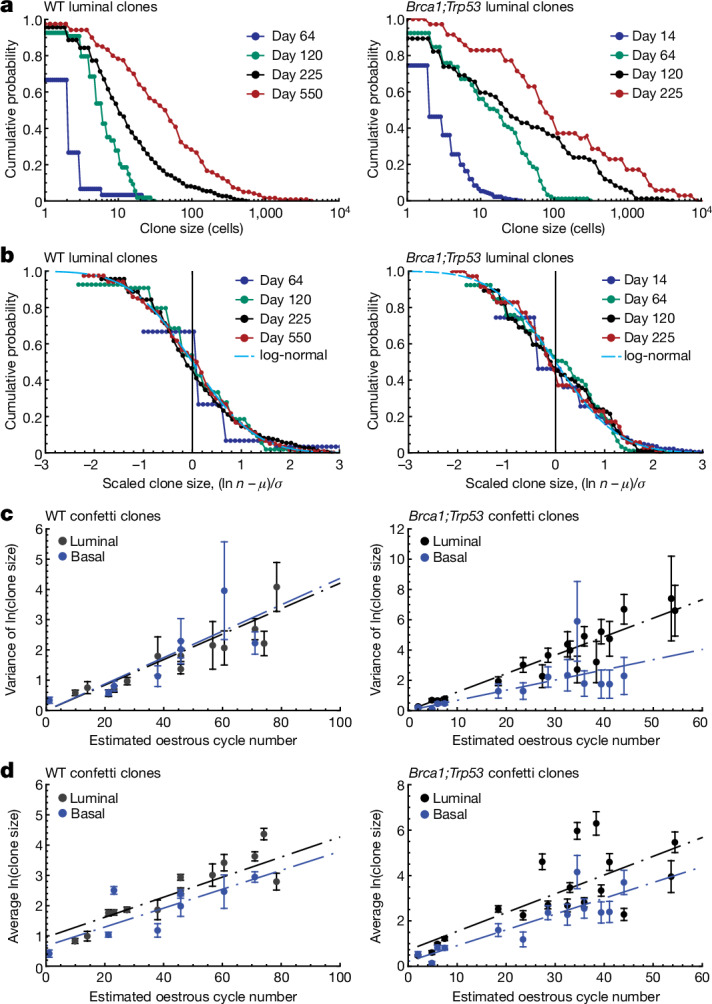
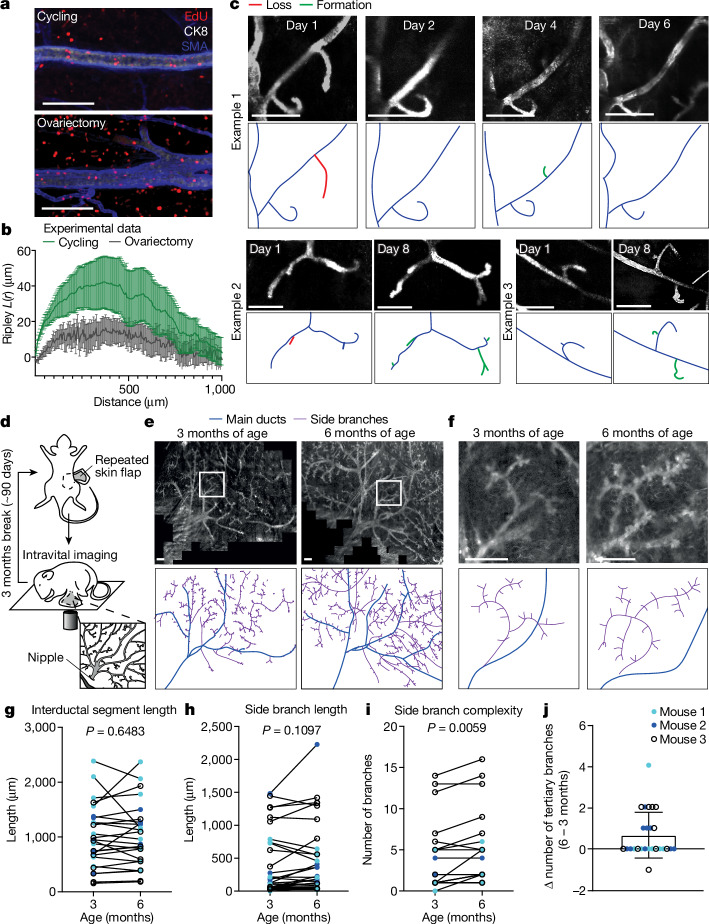
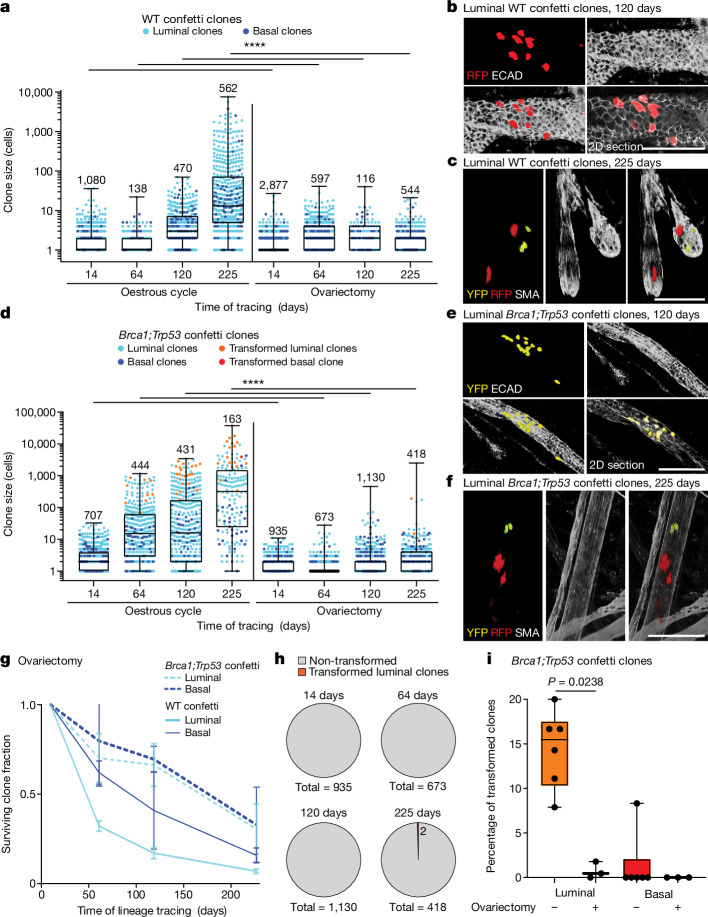
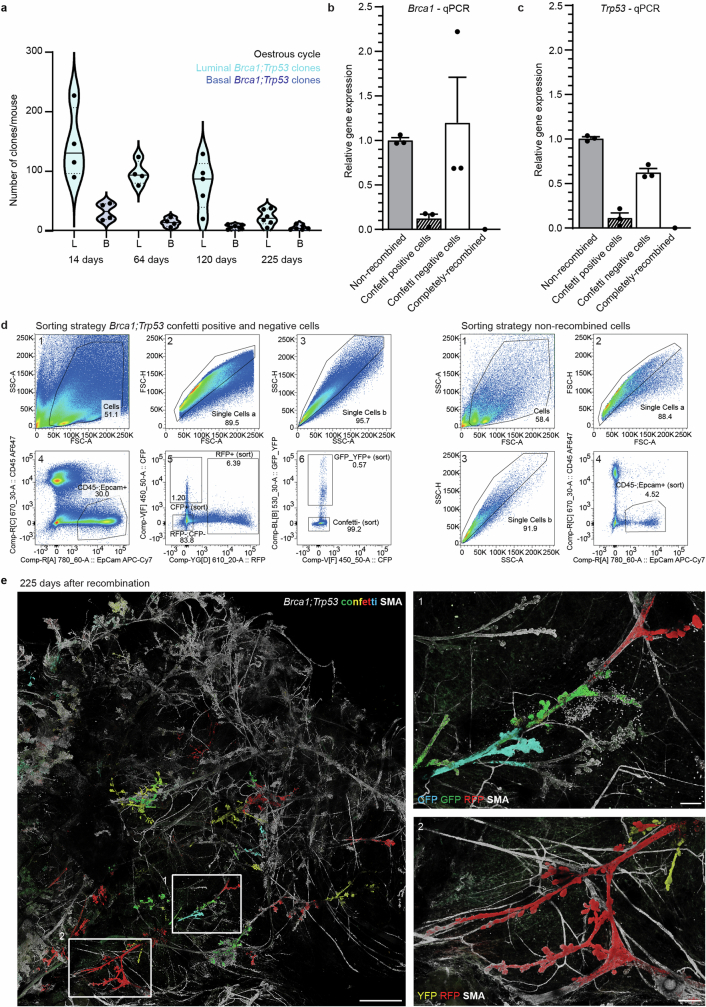
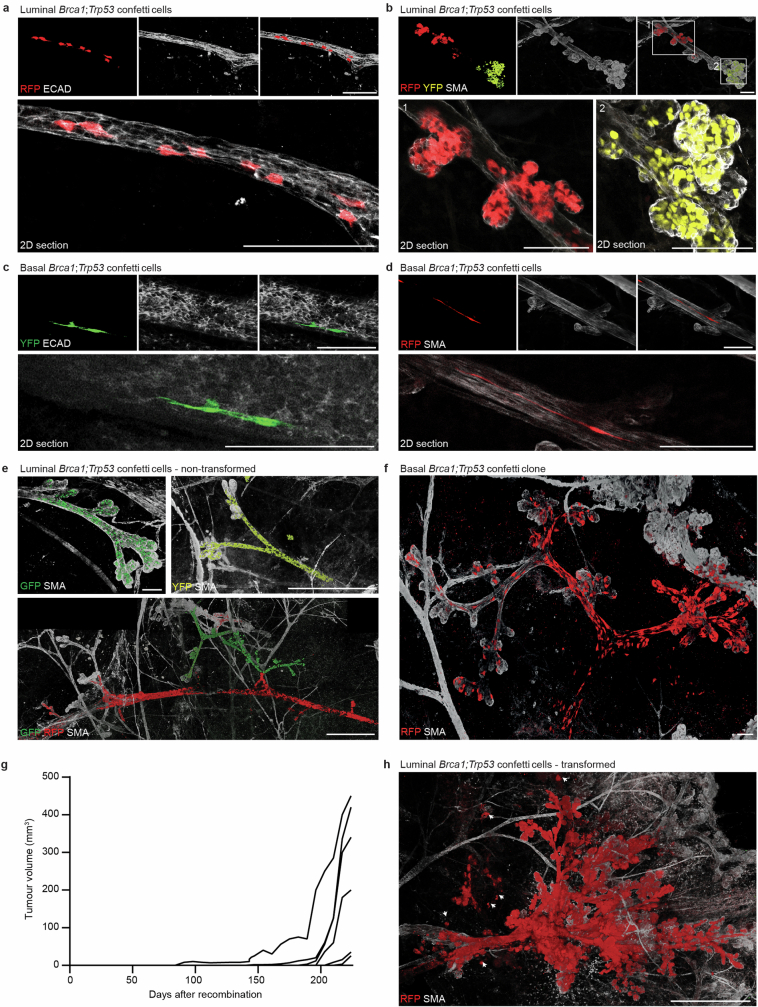
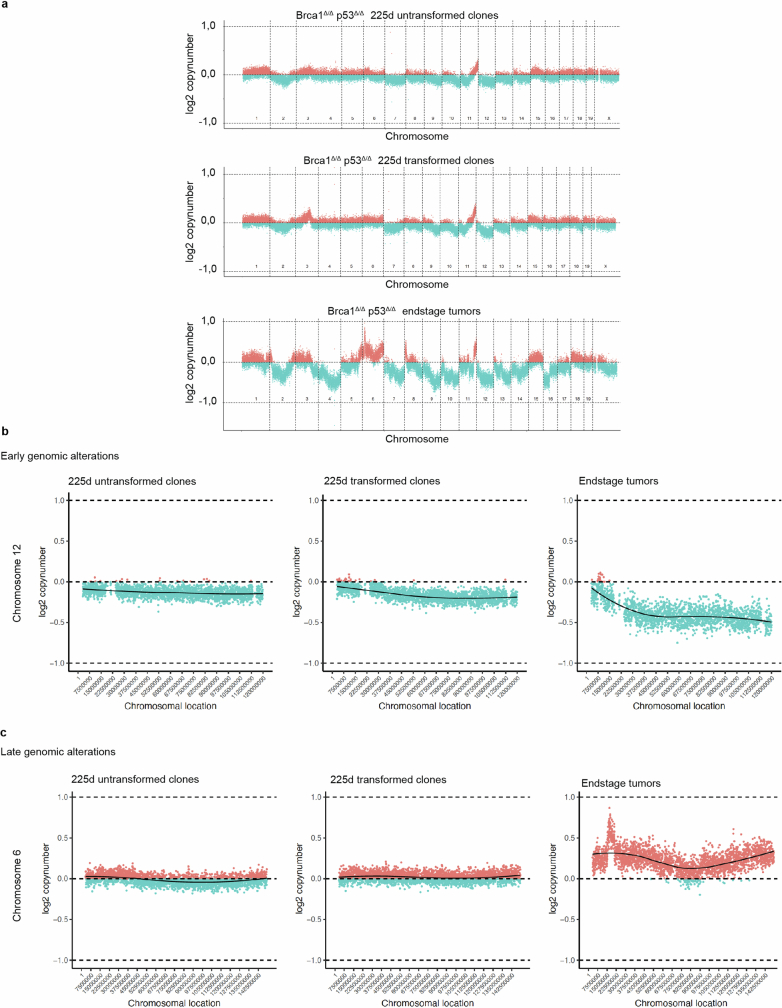
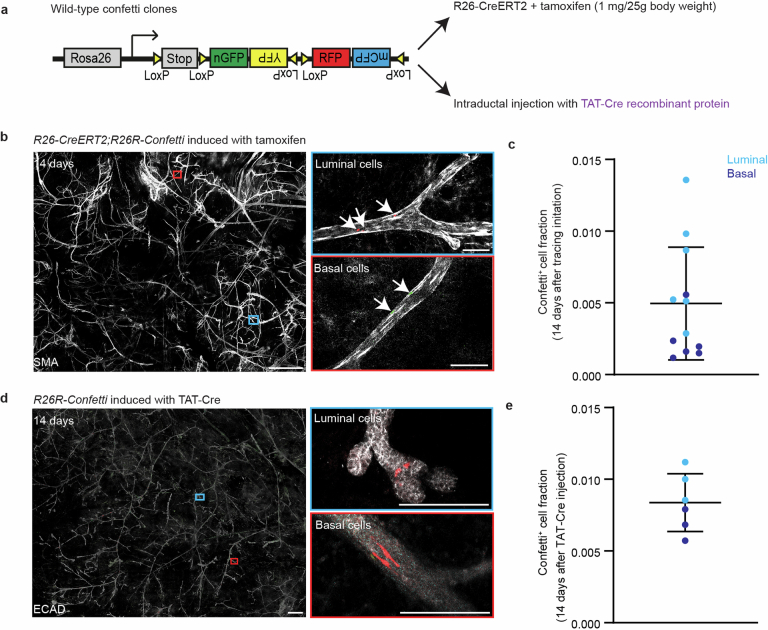
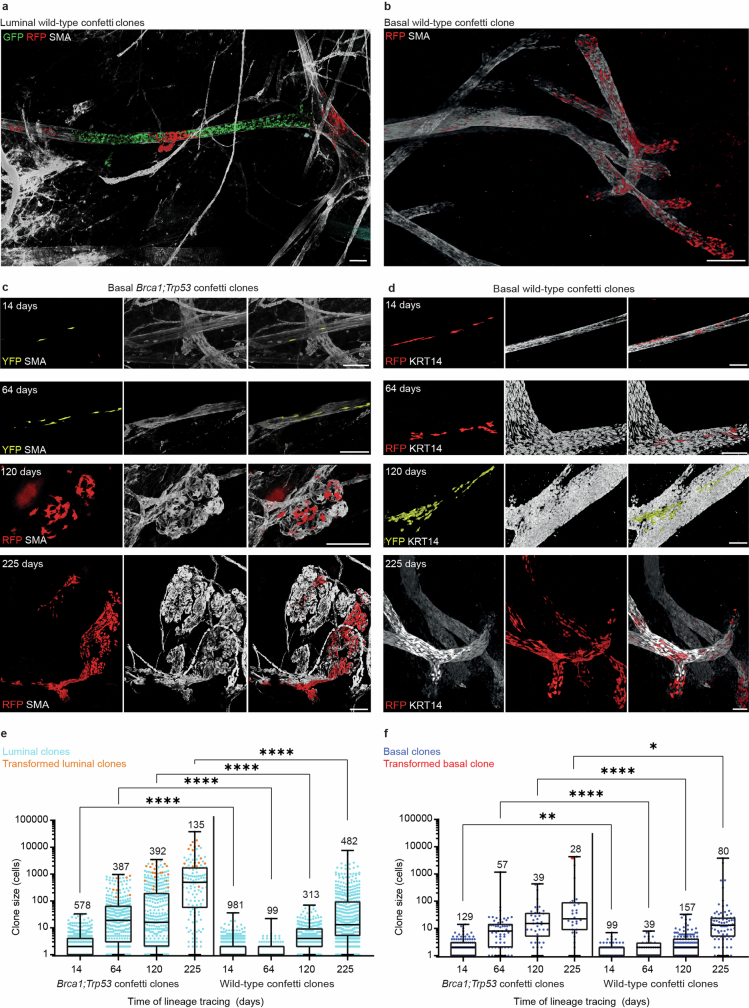
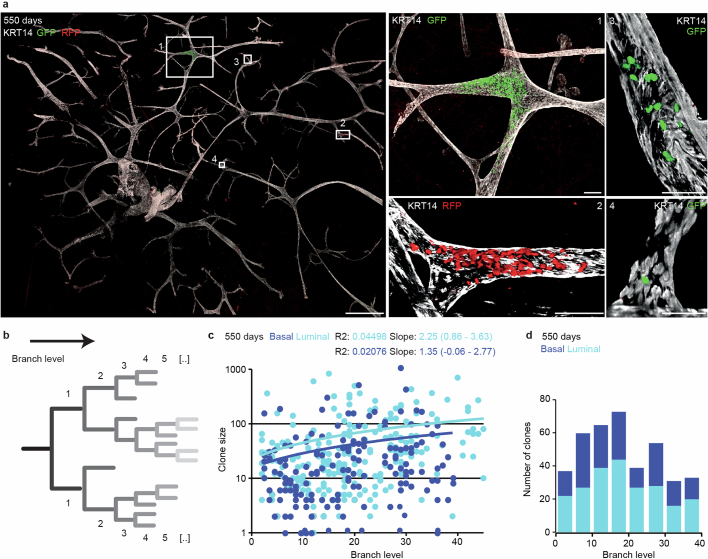
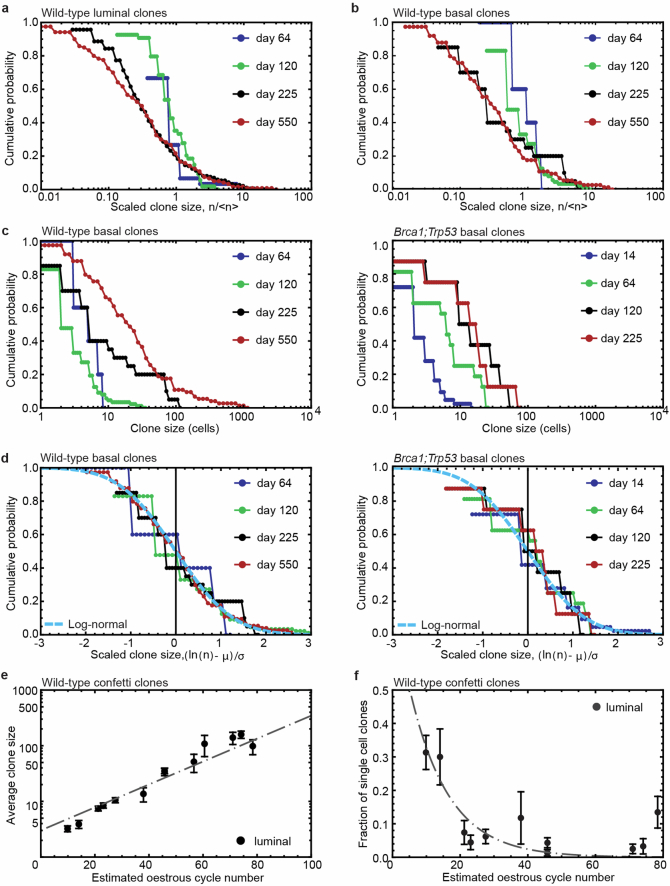
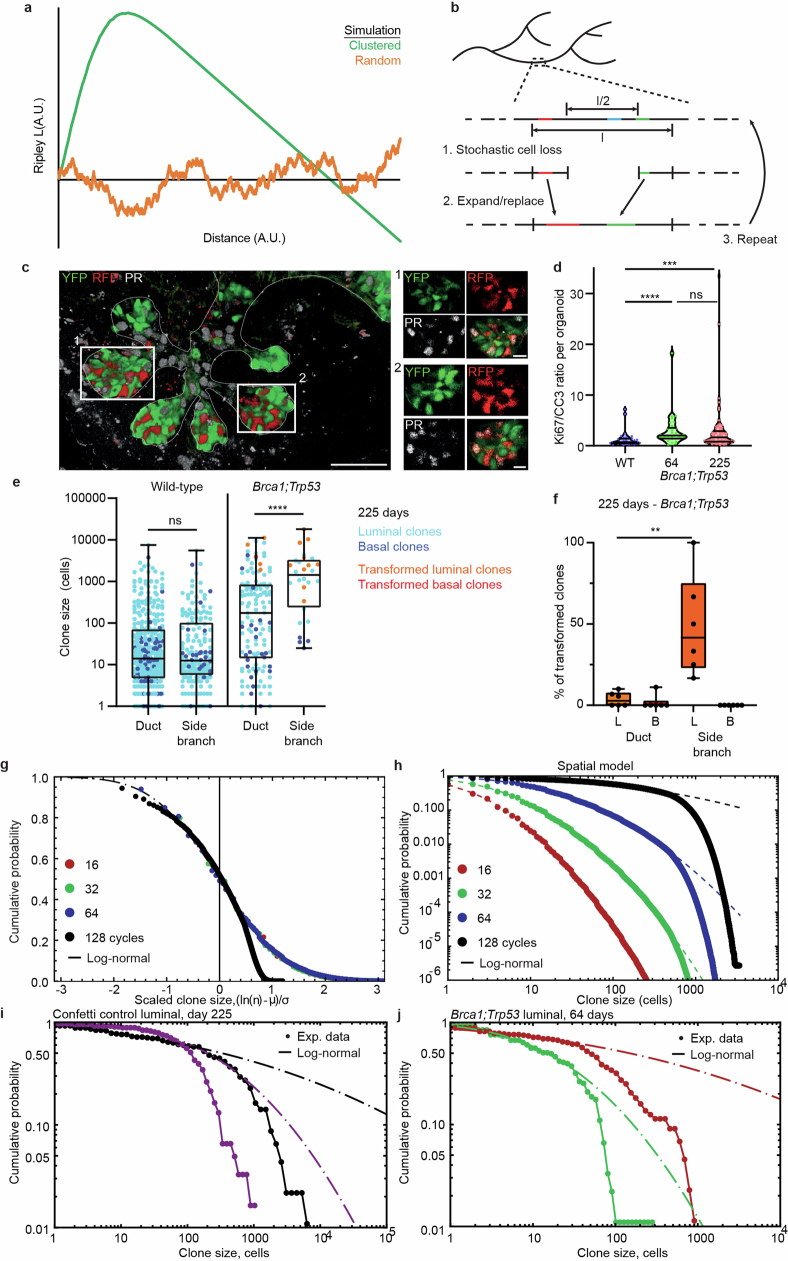
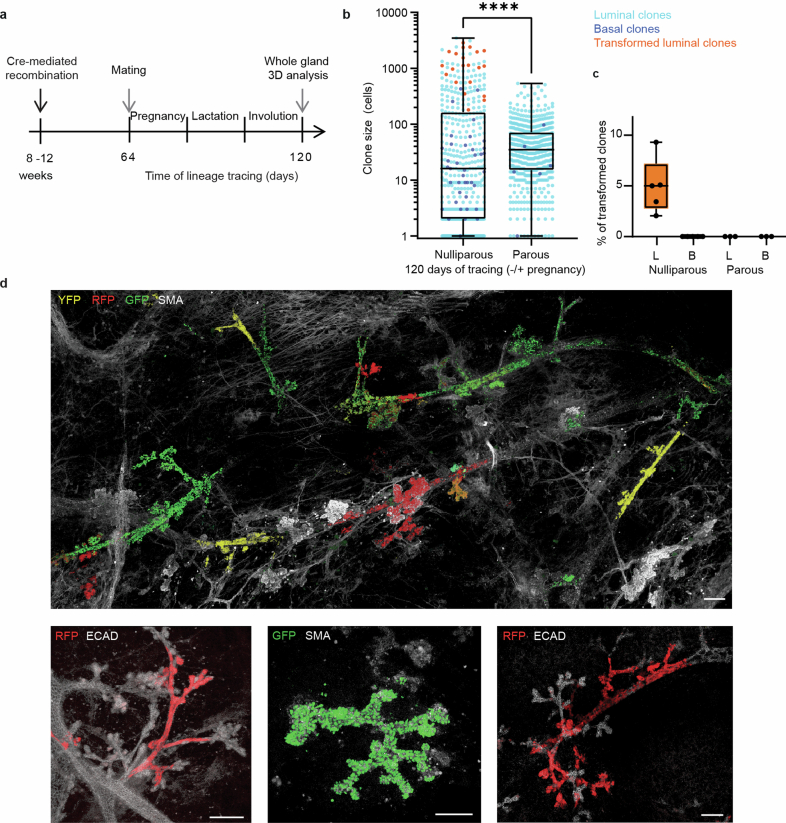
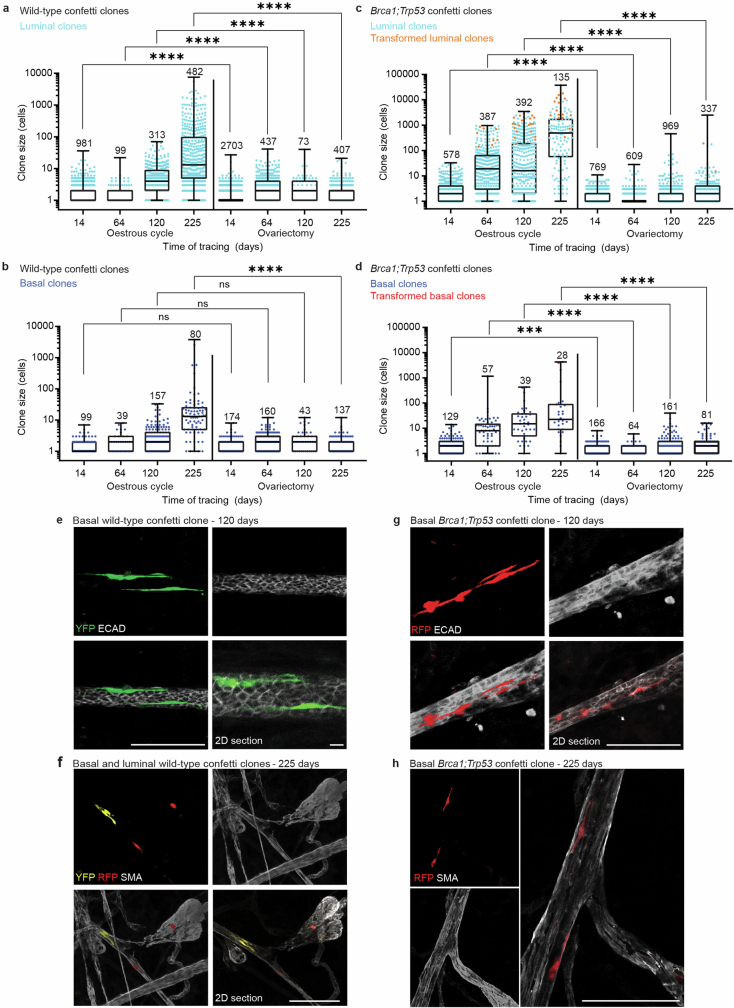
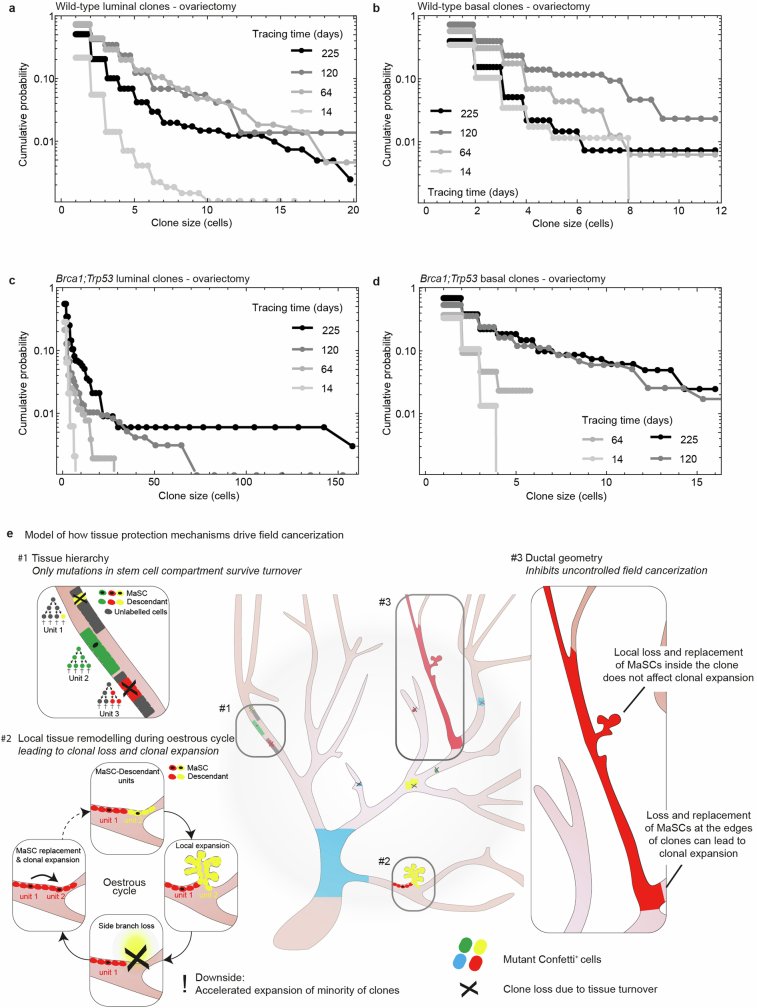
Oncogenic mutations are abundant in the tissues of healthy individuals, but rarely form tumours1-3. Yet, the underlying protection mechanisms are largely unknown. To resolve these mechanisms in mouse mammary tissue, we use lineage tracing to map the fate of wild-type and Brca1-/-;Trp53-/- cells, and find that both follow a similar pattern of loss and spread within ducts. Clonal analysis reveals that ducts consist of small repetitive units of self-renewing cells that give rise to short-lived descendants. This offers a first layer of protection as any descendants, including oncogenic mutant cells, are constantly lost, thereby limiting the spread of mutations to a single stem cell-descendant unit. Local tissue remodelling during consecutive oestrous cycles leads to the cooperative and stochastic loss and replacement of self-renewing cells. This process provides a second layer of protection, leading to the elimination of most mutant clones while enabling the minority that by chance survive to expand beyond the stem cell-descendant unit. This leads to fields of mutant cells spanning large parts of the epithelial network, predisposing it for transformation. Eventually, clone expansion becomes restrained by the geometry of the ducts, providing a third layer of protection. Together, these mechanisms act to eliminate most cells that acquire somatic mutations at the expense of driving the accelerated expansion of a minority of cells, which can colonize large areas, leading to field cancerization.


Conflict of interest statement

The authors declare no competing interests.

Figures

Fig. 1
Fig. 1. Brca1−/−;Trp53−/− lesion formation is accompanied by fields of morphologically normal ducts carrying mutant cells.
a, Schematic of the Brcafl/fl;Trp53fl/fl;R26R-Confetti mouse model used in this study. Recombination was induced by an intraductal injection method with TAT-Cre recombinant protein, leading to sporadic deletion of the Brca1;Trp53 alleles and at the same time stochastic recombination of the Confetti construct resulting in the expression of one of the four fluorophores. b, Timeline of lineage tracing experiments performed in the adult mammary gland. c,d, Brca1;Trp53 confetti lesions with a transformed ductal morphology (c) and partially transformed ductal morphology and local invasion (d). e, Transformed luminal (L, orange) and basal (B, red) clones as a percentage of the total number of luminal and basal clones, respectively. Each dot indicates an individual mouse; boxplots mark the 25th and 75th percentile, the line indicates the median and the whiskers mark the minimum and maximum values. f, Representative whole-mount confocal images of non-transformed Brca1−/−;Trp53−/− confetti clones showing extensive field cancerization within the existing ductal structure. c,d,f, Images show 3D rendering of Z-stacks, with the confetti-labelled cells in their respective colours and the mammary ducts labelled with an antibody against SMA (white). Representative examples of n = 6 mice. g, Charts representing the fraction of non-transformed luminal and basal clones (grey), the transformed luminal clones (orange) and the transformed basal clones (red) at different time points after recombination for all analysed glands combined. The total number of quantified Brca1−/−;Trp53−/− confetti clones is indicated below the charts and the number of transformed clones is indicated within the charts. See Supplementary Information 1 for sample sizes and descriptive statistics for e and g. Scale bars, 100 μm. Source Data
Fig. 2
Fig. 2. Long-term unbiased lineage tracing in adult mammary gland under mutant and homeostatic conditions.
a,b, Representative confocal whole-mount images showing clonal expansion of luminal Brca1;Trp53 confetti clones (a) and luminal WT confetti clones (b) in the adult mammary gland over a lineage tracing time period of 225 days. Persisting clones form cohesive clusters of cells spanning many ducts and branch points. Images show 3D rendering of Z-stacks, with the confetti-labelled cells in their respective colours and the mammary ducts labelled with SMA or Keratin 14 (KRT14), both depicted in white. c, Clone size quantification of luminal (cyan dots) and basal (blue dots) Brca1;Trp53 confetti clones (left) and WT confetti clones represented on a logarithmic scale. For each time point at least n = 6 glands from three mice were analysed. Morphologically transformed clones are indicated in orange (luminal) and red (basal). The analysed numbers of clones for each time point are indicated. Boxplots mark the 25th and 75th percentiles, the line indicates the median and the whiskers mark the minimum and maximum values. Significance was tested using a two-sided Mann–Whitney test, ****P < 0.0001. d, Average surviving basal and luminal clone fraction as a function of time normalized to the average number of confetti+ cells 14 days after recombination. Each data point shows the average of at least n = 3 mice per time point. Error bars represent ±s.e.m. From a longitudinal data analysis between the Brca1;Trp53 and WT clones there is no significant difference between the groups (Supplementary Information 2). See Supplementary Information 1 for sample sizes, P values and statistics for c and d. Scale bars, 50 µm. Source Data
Fig. 3
Fig. 3. Clone sizes follow a log-normal distribution.
a, Cumulative distribution of WT (left) and Brca1;Trp53 (right) luminal confetti clone sizes showing the probability of finding a clone larger than the given size (log scale). To account for the impact of large-scale mouse-to-mouse variability on clone size, the curves are shown for a representative set of individual mice (distributions are shown for all mice in Supplementary Information 4). n ≥ 3 mice per time point. b, Rescaled cumulative distribution of the logarithm of WT (left) and Brca1;Trp53 (right) luminal confetti clone size, ln n, showing the probability of finding a clone with a size larger than (lnnμ)/σ, where μ=lnn denotes the average of the logarithm of clone size and σ2=(lnnlnn)2 represents the variance. Points show data from a. Once rescaled, data from different time points collapse onto a single curve that fits well with the scaling function (1/2)erfc(x/2) (cyan dashed line), consistent with a log-normal size dependence. For details of statistical significance tests, see Supplementary Information 4. c, Variance of the logarithm clone size, σ2(t), as a function of the inferred oestrous cycle number for luminal (black) and basal (blue) WT (left) and Brca1;Trp53 (right) confetti clones. Points show data from individual mice and lines (dashed) show a fit to a linear growth characteristic, as predicted by a minimal model of clonal fate based on stochastic growth and regression (main text and Supplementary Information 4). d, Average of the logarithm clone size, μ(t), as a function of the inferred oestrous cycle number for luminal (black) and basal (blue) WT (left) and Brca1;Trp53 (right) confetti clones. Points show data collected from individual mice and lines (dashed) show a fit to a linear growth characteristic, as predicted by a minimal model. See Supplementary Information 1 for sample sizes and statistics for ad. Source Data
Fig. 4
Fig. 4. Clonal expansion beyond MaSC-descendant units by local remodelling.
a, 3D views of mammary ducts showing EdU incorporation over 1 week in oestrous-cycling mice (top, three mice) and after ovariectomy (bottom, five mice), stained for CK8 and SMA. b, Ripley cluster analysis of EdU+ cell clusters along mammary ducts in cycling (green) and ovariectomized (black) mice. Data are mean ± s.e.m., five regions per mouse, three cycling mice, five ovariectomized mice. c, Branching dynamics in KikGR mice imaged through a mammary imaging window over 1 week. Representative examples of side branch expansion and regression are shown as indicated, n = 5 mice. d, Schematic of the repeated skin-flap procedure to visualize the mammary tree using intravital microscopy. e, Top panels show in vivo overviews of the fourth mammary gland of a R26-mTmG mouse at 3 (left) and 6 months of age (right) during oestrus. Bottom panels show outlines of the ductal tree with the main ducts in blue and side branches in red. Representative of four animals. f, Top panels show in vivo confocal images of the ductal area (red box in b) at 3 (left) and 6 months of age (right). Bottom panels show outlines with the main ducts in blue and side branches in red. gj, Quantification of segment length of ducts (g), tertiary branch length (h) and tertiary branch complexity (i) at 3 and 6 months of age. j, Difference (Δ) in the number of tertiary branches between 6 and 3 months of age. Data derived from i. Colours indicate different mice, lines connect measurements of the same structures. Significance tested using a paired t-test, two-sided. See Supplementary Information 1 for more sample sizes, P values and statistics. Scale bars, 100 μm (a), 500 μm (c,e,f). Source Data
Fig. 5
Fig. 5. Field clonalization and cancerization are abolished in the absence of the oestrous cycle.
a, Luminal (cyan) and basal (blue) WT confetti clone sizes in the homeostatic gland (left, same as Fig. 2c), and after ovariectomy (right). b,c, Representative whole-mount confocal images of luminal WT confetti clones 120 days (b) and 225 days (c) after recombination in ovariectomized mice (n ≥ 3 mice per condition). Luminal cells are labelled with ECAD (b), basal cells are labelled with SMA (c). Images depict 3D rendering of Z-stacks, unless otherwise indicated. d, Luminal (cyan) and basal (blue) Brca1;Trp53 confetti clone sizes in the oestrous-cycling condition (left, same as Fig. 2c), and after ovariectomy (right). e,f, Representative whole-mount confocal images of luminal Brca1;Trp53 confetti clones 120 (e) and 225 days (f) after recombination in ovariectomized mice (n ≥ 3 mice per condition). Luminal cells labelled with ECAD (e), basal cells labelled with SMA (f). Images depict 3D rendering of Z-stacks, unless otherwise indicated. g, Surviving clone fraction in ovariectomized mice as function of time normalized to the average number of confetti+ cells at 14 days. Error bars represent mean ± s.e.m. h, Non-transformed luminal or basal clones (grey) and transformed luminal clones (orange) in the ovariectomized Brca1;Trp53 confetti mouse model. i, Transformed luminal (L, orange) and basal (B, red) clones as percentages of the total number of luminal or basal clones, respectively, in the cycling and ovariectomized conditions. Each dot indicates an individual mouse. a,d,h, Clone numbers are indicated. a,d,i, Boxplots mark 25th and 75th percentile, the line indicates median and the whiskers mark minimum and maximum values. Significance was tested using a two-sided Mann–Whitney test, ****P < 0.0001. See Supplementary Information 1 for more sample sizes, P values and statistics. Scale bars, 100 µm. Source Data
Extended Data Fig. 1
Extended Data Fig. 1. Stochastic recombination in the Brca1fl/fl;Trp53fl/fl;R26R-Confetti mouse model.
a, Quantification of the total number of Brca1;Trp53 confetti clones after TAT-Cre mediated recombination in at least 4 different 4th mammary glands derived from different mice. Number of clones was determined by using large tilescans (xyz) of the entire mammary glands (whole-mount) labelled with SMA (basal cells) or ECAD (luminal cells). Luminal clones are depicted in cyan, basal clones are depicted in blue. b, qPCR for the Brca1 allele in sorted confetti-positive cells and sorted confetti-negative cells derived from TAT-Cre recombined Brca1fl/fl;Trp53fl/fl;R26R-Confetti mammary glands and a positive control (Brca1 Δ /Δ) normalized to a non-recombined control (Brca1F/F). The recombined samples demonstrate that the vast majority of confetti-positive cells have fully recombined Brca1 alleles. n = 3 biological replicates. Each dot represents a biological replicate and error bars indicate s.e.m. c, qPCR for the Trp53 allele in sorted confetti-positive cells and sorted confetti-negative cells derived from TAT-Cre recombined Brca1fl/fl;Trp53fl/fl;R26R-Confetti mammary glands and a positive control (Trp53 Δ /Δ) normalized to non-recombined control (Trp53F/F). The recombined samples demonstrate that the vast majority of confetti-positive cells have fully recombined Trp53 alleles. Note that the confetti-negative cells show some loss of the Trp53 allele as well. Each dot represents a biological replicate and error bars indicate s.e.m. n = 3 biological replicates. d, Representative plots depicting the gating strategy to sort the Confetti positive and negative mammary epithelial cells from TAT-Cre recombined Brca1;Trp53;R26R-Confetti mammary glands (left panels) and mammary epithelial cells from non-recombined mammary glands (right panels). Sorted cells were used to determine Brca1 and Trp53 gene levels by qPCR in Extended Data Fig. 1b and c. Numbers in panels indicate order of gating. The Brca1;Trp53 mammary cells in the RFP-CFP- gate in panel 5 were selected to sort GFP_YFP+ and Confetti- cells in panel 6. e, 3D rendering of a Z-stack confocal image of a whole-mount Brca1;Trp53 confetti mammary gland 225 days after recombination labelled with SMA, confetti clones are represented in their respective colours. Brca1;Trp53 mutant confetti clones are distributed throughout the mammary ductal tree and span large areas of the ducts without changing the ductal morphology. Note the recruitment of SMA-positive stromal cells near the GFP clone in panel 1. Scale bar represents 1 mm (overview image) and 100 µm (panel 1 and 2). Representative image of n = 6 mice. Source Data
Extended Data Fig. 2
Extended Data Fig. 2. Characterization of Brca1;Trp53 confetti clones using antibody labelling in intact mammary glands.
a, b, Whole-mount confocal images (3D rendering of a Z-stack in top panels and a representative 2D section of the Z-stack in the bottom panel) of luminal Brca1;Trp53 confetti cells. Luminal confetti cells show overlap with E-cadherin (ECAD) labelling (a) and no overlap with alpha-smooth muscle actin (SMA) expression (b) depicted in white. Scale bars represent 100 µm. c, d, Whole-mount confocal images (3D rendering of a Z-stack in top panels and a representative 2D section of the Z-stack in the bottom panel) of basal Brca1;Trp53 confetti cells. Basal confetti cells show no overlap with E-cadherin (ECAD) labelling (c) and overlap with alpha-smooth muscle actin (SMA) expressing cells (d) depicted in white. Scale bars represent 100 µm. e, f, Representative whole-mount confocal images (3D rendering of a Z-stack) showing luminal (e) and basal (f) Brca1;Trp53 confetti cells that expanded within the ducts leading to clonal fields of mutant cells without morphological transformation of the ducts. Ducts are labelled with SMA, depicted in white. Scale bars represent 100 µm (e, left top panel) or 1 mm (other panels). g, Tumour growth dynamics of palpable transformed lesions within the Brca1;Trp53 confetti model after recombination. h, Representative whole-mount confocal image (3D rendering of a Z-stack) showing a Brca1;Trp53 luminal confetti clone that expanded within the ducts leading to transformation of the ductal morphology (hyperbranching), including local invasion (white arrows denote Brca1;Trp53 RFP cells within the stroma). Ducts are labelled with SMA, depicted in white. Scale bar represents 1 mm. All images represent n ≥ 4 biological repeats (mice).
Extended Data Fig. 3
Extended Data Fig. 3. Genomic alterations in Brca1;Trp53 confetti clones and end stage tumours.
a, DNA copy number profiles in untransformed (top) and transformed (middle) Brca1;Trp53 confetti clones 225 days after Cre-recombination, and in Brca1;Trp53 end-stage tumours (bottom). b, Example of genomic events that occur early in Brca1;Trp53 tumorigenesis. DNA copy number profiles of chromosome 12 showing genomic losses that are found in early transformed and untransformed Brca1;Trp53 clones, as well as in end-stage tumours. c, Example of genomic events occurring late in Brca1;Trp53 tumorigenesis. DNA copy number plots of chromosome 6 showing copy number changes that are unique to end-stage Brca1;Trp53 tumours, but not found in early clones. All plots show averages of 3 mice (225d timepoint: 13 transformed clones and 13 untransformed clones) and 10 mice (end-stage tumours).
Extended Data Fig. 4
Extended Data Fig. 4. Recombination of wild-type confetti clones with TAT-Cre or tamoxifen results in similar labelling efficiencies.
a, Schematic representation of the R26R-Confetti construct (left), which was recombined sporadically through an intraperitoneal injection with a low dose of tamoxifen in the presence of R26-CreERT2 (R26R-Confettihet;R26-CreERT2het mouse model), which is the gold standard method, or through intraductal injection of TAT-Cre recombinant protein. b, Confocal overview image of a whole-mount 4th mammary gland derived from a R26R-Confettihet;R26-CreERT2het adult female mouse 14 days after tracing initiation by tamoxifen-mediated recombination. Zooms show ducts containing single confetti-labelled cells of both basal and luminal origin, representative of the initial labelling density after tracing initiation. Ductal tree is stained with alpha-smooth muscle actin (SMA) depicted in white, which marks the basal cell layer. Scale bar left image represents 1 mm, scale bar right images represents 100 µm. c, Quantification of the confetti-positive cell fraction 14 days after tamoxifen-mediated recombination. Each dot represents the fraction of recombined cells in a randomly selected area within each mammary gland of approximately 1 ×1 mm, n = 6 glands derived from 6 different mice. Basal cells are normalized to the total number of basal cells in the selected area (blue dots) and luminal cells are normalized to the total number of luminal cells in the selected area (cyan dots). Error bar represents mean ± s.d. d, Confocal overview image of a whole-mount 4th mammary gland derived from a R26R-Confettihet adult female mouse, 14 days after tracing initiation recombined by the TAT-Cre intraductal injection method. Zooms show ducts containing single confetti-labelled cells of both basal and luminal origin, representative of the initial labelling density after tracing initiation. Ductal tree is stained with E-cadherin (ECAD) depicted in white, which marks the luminal cell layer. Scale bar left image represents 1 mm, scale bar right images represents 100 µm. e, Quantification of the confetti-positive cell fraction 14 days after TAT-Cre-mediated recombination for basal (blue dots) and luminal (cyan dots) cells. Each dot represents the fraction of recombined cells in a randomly selected area within each mammary gland of approximately 1 ×1 mm, n = 3 glands derived from 3 different mice. Error bar represents mean ± s.d. Note that recombination efficiencies of luminal and basal cell populations are similar between the tamoxifen- and TAT-Cre-induced recombination techniques. Both induction methods result in the recombination of approximately one labelled cell for every 100–200 cells. As the Confetti construct comprises four distinct colours, there is, on average, one cell labeled with a confetti colour per 400–800 cells. Considering that a MaSC-progeny unit consists of approximately 5 to 10 cells, a single confetti-labeled cell is induced in 1 out of 40–80 units. Importantly, over time, many clones become extinct (Fig. 2d), leading to a dilution in the number of clones and making collisions even less likely. Source Data
Extended Data Fig. 5
Extended Data Fig. 5. Wild-type and Brca1;Trp53 basal and luminal confetti cells form large cohesive clones spanning multiple ducts and branch points.
a, b, Representative whole-mount confocal images of wild-type luminal confetti clones (a) and wild-type basal confetti clones (b) showing extensive field clonalization within the existing ductal structure. Ducts are labelled with alpha-smooth muscle actin (SMA), confetti fluorophores are represented in their respective colours. Scale bars represent 100 µm. Images in a and b represent n ≥ 3 biological repeats (mice). c, Representative whole-mount confocal images (3D rendering of Z-stacks) of basal Brca1;Trp53 confetti clones at different timepoints after recombination showing clonal expansion within the ductal tree over a period of 225 days. Ducts are labelled with SMA. d, Representative whole-mount confocal images of wild-type basal confetti clones showing extensive field clonalization within the existing ductal structure over a period of 225 days. Ducts are labelled with Keratin 14 (KRT14). c, d, Persisting clones form cohesive clusters of cells spanning multiple ducts and branch points. Scale bars represent 100 µm. e, f, Quantification of clone sizes in the Brca1;Trp53 and wild-type confetti conditions at different timepoints after tracing initiation for the luminal (e) and basal (f) clones separately. The number of quantified clones is indicated within the graph, transformed clones are shown in orange (luminal) and red (basal). Boxplots mark the 25th and 75th percentile, line indicates the median, and whiskers mark the minimum and maximum values. Significance was tested using a two-sided Mann-Whitney test, * P < 0,05, ** P < 0.01, **** P < 0.0001. Same data as depicted in Fig. 2c. See Supplementary Information 1 for more sample sizes, P values and statistics for e and f. Source Data
Extended Data Fig. 6
Extended Data Fig. 6. Wild-type clone sizes transiently increase during each oestrous cycle.
a, Schematic depicting the cellular basis of the cell-based model of mammary epithelial turnover (see also Extended Data Fig. 9b). Note that, during one round of oestrous cycle, some clones are collectively lost (e.g., yellow and green clone), while others expand (e.g., blue and red clones). b, Quantification of wild-type confetti+ clone sizes during oestrus (O) and dioestrus (D) stage 120 days after lineage tracing initiation, demonstrating a temporary increase of clone sizes during dioestrus stage. n = 3 mice for oestrus stage (300 luminal clones, 101 basal clones) and n = 3 mice for dioestrus stage (43 luminal clones, 9 basal clones). Error bars represent mean ± s.d. Significance was tested using a two-sided Mann-Whitney test, **** P < 0.0001. c, Representative whole-mount confocal images of wild-type confetti+ clones 120 days after lineage tracing initiation during oestrus (left panels) and dioestrus stage (right panels). Both luminal (top panels) and basal clones (bottom panels) show an increase in clone size during dioestrus stage. Confetti-labelled cells are depicted in their respective colour, and the mammary ducts are labelled with Keratin 14 (KRT14) or Phalloidin in white. Scale bars represent 100 µm. Source Data
Extended Data Fig. 7
Extended Data Fig. 7. Spatial and size distribution of wild-type confetti clones in the mammary gland.
a, Representative confocal overview image of a whole mount 5th mammary gland after 550 days of lineage tracing, illustrating the distribution of wild-type confetti clones within the ductal tree. Images depict 3D-rendering of Z-stacks, with the confetti labelled cells in their respective colour and the mammary ducts labelled with Keratin 14 (KRT14) shown in white. Scale bars represent 1 mm (left panel), 100 µm (panel 1 and 2), and 50 µm (panel 3 and 4). Representative image of n = 8 glands from 4 biological repeats (mice). b, Branch levels are defined as the number of branch points starting from the main duct close to the nipple. c, Quantification of the wild-type confetti clone size by branch level. Each dot represents a clone, cyan dots for luminal clones and blue dots for basal clones. Line indicates linear regression of the luminal and basal clone sizes with R2, slope and 95% confidence interval of the slope indicated in the graph, n = 6 glands from 3 mice. d, Number of wild-type confetti clones represented by bars for each branch level after 550 days of tracing in n = 6 glands from 3 mice. Source Data
Extended Data Fig. 8
Extended Data Fig. 8. Wild-type and Brca1;Trp53 confetti clones follow a log-normal distribution.
a, b, Cumulative distribution of luminal (a) and basal (b) wild-type confetti clone size as a function of the scaled clone size n/⟨n⟩, where ⟨n⟩ denotes the average clone size. To account for the impact of large-scale mouse-to-mouse variability in clone size, curves are shown for a representative set of individual mice (shown in Fig. 3a, b) with corresponding distributions shown for all mice in Supplementary Information 4. Note that the data does not show evidence for collapse towards a statistical scaling behavior, as would be predicted for clonal dynamics based on local stochastic stem cell loss and replacement (see main text and Supplementary Information 4). n ≥ 3 mice per time point. c, Cumulative distribution of wild-type (left) and Brca1;Trp53 (right) basal confetti clone size showing the probability of finding a clone larger than the given size (log scale) across time points. To account for the impact of large-scale mouse-to-mouse variability in clone size, the curves are shown for a representative set of individual mice with corresponding distributions shown for all mice in Supplementary Information 4. n ≥ 3 mice per time point. d, Rescaled cumulative distribution of the logarithm of wild-type (left) and Brca1;Trp53 (right) basal confetti clone size, ln n, showing the probability of finding a clone with a size larger than (lnnμ)/σ, where μ=lnn denotes the average of the logarithm of clone size and σ2=(lnnlnn)2 represents the variance. Points show data from panel (d). Once rescaled, data from different time points collapse onto a single curve that fits well with the scaling function (1/2)erfc(x/2) (dashed line), consistent with a log-normal size dependence (see main text). For details of statistical significance tests, see Supplementary Information 4. e, Average luminal clone size as a function of the inferred oestrous cycle number for wild-type confetti clones. Points show data from individual mice and line shows the theoretical prediction of the model. (Note that the average of the logarithm of clone size is not the same as the logarithm of the average.) f, Fraction of single-cell luminal wild-type confetti clones as a function of inferred oestrous cycle number. Points show data and line (dashed) shows theoretical prediction of the model based on the fits in Fig. 3c, d. Bars in e and f denote mean values +/− SEM. For details of the model, the model fits, and the inference of oestrous cycle number, see main text and Supplementary Information 4. Source Data
Extended Data Fig. 9
Extended Data Fig. 9. Fits and predictions of the phenomenological theory of the turnover of the mammary gland epithelium.
a, Simulation of unclustered and clustered data analyzed with the Ripley’s K analysis leading to the Ripley’s L function. Two datasets were used for the analysis; 50 points from a uniform random distribution and 50 points from a normal distribution were generated for the clustered simulation, 100 random points from a uniform random distribution for the unclustered simulation. Details on the code and data can be found at https://github.com/BioImaging-NKI/qupath_ripley. b, Schematic depicting spatial model of ductal turnover (for details, see Supplementary Information 4). The mammary ductal epithelium is represented as a one-dimensional lattice. During the oestrous cycle, random non-overlapping domains of size l cells are turned over so that the central domain of l/2 cells are lost and replaced by the stochastic expansion of the 2 × l/4 neighboring sites. Through iterations of this process, clones are continuously lost, while others expand. Once clones extend beyond the size of the activated domain, l, their further expansion proceeds as a process of stochastic expansion and contraction on the clone boundary. c, 3D-rendering of confocal Z-stacks (overview image) and single Z-plane (zoom images) showing full labelling of two luminal lineages in the same part of the mammary gland after 550 days of lineage tracing; a PR+ clone labelling all PR+ luminal cells in this region (confetti RFP), and a PR clone labelling all PR in this part of the mammary gland (confetti YFP). PR+ luminal cells are shown in white, confetti YFP cells are shown in green. Scale bars represent 50 µm (overview image) and 10 µm (zoom images). Representative example of n = 3 mice. d, Quantification of ratio between Ki-67+ (proliferative) and cleaved caspase3+ (CC3) cells within organoids derived from wild-type (WT) or Brca1;Trp53 confetti+ mammary epithelial cells, 64 and 225 days post-recombination. Each dot represents an organoid (n = 33 organoids for WT condition, n = 30 organoids for the Brca1;Trp53 64 days condition, and n = 74 organoids for the Brca1;Trp53 225 days condition. Violin plots depict distribution of data points, horizontal lines denote median, 1st and 3rd quartile. Significance was tested using a two-sided Mann Whitney Test, *** P < 0.0005, **** P < 0.0001, ns P = 0.1572. e, Quantification of luminal (cyan dots) and basal (blue dots) wild-type confetti clones (left) and Brca1;Trp53 confetti clones (right) in the ducts and side branches, represented on a logarithmic scale. For each timepoint at least n = 6 glands from 3 mice were analyzed. Morphologically transformed clones are indicated in orange (luminal clones) and red (basal clones). Boxplots mark the 25th and 75th percentile, line indicates the median, and whiskers mark the minimum and maximum values. Significance was tested using a two-sided Mann-Whitney test, **** P < 0.0001. f, Transformed luminal (L, orange) and basal (B, red) clones in the ducts and side branches as percentage of the total number of luminal or basal clones respectively. Each dot indicates an individual mouse and boxplots mark the 25th and 75th percentile, line indicates the median, and whiskers mark the minimum and maximum values. Significance was tested using a two-sided Mann-Whitney test, ** P < 0.01. g, Cumulative distribution of the logarithm of clone size, ln n, obtained from the spatial cell-based model in (b) showing the probability of finding a clone with a size larger than (lnnμ)/σ, where μ and σ2 are obtained from a least-square fit of the data for n < l/2 to the log-normal size dependence, (1/2)erfc(x/2) (dashed line) (cf. Fig. 3b and Extended Data Fig. 8d). Here, each lattice site is associated with a renewing MaSC with a total domain size of l=1000 lattice sites. The points show the results of stochastic simulation of the spatial model (averaged over an ensemble of 1000 realizations of the model on a periodic lattice of 106 sites) for different numbers of oestrous cycles. In line with the quantitative analysis of the experimental data, the activation rate of domains is taken as 0.1 per oestrous cycle, with a loss probability set by the model of 0.5. For further details of the spatial model, see Supplementary Information 4. The code can be obtained from https://github.com/BenSimonsLab/Ciwinska_Nature_2024. Note that, at large time scales, the data departs from a log-normal size dependence. h, When plot on a log scale, the cumulative distribution of clone size shows the suppression at size scales in excess of the domain size l/2, a manifestation of the constraints imposed by the one-dimensional geometry of the ductal network. Points show the results of stochastic simulation and lines show the corresponding fits to the log-normal size dependence obtained from the fits in panel g. i, j, Cumulative distribution of luminal clone size for wild-type (i) and Brca1;Trp53 (j) confetti clones for mice showing the largest effective oestrous cycle number from the 225 and 64 day time points, respectively (see Supplementary Information 4). Points show data and lines show the least-squares fits to a log-normal size dependence at small clone sizes. The respective colours are matched to the data shown in Supplementary Information 4. Note that, when plot on a log scale, the data reveals a departure from a log-normal size dependence, with a suppression at the largest clone sizes, mirroring the behavior of the spatial model (h). See Supplementary Information 1 for more sample sizes, P values and statistics for e and f. Source Data
Extended Data Fig. 10
Extended Data Fig. 10. Pregnancy and lactation do not increase the spread of Brca1;Trp53 mutant clones.
a, Schematic depicting the experimental timeline of the pregnancy and lactation experiments in induced Brca1;Trp53 confetti glands. b, Quantification of Brca1;Trp53 confetti clone sizes in nulliparous (left) and parous (right) glands, 120 days after recombination and lineage tracing initiation represented on a logarithmic scale. For each timepoint, at least n = 3 glands from 3 different mice were analyzed. Boxplots mark the 25th and 75th percentile, line indicates the median, and whiskers mark the minimum and maximum values. Significance was tested using a two-sided Mann-Whitney test, **** P < 0.0001. c, Transformed luminal (L, orange) and basal (B, red) clones as a percentage of the total number of luminal or basal clones respectively. Each dot indicates an individual mouse and boxplots mark the 25th and 75th percentile, line indicates the median, and whiskers mark the minimum and maximum values. n = 5 mice (nulliparous) and n = 3 mice (parous). d, Representative whole-mount confocal images of Brca1;Trp53 confetti clones in parous glands (one pregnancy-involution cycle), 120 days after recombination. Luminal cells are labelled with E-cadherin (ECAD), basal cells are labelled with alpha-smooth muscle actin (SMA). Images depict 3D-rendering of Z-stacks. Scale bars represent 100 µm. Representative image of n = 3 biological repeats (mice). See Supplementary Information 1 for more sample sizes, P values and statistics for b, c. Source Data
Extended Data Fig. 11
Extended Data Fig. 11. Ovariectomy abolishes field clonalization and cancerization of basal and luminal cell clones.
a, b, Clone size quantification of luminal (a) and basal (b) wild-type confetti clones in the homeostatic gland (left), and after ovariectomy (right) represented on a logarithmic scale. Ovariectomy abolishes clonal expansion and field clonalization. Same data as Fig. 5a, but now with basal and luminal clones presented in separate graphs. For each timepoint at least n = 6 glands from 3 different mice were analyzed. Analyzed number of clones for each timepoint are indicated in the graphs. Boxplots mark the 25th and 75th percentile, line indicates the median, and whiskers mark the minimum and maximum values. Significance was tested using a two-sided Mann-Whitney test, *** P < 0.001, **** P < 0.0001. c, d, Clone size quantification of luminal (c) and basal (d) Brca1;Trp53 confetti clones in the presence of oestrous cycling (left) and after ovariectomy (right) represented on a logarithmic scale. Ovariectomy abolishes clonal expansion and field cancerization. Same data as Fig. 5d, but now with basal and luminal clones presented in separate graphs. For each timepoint at least n = 6 glands from 3 different mice were analyzed. Analyzed number of clones for each timepoint are indicated in the graphs. Boxplots mark the 25th and 75th percentile, line indicates the median, and whiskers mark the minimum and maximum values. Significance was tested using a two-sided Mann-Whitney test, *** P < 0.001, **** P < 0.0001. e, f, Representative whole-mount confocal images of basal wild-type confetti clones 120 days (e) and basal and luminal wild-type confetti clones 225 days (f) after recombination in ovariectomized condition. Luminal cells are labelled with E-cadherin (ECAD) (e), basal cells are labelled with alpha-smooth muscle actin (SMA) (f). Images depict 3D-rendering of Z-stacks, unless otherwise indicated. Scale bars represent 100 µm, except for the scale bar in 2D section (e) which represents 10 µm. Representative images of n = 3 biological repeats (mice). g, h, Representative whole-mount confocal images of basal Brca1;Trp53 confetti clones 120 days (g) and 225 days (h) after recombination in ovariectomized condition. Luminal cells are labelled with E-cadherin (ECAD) (g), basal cells are labelled with alpha-smooth muscle actin (SMA) (h). Images depict 3D-rendering of Z-stacks, unless otherwise indicated. Scale bars represent 100 µm. Representative images of n = 3 biological repeats (mice). See Supplementary Information 1 for more sample sizes, P values and statistics for a-d. Source Data
Extended Data Fig. 12
Extended Data Fig. 12. Tissue protection mechanisms against field cancerization in the mammary gland.
a, b, Cumulative distribution of luminal (a) and basal (b) clone size of ovariectomized wild-type confetti mice showing the probability (log scale) of finding a clone larger than the given size across a range of time points. c, d, Cumulative distribution of luminal (c) and basal (d) clone size of ovariectomized Brca1;Trp53 confetti mice showing the probability (log scale) of finding a clone larger than the given size across a range of time point. e, Model depicting how tissue protection mechanisms drive field cancerization in the mammary gland. The mammary ductal epithelium confers several layers of protection against field cancerization by mutant cells. Protection mechanism #1: The ductal epithelial network is supported by a short, lineage-restricted MaSC-descendant cell hierarchy. As a result, the majority of mutant cells will be lost through homeostatic tissue turnover, and only a few mutations rooted in the stem cell compartment can survive in the medium term. Protection mechanism #2: Local stem cell loss and replacement driven by the oestrous cycle leads to large-scale elimination of the majority of mutant stem cell clones over time. This large-scale clonal loss occurs at the expense of an accelerated (exponential-like) expansion of the minority of clones that survive, allowing them to colonize large areas of the epithelium. Protection mechanism #3: Once clones extend beyond the size of regions activated during the oestrous cycle, their expansion becomes limited by the one-dimensional geometry of the ducts, a phenomenon that is particularly effective in restricting mutant clone expansion. Source Data

Similar articles

Cited by

References

    1. Cereser, B. et al. The mutational landscape of the adult healthy parous and nulliparous human breast. Nat. Commun.14, 5136 (2023). - PMC - PubMed
    1. Hutten, S. J. et al. Ductal carcinoma in situ develops within clonal fields of mutant cells in morphologically normal ducts. J. Pathol.263, 360–371 (2024). - PubMed
    1. Martincorena, I. & Campbell, P. J. Somatic mutation in cancer and normal cells. Science349, 1483–1489 (2015). - PubMed
    1. Kuchenbaecker, K. B. et al. Risks of breast, ovarian, and contralateral breast cancer for BRCA1 and BRCA2 mutation carriers. JAMA317, 2402 (2017). - PubMed
    1. Ford, D., Easton, D. F., Bishop, D. T., Narod, S. A. & Goldgar, D. E. Risks of cancer in BRCA1-mutation carriers. Lancet10.1016/S0140-6736(94)91578-4 (1994). - PubMed

MeSH terms

LinkOut - more resources