. 2024 Sep;633(8030):624-633.
doi: 10.1038/s41586-024-07805-2. Epub 2024 Sep 4.

Frontostriatal salience network expansion in individuals in depression

Affiliations

Frontostriatal salience network expansion in individuals in depression

Charles J Lynch et al. Nature. 2024 Sep.

Abstract

Decades of neuroimaging studies have shown modest differences in brain structure and connectivity in depression, hindering mechanistic insights or the identification of risk factors for disease onset1. Furthermore, whereas depression is episodic, few longitudinal neuroimaging studies exist, limiting understanding of mechanisms that drive mood-state transitions. The emerging field of precision functional mapping has used densely sampled longitudinal neuroimaging data to show behaviourally meaningful differences in brain network topography and connectivity between and in healthy individuals2-4, but this approach has not been applied in depression. Here, using precision functional mapping and several samples of deeply sampled individuals, we found that the frontostriatal salience network is expanded nearly twofold in the cortex of most individuals with depression. This effect was replicable in several samples and caused primarily by network border shifts, with three distinct modes of encroachment occurring in different individuals. Salience network expansion was stable over time, unaffected by mood state and detectable in children before the onset of depression later in adolescence. Longitudinal analyses of individuals scanned up to 62 times over 1.5 years identified connectivity changes in frontostriatal circuits that tracked fluctuations in specific symptoms and predicted future anhedonia symptoms. Together, these findings identify a trait-like brain network topology that may confer risk for depression and mood-state-dependent connectivity changes in frontostriatal circuits that predict the emergence and remission of depressive symptoms over time.


Conflict of interest statement

C.L. and C.J.L. are listed as inventors for Cornell University patent applications on neuroimaging biomarkers for depression which are pending or in preparation. C.L. has served as a scientific advisor or consultant to Compass Pathways PLC, Delix Therapeutics and Brainify.AI. The remaining authors declare no competing interests.

Figures
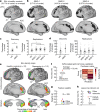
Fig. 1
Fig. 1. Frontostriatal salience network is expanded nearly twofold in the cortex of highly sampled individuals with depression.
a, The salience network (black) has representation in LPFC, ACC and AI. b, The salience network in three representative individuals from the dataset referred to here as serial imaging of major depression (SIMD). c, The salience network was 73% larger on average in the SIMD dataset (significance assessed using a permutation test, *P = 0.001, Bonferroni correction, Z-score = 6.19). This effect was replicated thrice (two-tailed independent sample t-tests, n = 48 from Weill Cornell Medicine, MDD-1: T = 3.54, *P = 0.01, Bonferroni correction, Cohen’s d = 0.72; another sample of n = 45 from Weill Cornell Medicine, MDD-2: T = 4.17, *P = 0.002, Bonferroni correction, Cohen’s d = 0.84; n = 42 from Stanford University, MDD-3: T = 3.68, *P = 0.008, Bonferroni correction, Cohen’s d = 0.77). Data are presented as mean ± s.d. d, No significant group differences in salience network representation in the striatum were observed in either the discovery (two-tailed permutation test, P = 0.07, uncorrected) or replication datasets (two-tailed independent sample t-tests, all P > 0.43, uncorrected). Data are presented as mean ± s.d. e, Density maps confirm that spatial locations of salience network nodes were similar in healthy controls and individuals with depression but that network borders extended further outwards from their centroids in each cortical zone in depression (red boxes). f, An SVM classifier distinguished individuals with depression from healthy controls above chance (accuracy 78.4%, significance assessed using a permutation test, P = 0.001) using the size of each functional network as features. g, Linear predictor coefficients (β) associated with the trained model. h, Change in model accuracy after exclusion of each network. Both g and h indicate that salience network size was the most important feature. ACC, anterior cingulate; AI, anterior insular cortex; Cd, caudate; HC, healthy controls; LPFC, lateral prefrontal; NAc, nucleus accumbens; PU, putamen; SAL, salience network; SVM, support vector machine.
Fig. 2
Fig. 2. Three modes of salience network expansion in depression.
a, Mode functional brain network assignments in cortex and striatum in HC. b, Salience network in a representative individual (SIMD-4) with depression. c, The parts of the salience network of each individual with depression that did and did not overlap with the HC are referred to as non-encroaching and encroaching, respectively. d, Salience network expansion more often due to shifts in network borders than ectopic intrusions—isolated patches of salience network in atypical locations (two-tailed paired sample t-test, *P < 0.001, n = 141). Data are presented as mean ± s.d. e, The parietal subnetwork of the DMN (red), FP (yellow) and CO (purple) networks were most frequently displaced by salience network expansion. f, Salience network expansion affected different functional networks in different cortical zones. In the AI, the FP (T = 5.94, *P < 0.001) and CO (T = 6.42, *P < 0.001), networks were more affected than the default mode network. In the ACC, the DMN was more affected than either the FP (T = 17.53, *P < 0.001) or CO/action-mode (T = 15.25, *P < 0.001) networks. Finally, in LPFC, the FP was more affected than either the DMN (T = 9.31, *P < 0.001) or CO (T = 6.33, *P < 0.001). Statistical significance was assessed using two-tailed two-sample t-tests; all P values are Bonferroni corrected, n = 141. Data are presented as mean ± s.d. g, Individuals with depression clustered using their encroachment profiles (the relative contribution of each functional network to the total surface area of the encroaching portion of their salience network) revealed three distinct modes of encroachment across individuals. CO, cingulo-opercular; DMN, default mode; FP, frontoparietal.
Fig. 3
Fig. 3. Salience network expansion is stable over time and present before symptom onset.
a, Cortical representation of the salience network was stable in repeatedly scanned healthy controls (left) and individuals with depression (right). The first ten study visits for each individual are shown for visualization purposes. b, Salience network in a representative individual with depression that was scanned longitudinally to sample different mood states. c, No significant correlation between the severity of depressive symptoms (HDRS6) and salience network size in any repeatedly sampled individual with depression from the SIMD sample (Pearson correlation, all P > 0.63, two-tail test). d, No significant change in salience network size after a course of either a traditional 6-week (two-tailed paired sample t-test, T = 0.58, P = 0.55, uncorrected, n = 90) or accelerated 1-week (two-tailed paired sample t-test, T = 0.58, P = 0.56, uncorrected, n = 45) course of repetitive transcranial magnetic stimulation (rTMS). Data are plotted as mean ± s.d. e, Individual differences in salience network size were not significantly correlated with depression severity (HDRS6, Pearson correlation, r = 0.04, P = 0.63, uncorrected, two-tailed test). f, The number of depressive episodes experienced (inferred from the Mini-International Neuropsychiatric Interview) in each individual’s lifetime in relation to the size of their salience network. Data are plotted as mean ± s.d. g, Children from the ABCD study scanned before the onset of elevated depression symptoms were identified (ABCD-MDD). Depression symptoms were operationalized using the DSM-oriented scale for depression from the CBCL (T-scores ≥70 are in the clinical range). The salience network was significantly larger in children who later developed clinically elevated symptoms of depression compared to children who did not (two-tailed independent sample t-test, T = 3.50, *P < 0.001, Cohen’s d = 0.62, n = 114). Data are plotted as mean ± s.d. NS, not significant; Sx,  symptom; Tx, treatment.
Fig. 4
Fig. 4. Frontostriatal salience network connectivity predicts fluctuations in anhedonia and anxiety symptoms in deeply sampled individuals with depression over time.
a, Heat map summarizing fluctuations in individual items selected from a variety of clinical interviews and self-report scales related to anhedonia symptoms in a deeply sampled individual with depression (SIMD-4). Clinical data were resampled to days for visualization purposes (black dots mark the study visits). b, Frontostriatal nodes of the salience network in SIMD-4. c, Correlation matrices summarizing the association between FC strength between different cortico-striatal salience network nodes and fluctuations in the severity of anhedonia-related symptoms in both SIMD-4 and SIMD-6. d, FC between salience network nodes in the NAc and ACC most closely tracked fluctuations in the severity of anhedonia-related symptoms in both SIMD-4 (Pearson correlation, r = −0.37, P = 0.003) and SIMD-6 (Pearson correlation, r = −0.49, P = 0.001) across study visits. Statistical significance was assessed using two-tailed permutation tests with circular rotation to preserve temporal autocorrelation. e, Cross-correlation analyses indicated NAc ←→ ACC FC also predicted the severity of anhedonia-related symptoms at the following study visit in SIMD-4 (Pearson correlation, significance tested by means of permutation test, r = −0.32, *P = 0.004) but not in SIMD-6. f, No significant correlation between individual differences in salience network NAc ←→ ACC FC strength and the severity of anhedonia-related symptoms across individuals (assessed using SHAPS, Pearson correlation, r = 0.09, P = 0.41). g, In SIMD-4 and SIMD-6, salience network NAc ←→ ACC FC was not significantly related to fluctuations in the severity of other depressive symptoms, such as anxiety. h, In contrast, FC between the NAc and AI was most closely related to fluctuations in the severity of anxiety-related symptoms (Pearson correlations, SIMD-4: r = −0.29, P = 0.02; SIMD-6: r = −0.45, P = 0.004, two-tailed tests), indicating different patterns of functional connectivity relate to different symptoms. FC, functional connectivity. AI, anterior insula; NAc, nucleus accumbens.
Extended Data Fig. 1
Extended Data Fig. 1. Serial Imaging of Major Depression.
a, The SIMD project involved repeated multi-echo resting-state fMRI scans (ME-rsfMRI) and clinical assessments of six individuals with depression over long periods of time. Precision functional mapping was then used to 1) investigate differences in functional network topology, specifically size relative to healthy controls, and 2) identify which atypical aspects of network topology or connectivity are stable versus sensitive to mood state within individuals as the severity of their symptoms fluctuated, and they cycled in and out of depressive episodes. Images created with BioRender.com. b, The relative contribution (size) of each functional network to the total cortical surface area was obtained by taking the total surface area of all network vertices in relation to the total cortical surface area. This approach controls for fact that each cortical vertex represents a different amount of surface area (SA). In the striatum, where each voxel represents the same amount of tissue, the relative contribution of each functional network to the total striatal volume was calculated by taking the total number of network voxels in relation to the total striatal voxels.
Extended Data Fig. 2
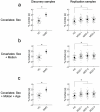
Extended Data Fig. 2. Salience network expansion in depression remains statistically significant when controlling for sex ratio imbalance, and individual differences in head motion and age.
a, Salience network size was regressed against sex (a variable of non-interest that differs between the two groups) and group comparisons were repeated using the residuals (e). The salience network was still significant larger in the Serial Imaging of Major Depression (SIMD; two-tailed independent sample t-test, P < 0.001, T = 7.02, and Cohen’s d = 2.09) and in all three replication samples (two-tailed independent sample t-tests, all P < 0.001, T’s > 3.00, and Cohen’s d > 0.6) relative to healthy controls. b-c, This analysis was repeated when also including head motion (operationalized as the % of volume retained after motion censoring) and age (in years) as additional covariates. In all of these models, the salience network remained significantly larger in the SIMD (two-tailed, independent sample t-test, P < 0.001, T = 6.75, and Cohen’s d = 2.06) and in all three replication samples (two-tailed independent sample t-tests, all P’s ≤ 0.002, T’s > 2.2, and Cohen’s d > 0.56) relative to healthy controls. All error bars represent standard deviation.
Extended Data Fig. 3
Extended Data Fig. 3. Expansion of the salience network accompanied by contraction of neighboring functional systems.
a-b, The salience (SAL, black), default mode (DMN, red), frontoparietal (FP, yellow), and cingulo-opercular (CO, purple) networks in a group-average map of healthy controls versus 3 representative individuals with depression. Expansion of the salience network in cortex (see Fig. 1c) was accompanied in some cases by contraction of other functional networks — most notably the cingulo-opercular network (two-tailed permutation test, *P = 0.04, uncorrected, Z-score = 2.09, n = 43), but this effect was not observed in any of the replication samples. All error bars represent standard deviation.
Extended Data Fig. 4
Extended Data Fig. 4. Evidence of salience network expansion in large n group-average datasets.
a, Salience network mapped using two large n group-average data from previous studies of healthy controls occupy 1.27% and 1.98% of cortex. The group-average HCP functional connectivity matrix (which only includes subjects with resting-state fMRI data reconstructed with the r227 recon algorithm) was obtained from the S1200 release and subjected to the same precision functional mapping procedures applied to individual subjects in the main text. The WU120 salience network map was obtained online (https://balsa.wustl.edu/jNXKl). b, Salience network mapped using large n group-average data and previous studies of depression occupies between 3.28% (mode assignment of all individuals with depression in current study) and 3.43% of total cortical surface area. Group-averaged functional connectivity was calculated in the THREE-D sample using group-level PCA (MELODIC Incremental Group-PCA, MIGP), and the resultant group-average FC matrix was subjected to the same precision functional mapping procedures applied to individual subjects in the main text.
Extended Data Fig. 5
Extended Data Fig. 5. Within-person stability of salience network topology and connectivity.
a-b, Split-half reliability testing of salience network topology and functional connectivity in the least (SIMD-2, 58 min of fMRI scanning total) and most (SIMD-4, 29.96 hrs. of fMRI scanning total) sampled individuals with depression from the Serial Imaging of Major Depression (SIMD) dataset.
Extended Data Fig. 6
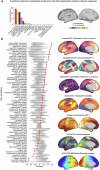
Extended Data Fig. 6. Salience network expansion in depression disproportionately affects heteromodal systems neighboring it, not unimodal sensorimotor networks.
a, On average across subjects, the majority of salience network expansion in depression affected either the Default-parietal, Frontoparietal, or Cingulo-opercular networks. In contrast, Salience network encroachment upon unimodal sensorimotor networks (for example, the visual, auditory, somatomotor subnetworks) was absent. b, The average map of Salience network encroachment was compared to 73 canonical maps of the brain’s functional and structural architecture (“annotations”) obtained from the neuromaps toolbox to help identify possible biological mechanisms for its expansion in individuals with depression. These maps are derived from a variety of independent molecular, microstructural, electrophysiological, developmental, and functional datasets. Spatial similarity was quantified using Spearman rank correlation, and statistical significance evaluated via spatial autocorrelation preserving null models. We observed multiple significant associations — including with principal gradients of functional connectivity and gene expression, and the spatial distribution of neurotransmitter receptors (μ-opioid, histamine H3 receptors), intracortical myelin, and individual variability in functional connectivity.
Extended Data Fig. 7
Extended Data Fig. 7. Salience network expansion in depression is associated with stable patterns of atypical functional connectivity.
a-b, Evaluating functional connectivity strength between encroaching and non-encroaching vertices of the Salience network relative to runner-up network assignments network. Strength of functional connectivity between encroaching nodes of the salience network and the rest of the Salience network, and the functional networks that typically occupy that space in healthy controls (most often Default, Frontoparietal, or Cingulo-opercular). This analysis was performed using split halves of each individual’s resting-state fMRI dataset to evaluate the stability of the Salience network assignment associated with the “encroaching” vertices relative to the runner-up assignments. Functional connectivity between encroaching Salience network vertices and the rest of the Salience network was on average 59% stronger than with the runner-up network (two-tailed independent sample t-test, all P’s < 0.001, Bonferroni correction, n = 141). This was the case when using either the first (a) or second (b) half of each individual’s concatenated resting-state fMRI dataset, indicating good stability. Error bars represent standard deviation.
Extended Data Fig. 8
Extended Data Fig. 8. Increased cortical representation of salience network in adults with late-onset depression.
Five individuals (mean age = 66.60 ± 5.31 years, 5 F) with a diagnosis of major depression and met criteria for late-onset depression (LOD, defined here as onset of first depressive episode at or after the age of 60) underwent repeated clinical assessments and fMRI scans (6 × 10.64 min multi-echo resting-state fMRI scans, 63.84 min total per-subject) before, during, and after a brief evidence-based psychotherapy. Salience network was larger in these individuals with LOD relative to healthy controls (two-tailed permutation test, *P = 0.009, uncorrected, Z-score = 2.90). The n = 37 healthy control data are also shown in the main text Fig. 1c. Error bars represent standard deviation.
Extended Data Fig. 9
Extended Data Fig. 9. Dense-sampling of depressive symptoms and functional connectivity in a second individual with depression.
a, A heat map summarizes fluctuations in individual items selected from a variety of clinical interviews and self-report scales related to anhedonia in an example individual (SIMD-6). Clinical data was resampled (using shape- preserving piecewise cubic interpolation) to days for visualization purposes (black and red dots above heat map mark the dates of study visits and ECT treatments received unrelated to the present study, respectively). b, Functional connectivity of salience network voxels in nucleus accumbens (NAc) when symptoms of anhedonia are low (study visits in the bottom quartile) and high (study visits in top quartile). c, Bootstrap resampling (iteratively selecting 50% of all time points at random, and logging correlation between nucleus accumbens ←→ anterior cingulate FC and anhedonia) indicated good stability.
Extended Data Fig. 10
Extended Data Fig. 10. Long term assessment of anhedonia and anxiety related symptoms in two deeply-sampled individuals with major depression.
a-b, Heat map summarizes fluctuations in individual items related to anxiety (blue, 27 items total) that were selected from a variety of clinical interviews and self-report scales completed by two deeply-sampled individuals with depression (a, SIMD-4; b, SIMD-6). Head maps for anhedonia related items are shown in main text Fig. 4a and Extended Data Fig. 9a for SIMD-4 and SIMD-6, respectively. Clinical data was resampled (using shape-preserving piecewise cubic interpolation) to days for visualization purposes. The first principal component (PC1) of the anhedonia and anxiety measures were modestly correlated with one another within each individual over time (Pearson correlation, MDD04: r = 0.41, P < 0.001; MDD06: r = 0.45, P < 0.001), indicating that the severity of anxiety and anhedonia related symptoms can fluctuate independently of one another, but also that they both respond to global shifts in illness severity, which were primarily related to ECT in  SIMD-6).

Update of

References

    1. Winter, N. R. et al. Quantifying deviations of brain structure and function in major depressive disorder across neuroimaging modalities. JAMA Psychiatry79, 879–888 (2022). - PMC - PubMed
    1. Laumann, T. O. et al. Functional system and areal organization of a highly sampled individual human brain. Neuron87, 657–670 (2015). - PMC - PubMed
    1. Gordon, E. M. et al. Precision functional mapping of individual human brains. Neuron95, 791–807 (2017). - PMC - PubMed
    1. Braga, R. M. & Buckner, R. L. Parallel interdigitated distributed networks within the individual estimated by intrinsic functional connectivity. Neuron95, 457–471 (2017). - PMC - PubMed
    1. Duman, R. S. & Aghajanian, G. K. Synaptic dysfunction in depression: potential therapeutic targets. Science338, 68–72 (2012). - PMC - PubMed

MeSH terms

LinkOut - more resources