. 2024 Sep;633(8029):371-379.
doi: 10.1038/s41586-024-07891-2. Epub 2024 Sep 4.

Global marine microbial diversity and its potential in bioprospecting

Affiliations

Global marine microbial diversity and its potential in bioprospecting

Jianwei Chen et al. Nature. 2024 Sep.

Abstract

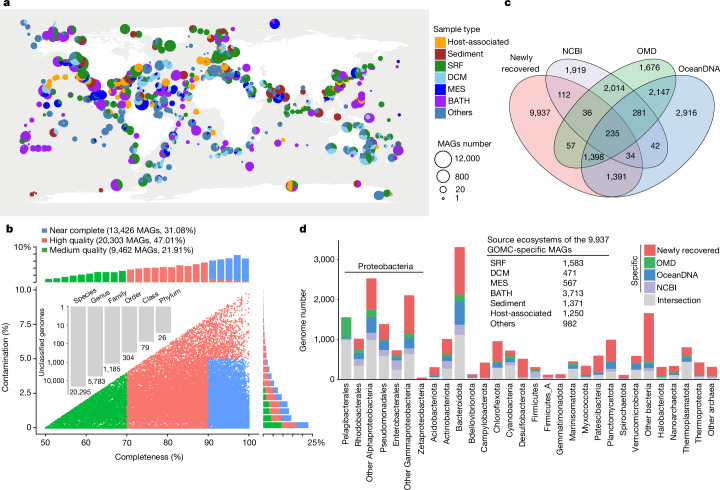
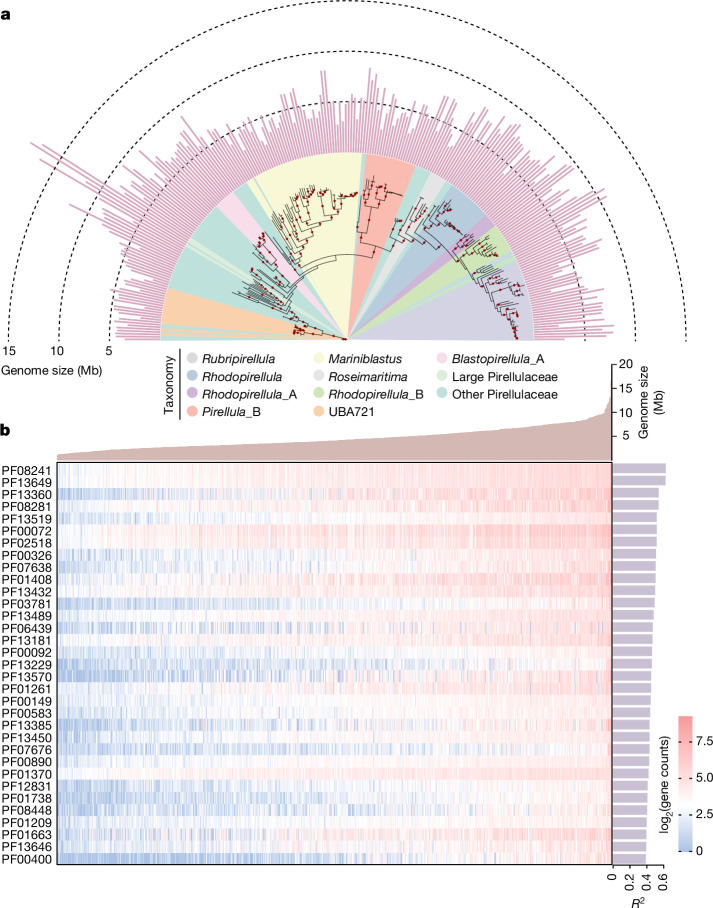
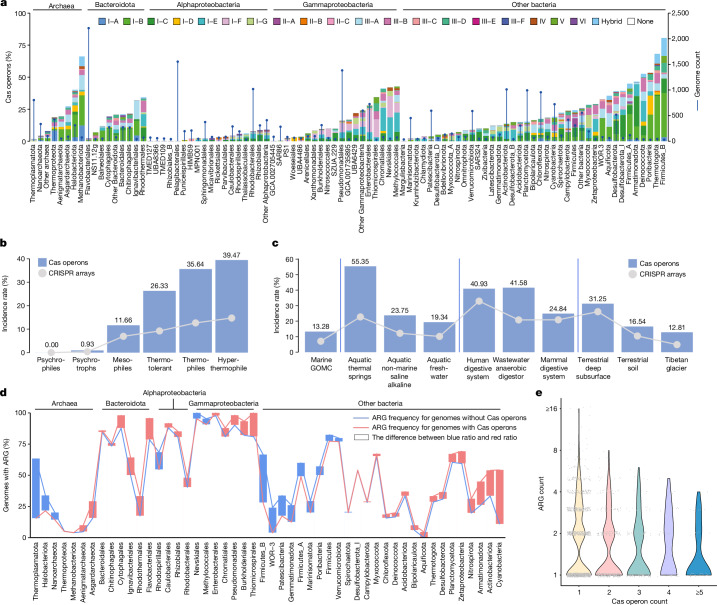
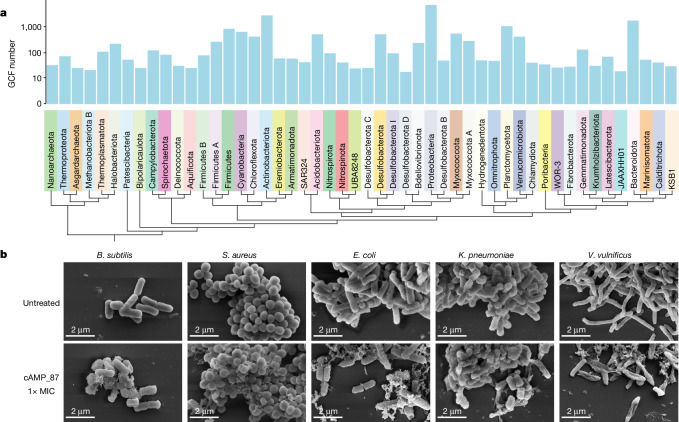
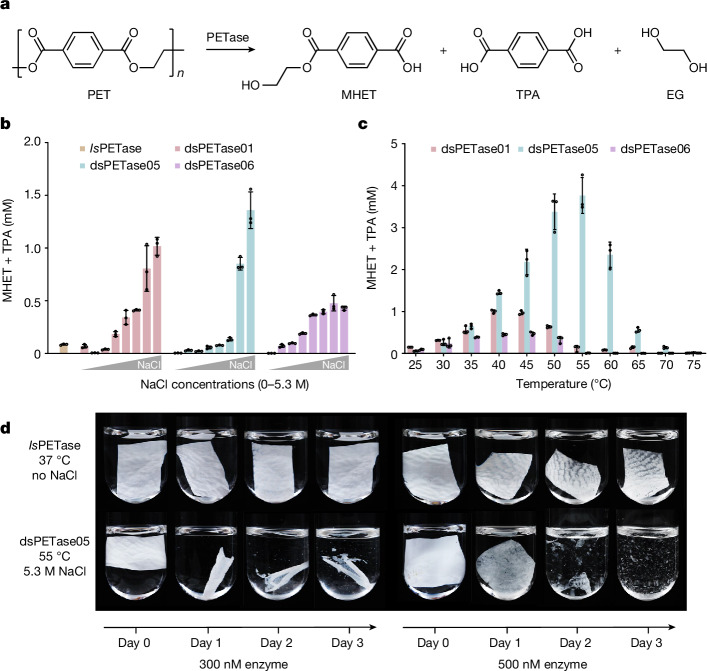
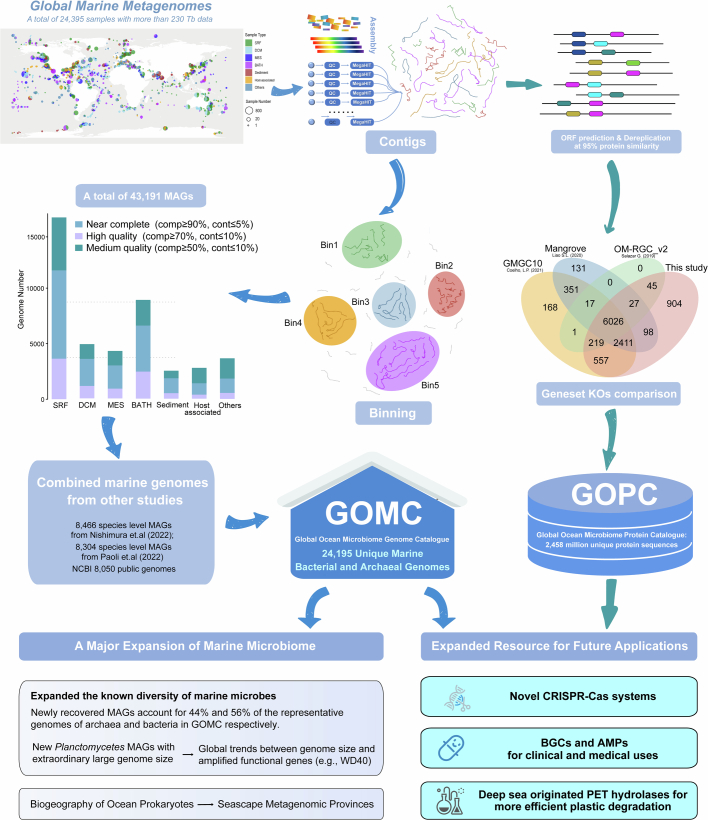
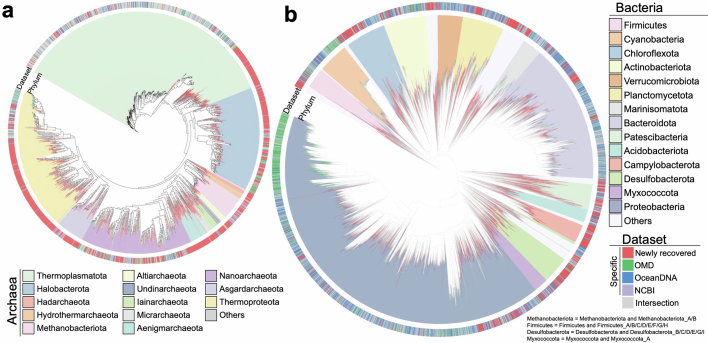
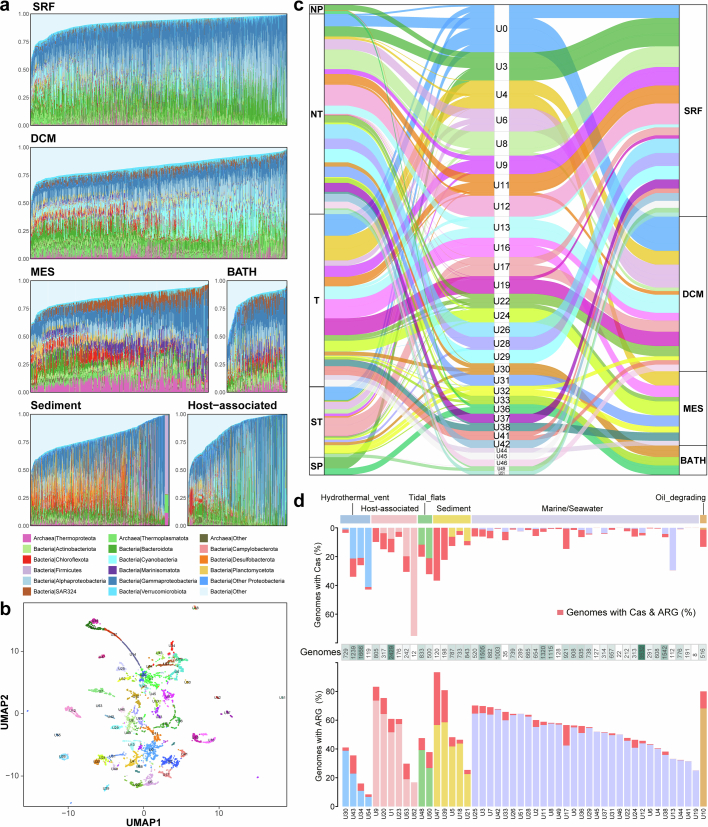
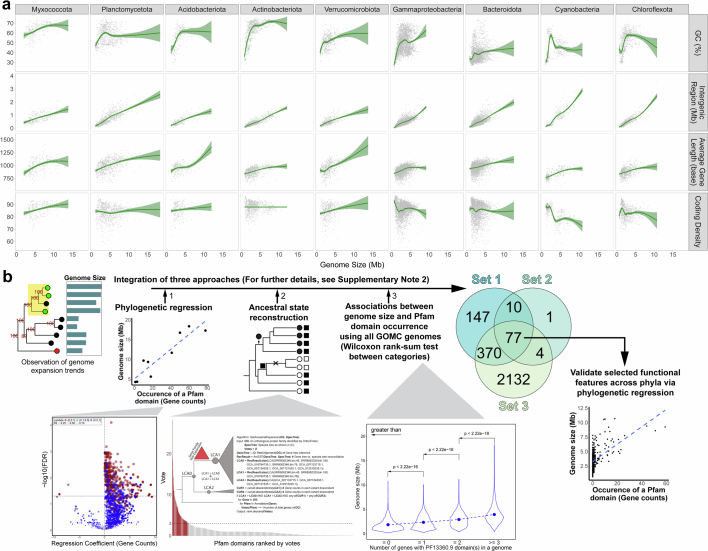
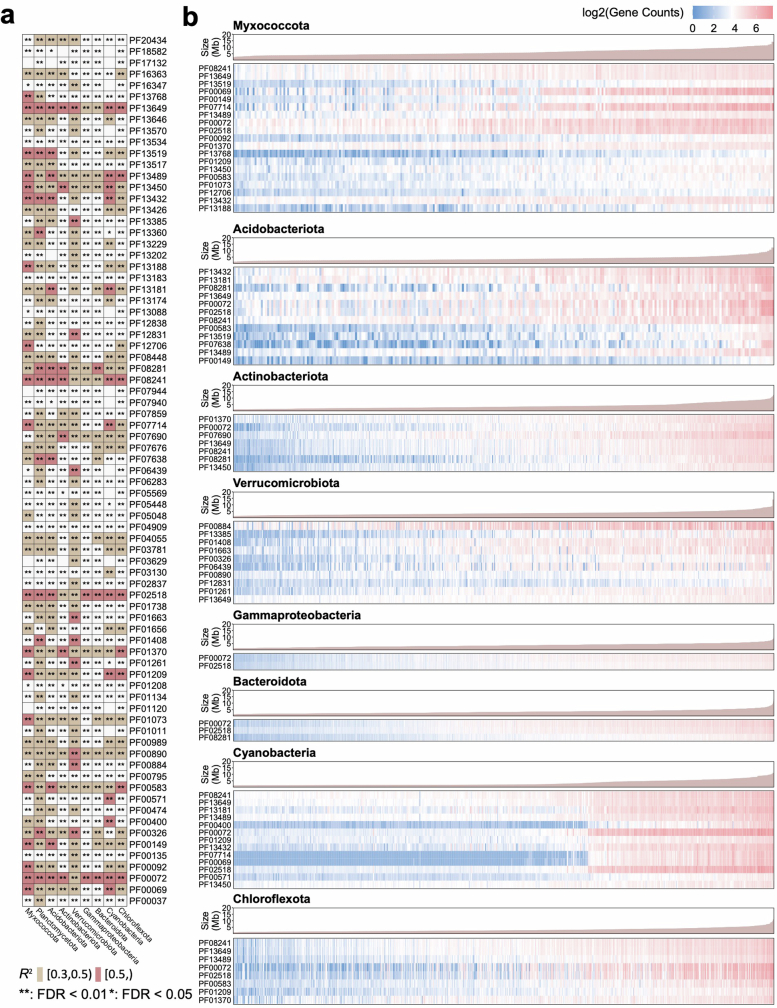
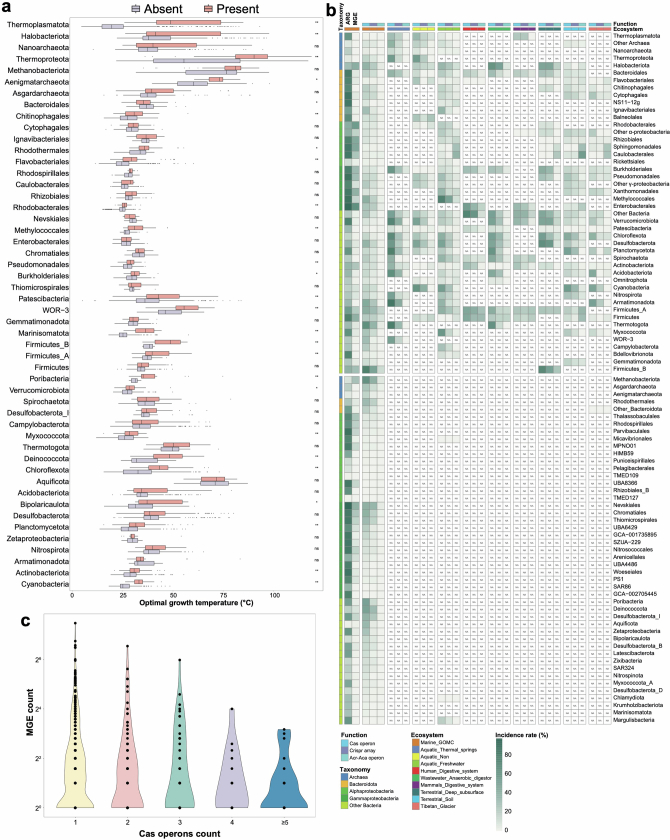
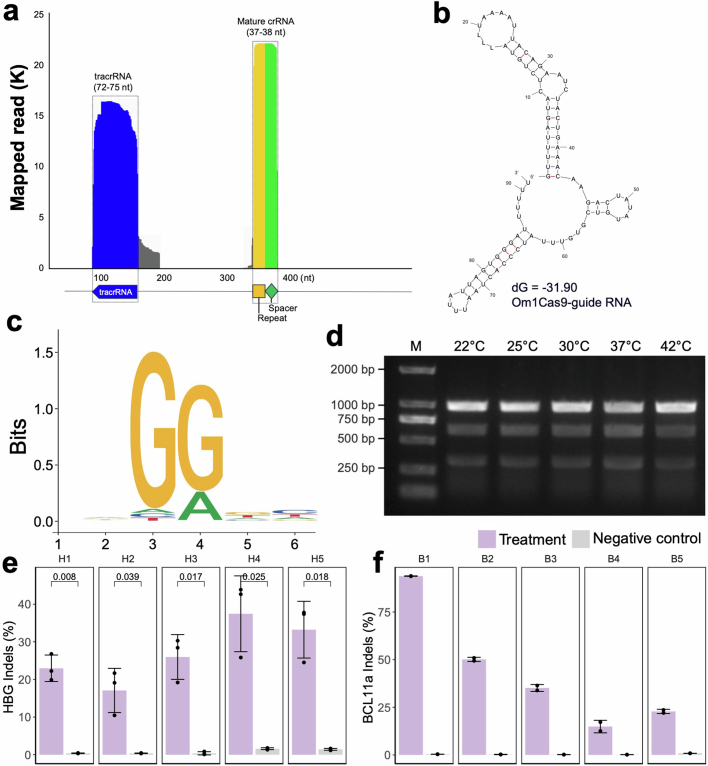
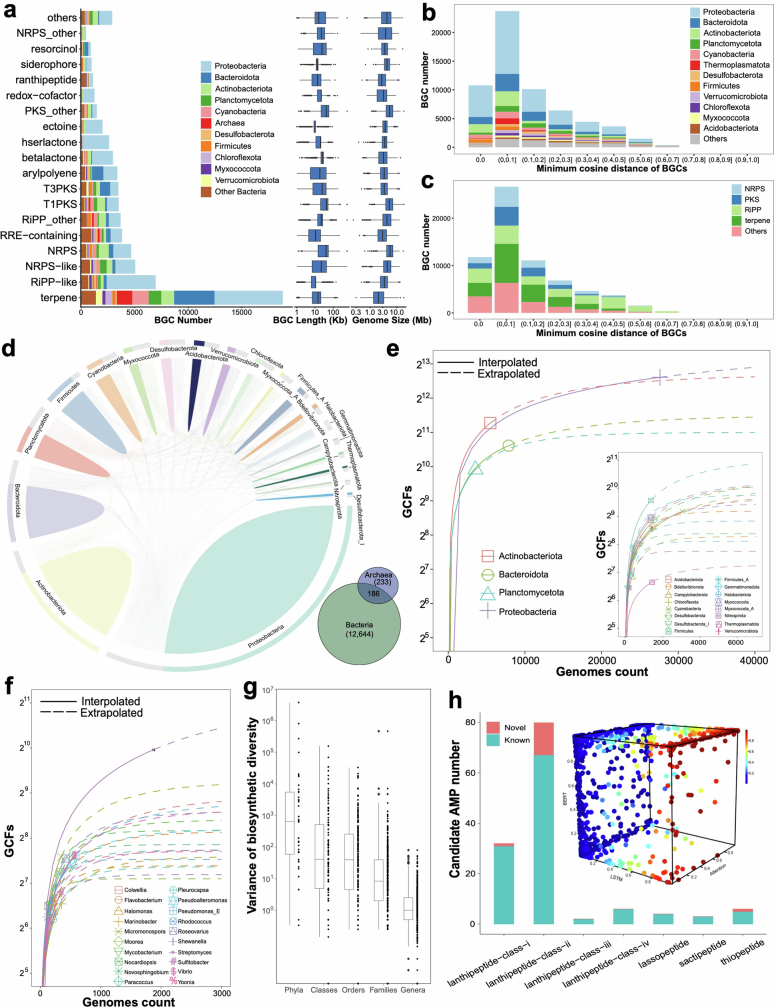
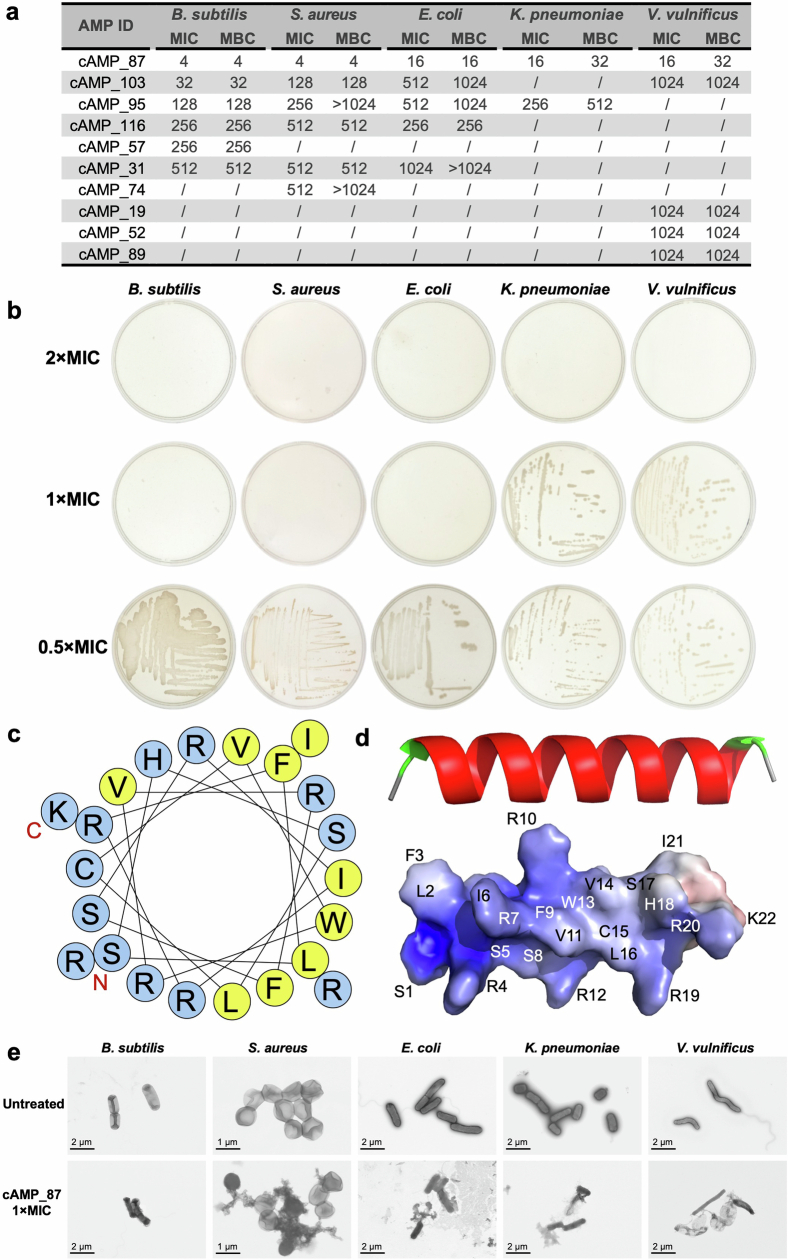
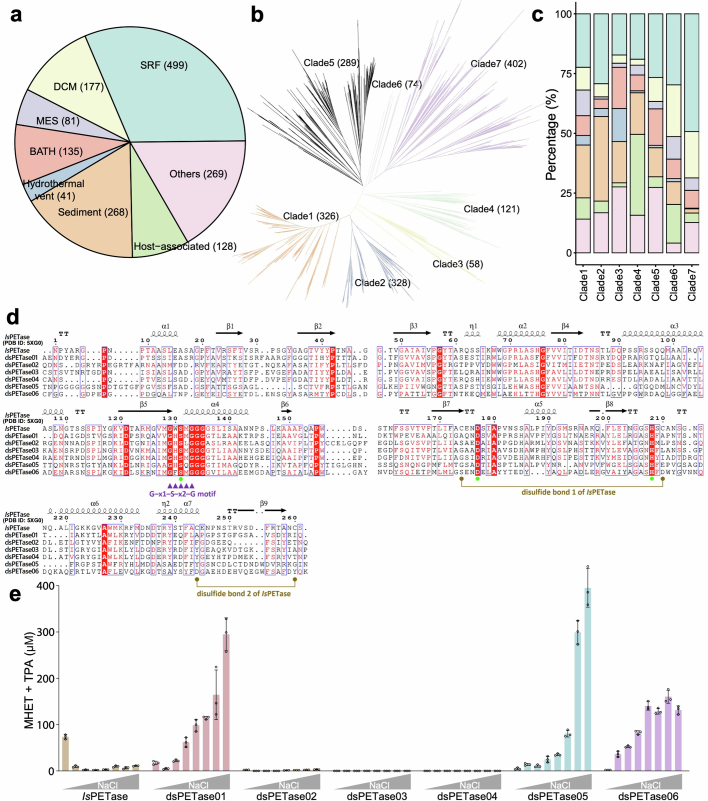
The past two decades has witnessed a remarkable increase in the number of microbial genomes retrieved from marine systems1,2. However, it has remained challenging to translate this marine genomic diversity into biotechnological and biomedical applications3,4. Here we recovered 43,191 bacterial and archaeal genomes from publicly available marine metagenomes, encompassing a wide range of diversity with 138 distinct phyla, redefining the upper limit of marine bacterial genome size and revealing complex trade-offs between the occurrence of CRISPR-Cas systems and antibiotic resistance genes. In silico bioprospecting of these marine genomes led to the discovery of a novel CRISPR-Cas9 system, ten antimicrobial peptides, and three enzymes that degrade polyethylene terephthalate. In vitro experiments confirmed their effectiveness and efficacy. This work provides evidence that global-scale sequencing initiatives advance our understanding of how microbial diversity has evolved in the oceans and is maintained, and demonstrates how such initiatives can be sustainably exploited to advance biotechnology and biomedicine.


Conflict of interest statement

The authors declare no competing interests.

Figures

Fig. 1
Fig. 1. Geographic and ecosystem distribution of MAGs.
a, Geographic distribution of 43,191 newly recovered MAGs. BATH, bathypelagic; DCM, deep chlorophyll maximum layer; MES, mesopelagic; SRF, surface water. b, The collection of 43,191 MAGs with medium or higher quality that form the basis of this study. The central dot plot displays the distribution of completeness and contamination for all MAGs recovered in this study. The top bar plot indicates the percentage of MAGs within specific completeness ranges, while the right bar plot shows the percentage within specific contamination ranges. The grey bar plot embedded in the center illustrates the number of taxonomically unclassified MAGs across taxonomic ranks. c, A Venn diagram showing the specific or shared species-level genomes among the newly assembled genomes, NCBI, OMD and OceanDNA. d, Contribution of the current study and extant published databases to each bacterial and archaeal phylum. The inset table presents the original ecosystems of the 9,937 specific MAGs in this study.
Fig. 2
Fig. 2. Genome size and functional domain variation in Planctomycetota genomes.
a, Phylogenetic tree of Pirellulaceae in Planctomycetota. Outer bars indicate the genome size. b, Heat map illustrating the distribution of the top 33 functional domains across genomes in the Planctomycetota phylum. Each row corresponds to a distinct Pfam domain and each column represents an individual genome. Genomes are arranged in ascending order on the basis of their size, as shown in the bar plot (top). The colour gradient from blue to red signifies the number of proteins associated with the respective functional domain within each genome. Warmer colours indicate a larger number of proteins, providing a visual representation of the Pfam domain composition across the analysed genomes. Right, the ordering of Pfam domains from top to bottom is determined by their R2 values obtained from the phylogenetic regression analysis within the specific phylum.
Fig. 3
Fig. 3. The distribution of defence systems.
a, Bar plot indicating the frequency of Cas operons in different lineages of all GOMC genomes. Only lineages with more than 50 genomes are presented, and the blue line represents the genome number of each lineage. b, Bar plots displaying the incidence rate of Cas operon in GOMC genomes with different optimal growth temperatures. The grey line displays the incidence rate of CRISPR array. c, Bar plots displaying the incidence rate of Cas operons in genomes from different ecosystems. d, Line plots showing the fractions of genomes encoding ARG with or without the presence of Cas operons. Boxes represent the difference of these two ratios with a blue box indicating the fraction by which the absence of Cas operons increased the frequency of ARG, and a red box indicating the fraction by which the absence of Cas operons decreased the frequency of ARG. e, The trend indicates a decrease in the upper limit number of ARGs with increased number of Cas operons.
Fig. 4
Fig. 4. Identification of biosynthetic gene clusters and AMPs.
a, Comparison of biosynthetic gene clusters among phyla. The number of unique GCFs detected in each phylum is displayed by the bar chart. b, SEM examination of five bacterial strains treated with cAMP_87 and non-AMP negative control group, revealing leakage of cell contents and disruption of the cell wall and membrane. The experiments were conducted in triplicate, yielding consistent results, and a representative image is provided for illustration.
Fig. 5
Fig. 5. Hydrolytic activities of halophilic dsPETases.
a, Schematic depolymerization of PET catalysed by PETase, mainly producing MHET, TPA and ethylene glycol (EG) as soluble products. b, Halophilic properties of dsPETases. Hydrolytic activities towards amorphous GfPET films proxied by the concentrations of total released products (the sum of MHET and TPA, analysed by HPLC). The reactions catalysed by 50 nM dsPETases were carried out in pH 9.0 Tris-HCl buffer for 120 h at a series of NaCl concentrations. The activity of IsPETase in the absence of NaCl was determined in parallel as a reference. c, Hydrolytic activities of three halophilic dsPETases towards GfPET films under a range of temperatures. The reactions were initiated by adding enzymes to their optimal saline concentrations, which were 5.3 M of NaCl for dsPETase01 and dsPETase05, and 4.5 M of NaCl for dsPETase06. All reactions were conducted in triplicate. The bars and circles represent the mean and individual values, respectively, and error bars represent the s.d. of the replicated experiments. d, Visible degradation of scPET films by halophilic dsPETase05 under optimal saline and temperature conditions. The reaction catalysed by IsPETase under NaCl-free Tris-HCl buffer (pH 9.0) at 37 °C was set as reference. In each sample, 3 mg of scPET was incubated in a total volume of 3 ml, with 300 or 500 nM of enzyme as indicated. The experiments were conducted in triplicate with consistent results, and one representative figure is shown.
Extended Data Fig. 1
Extended Data Fig. 1. Overview and schematic workflow.
Globally distributed marine metagenomes were collected and reanalysed for recovery of marine microbial metagenome-assembled-genomes (MAGs). Microbial genomes previously deposited in public NCBI databases and MAGs from two previous studies (OMD and OceanDNA) were downloaded and pooled with the newly recovered MAGs to construct a unified and comprehensive GOMC as a reference database for downstream analysis and future studies. Open reading frames were predicted from the assembled contigs and then dereplicated for the construction of a unique and comprehensive GOPC. Venn diagram shows the KOs overlap of GOPC with other previously published gene catalogues.
Extended Data Fig. 2
Extended Data Fig. 2. Phylogenetic distribution of GOMC MAGs.
a and b, Phylogenetic tree based on 122 or 120 universally distributed single-copy genes for archaeal (a) and bacterial (b) genomes in GOMC, respectively.
Extended Data Fig. 3
Extended Data Fig. 3. Microbial biogeography and metagenomic provinces (MPs).
a, Microbial community composition of samples from different depths. b, Distribution of MPs in the UMAP dimensionality reduction space. Different colors indicate different MPs. The identifier of each MP is labeled at the center of the cluster. c, Alluvial diagram showing geographic groupings of MPs only comprising of seawater samples. Major categories of climate zones are shown on the left stratum and designated by the following acronyms: “NP” stands for “North Polar”, “NT” for “North Temperate”, “T” for “Tropical”, “ST” for “South Temperate” and “SP” for “South Polar”. Color scheme for MP flows is identical to b. d, The number (the middle heatmap) and fraction of MAGs encoding Cas operon (the upper part) or ARG (the lower part) in metagenomic provinces represent various marine ecosystems.
Extended Data Fig. 4
Extended Data Fig. 4. Identification of genome features and Pfam domains related to genome expansion.
a, Correlations between genome features and genome size in the phyla with large genomes. b, The workflow to identify Pfam domains potentially underpinning genome size expansion, which integrates phylogenetic regression analyses, ancestral proteome reconstruction, and exploration of associations between genome size and gene copies (details in Supplementary Note 2).
Extended Data Fig. 5
Extended Data Fig. 5. Validation of the positive correlation between selected Pfam domains and bacterial genome enlargement across multiple phyla.
a, Statistics of the phylogenetic regression analyses between the selected 77 Pfam domains and bacterial genome sizes across multiple phyla (n » 30). b, Distribution of Pfam domains within each phylum as genome size increases. Only Pfams with R² ≥ 0.5 from the regression analyses are shown for each phylum.
Extended Data Fig. 6
Extended Data Fig. 6. Distribution of CRISPR-Cas systems, ARGs and mobile genetic elements (MGEs) across different microbial phylogeny and ecosystems.
a, The predicted OGT of genomes with or without Cas operon. Only lineages with more than 50 genomes are presented. The star symbol indicated significance level between the two groups. ns represented P > 0.05, * represented 0.01 < P ≤ 0.05, ** represented P ≤ 0.01 (Wilcoxon test, n » 30). b, The uneven distribution patterns of defense systems. The ARG and MGE occurrence frequencies of the GOMC dataset are shown on the left side of the heatmap. c, The trend indicates a decrease in the upper limit number of MGEs with increased number of Cas operons.
Extended Data Fig. 7
Extended Data Fig. 7. Evaluation of Om1Cas9 activities.
a, The tracrRNA and mature crRNA identified by small RNA sequencing. b, The structure of guide RNA. c, PAM sequences identified by the DocMF platform. d, Verification of the in vitro dsDNA cleavage efficiency for the AASV1 gene fragments across temperature gradients. The experiments were conducted in technical replicates. e and f, Quantification of editing efficiency for five selected editing sites of the HBG gene (Student’s t-test, n = 3, technical triplicate) (e) and the BCL11a enhancer (n = 2, technical replicates) (f), respectively. The bars and circles represent the average and individual values, respectively. Error bars represent SD of the replicated experiments.
Extended Data Fig. 8
Extended Data Fig. 8. Phylogenomic distribution and diversity of biosynthetic gene clusters.
a, BGCs predicted from GOMC genomes. b and c, Comparison of BGCs in GOMC against BiG-FAM database. d, Circos plot showing GCFs unique to phyla (solid shapes) and with pairwise overlaps between phyla (ribbons). Venn diagram showing GCF overlap between bacterial and archaeal domains. e and f, Rarefaction curves of the top 4 phyla (the other 16 phyla of the top 20 in embedded figure) and top 20 genera with most predicted biosynthetic potential, respectively. g, Variance of biosynthetic diversity for genomes at different taxonomic rank from phylum to genus. h, cAMP prediction using deep-learning models. The bar chart shows the novel or known number of RiPPs subtypes of 133 cAMPs including the 121 unique cAMPs.
Extended Data Fig. 9
Extended Data Fig. 9. Characterization of novel antimicrobial peptides.
a, Determination of MIC and MBC values of ten cAMPs. b, CaMHB agar plates determination of MBC concentrations of cAMP_87. c, Helical wheel projections of cAMP_87. Positively charged residues are shown in blue and hydrophobic residues are depicted in yellow. d, Three-dimensional structure simulation presented in ribbon diagram (top) and potential surface (bottom) of cAMP_87. Blue denotes positive potential, while red denotes negative. e, TEM examination of five bacterial strains treated with and without cAMP_87. All the experiments were conducted in triplicate with consistent results, and one representative figure is shown.
Extended Data Fig. 10
Extended Data Fig. 10. Bioprospecting of IsPETase candidates.
a, The distribution of 1,598 IsPETase homologues with Ser-Asp-His catalytic triad across varying marine ecosystems. b and c, Phylogenetic analysis of the PETase candidates (b) and ecosystem origins of different clades (c). Color scheme for the ecosystems in c is the same as that in a. d, Alignment of dsPETases with IsPETase. Arrows indicates β-sheets and helix indicates α-helixes. The Ser-Asp-His catalytic triad is labeled by green circles. The conserved serine hydrolase Gly–x1–Ser–x2–Gly motif is highlighted as purple triangles. The two disulfide bonds found in IsPETase are indicated with brown-colored circles and lines. e, Incubation of GfPET films with 50 nM dsPETases at 37 °C for 48 h under various NaCl concentrations. All reactions were performed in technical triplicate. The bars and circles represent the average and individual values, respectively. Error bars represent the s.d. of the replicated experiments.

References

    1. Rusch, D. B. et al. The Sorcerer II Global Ocean Sampling Expedition: northwest Atlantic through eastern tropical Pacific. PLoS Biol.5, e77 (2007). 10.1371/journal.pbio.0050077 - DOI - PMC - PubMed
    1. Sunagawa, S. et al. Structure and function of the global ocean microbiome. Science348, 1261359 (2015). 10.1126/science.1261359 - DOI - PubMed
    1. Nayfach, S. et al. A genomic catalog of Earth’s microbiomes. Nat. Biotechnol.39, 499–509 (2021). 10.1038/s41587-020-0718-6 - DOI - PMC - PubMed
    1. Paoli, L. et al. Biosynthetic potential of the global ocean microbiome. Nature607, 111–118 (2022). 10.1038/s41586-022-04862-3 - DOI - PMC - PubMed
    1. Overmann, J. & Lepleux, C. in The Marine Microbiome (ed. Stal, L. J. & Cretoiu, M. S.) 21–55 (2016).

MeSH terms

Substances

LinkOut - more resources