. 2024 Sep;633(8031):932-940.
doi: 10.1038/s41586-024-07888-x. Epub 2024 Sep 4.

CDK5-cyclin B1 regulates mitotic fidelity

Affiliations

CDK5-cyclin B1 regulates mitotic fidelity

Xiao-Feng Zheng et al. Nature. 2024 Sep.

Abstract

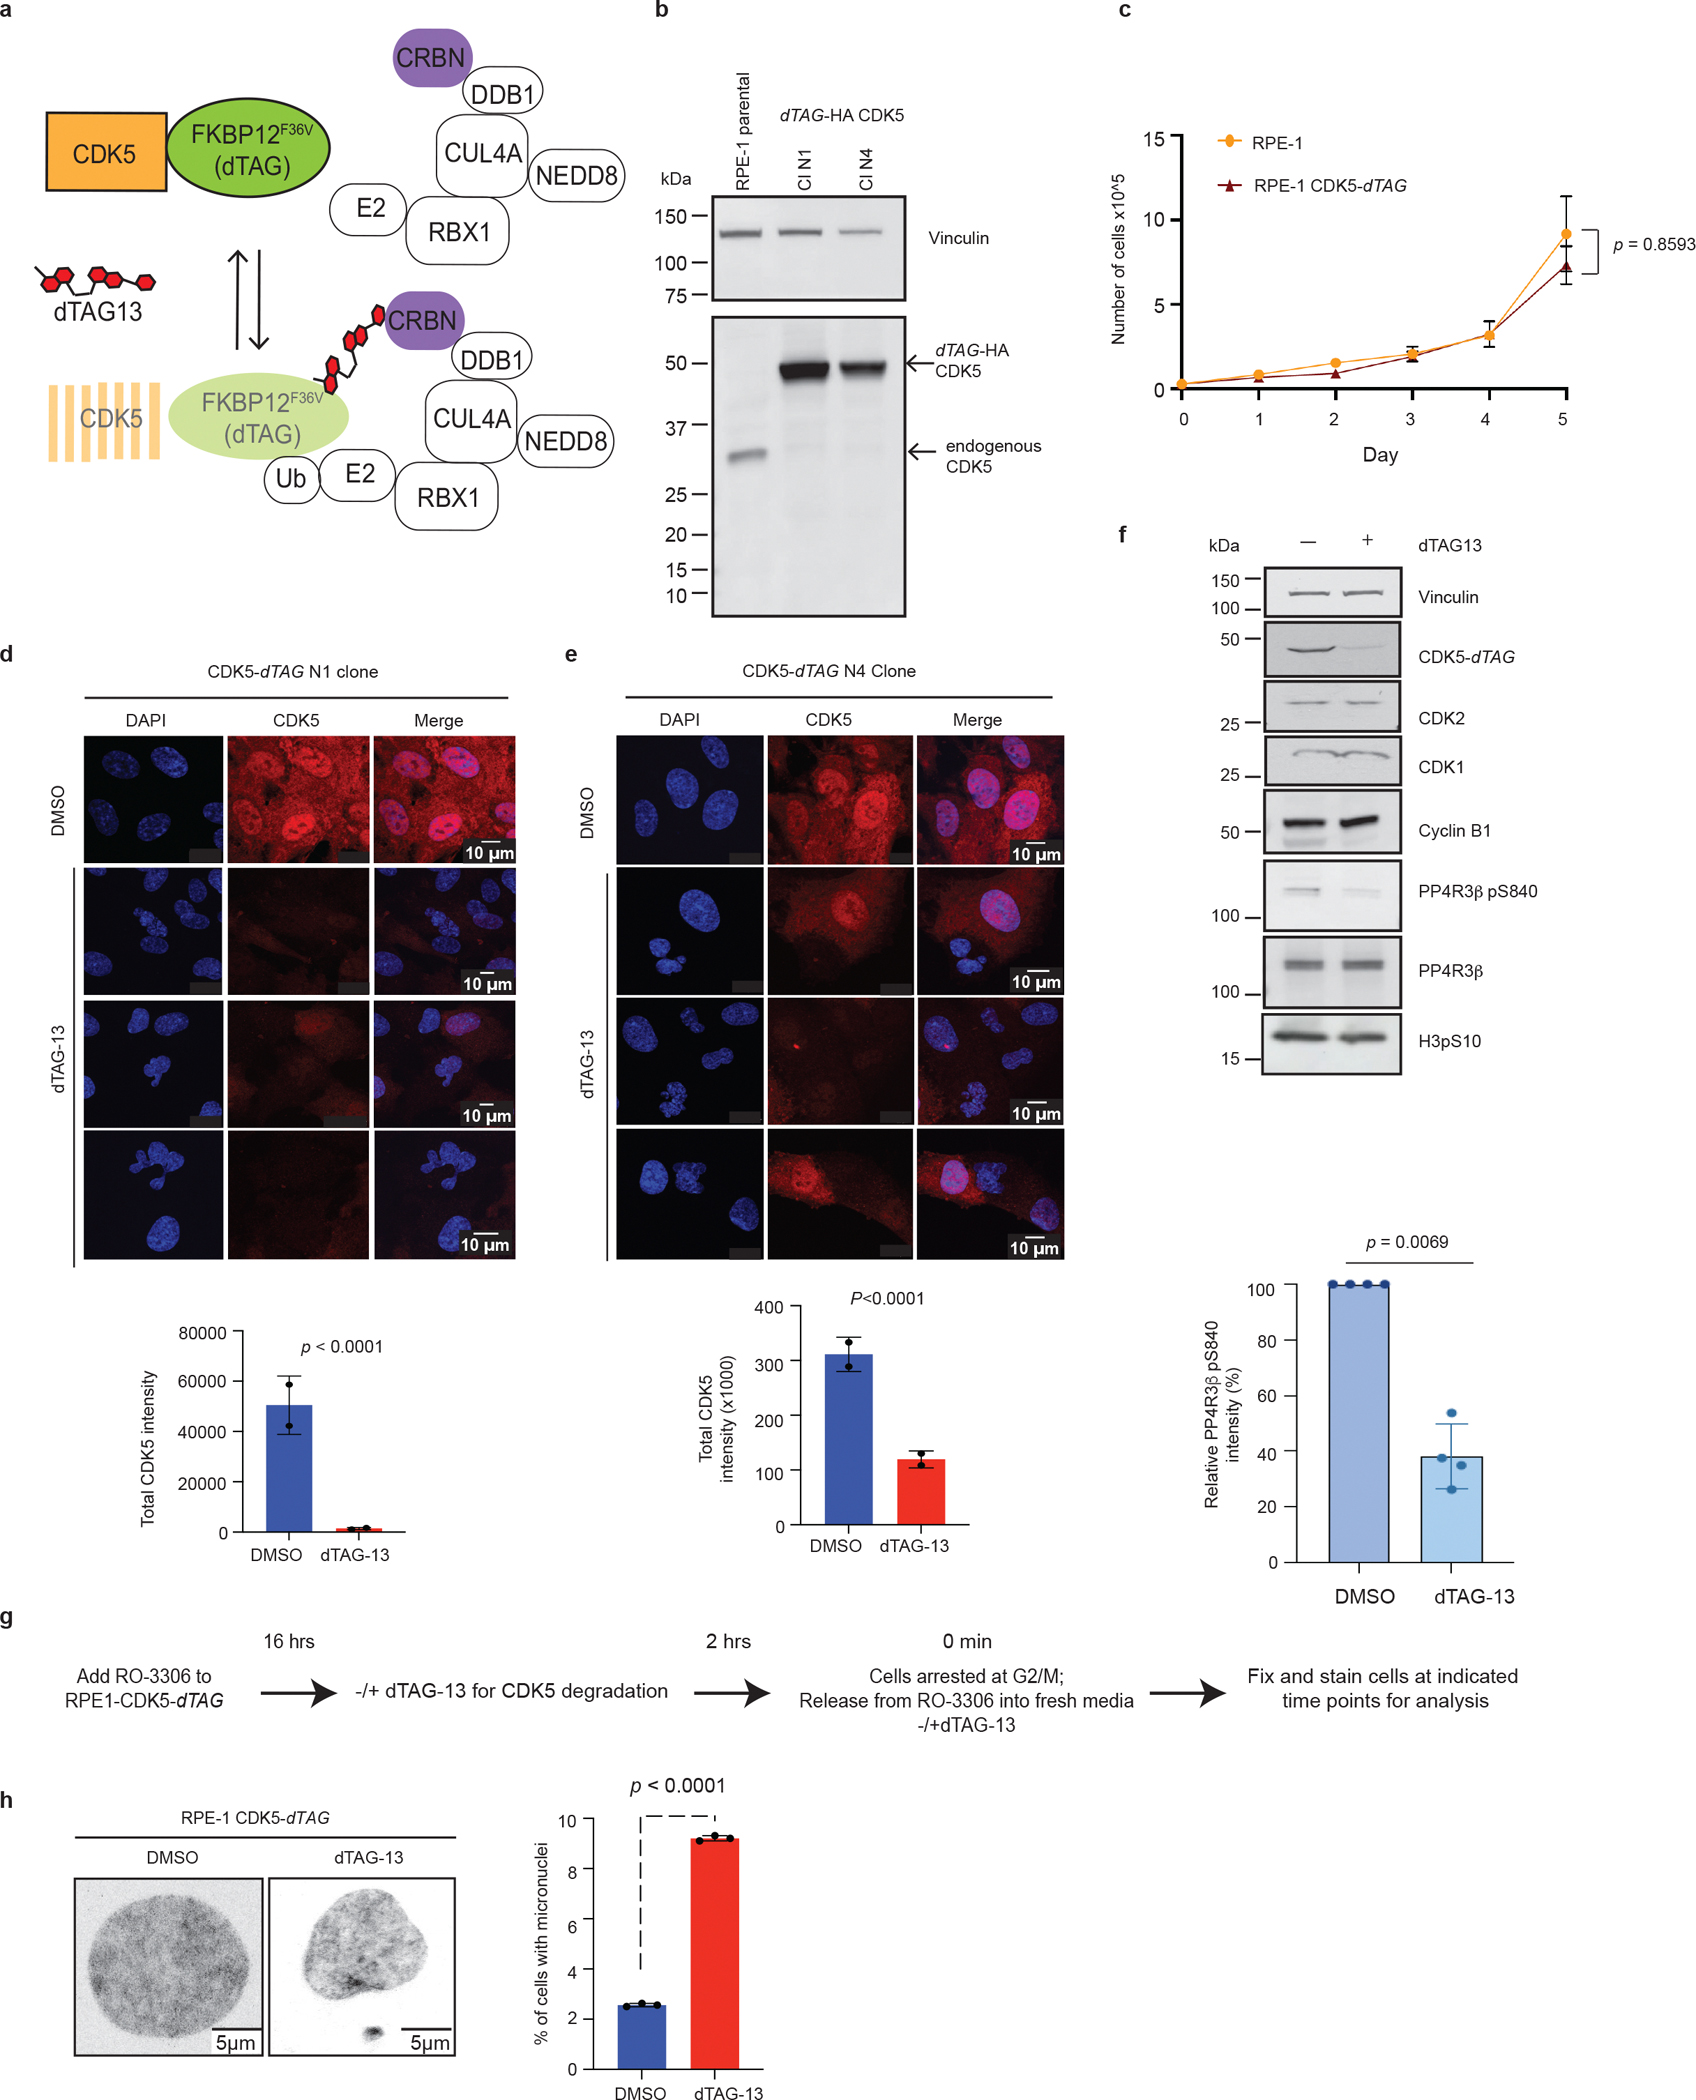
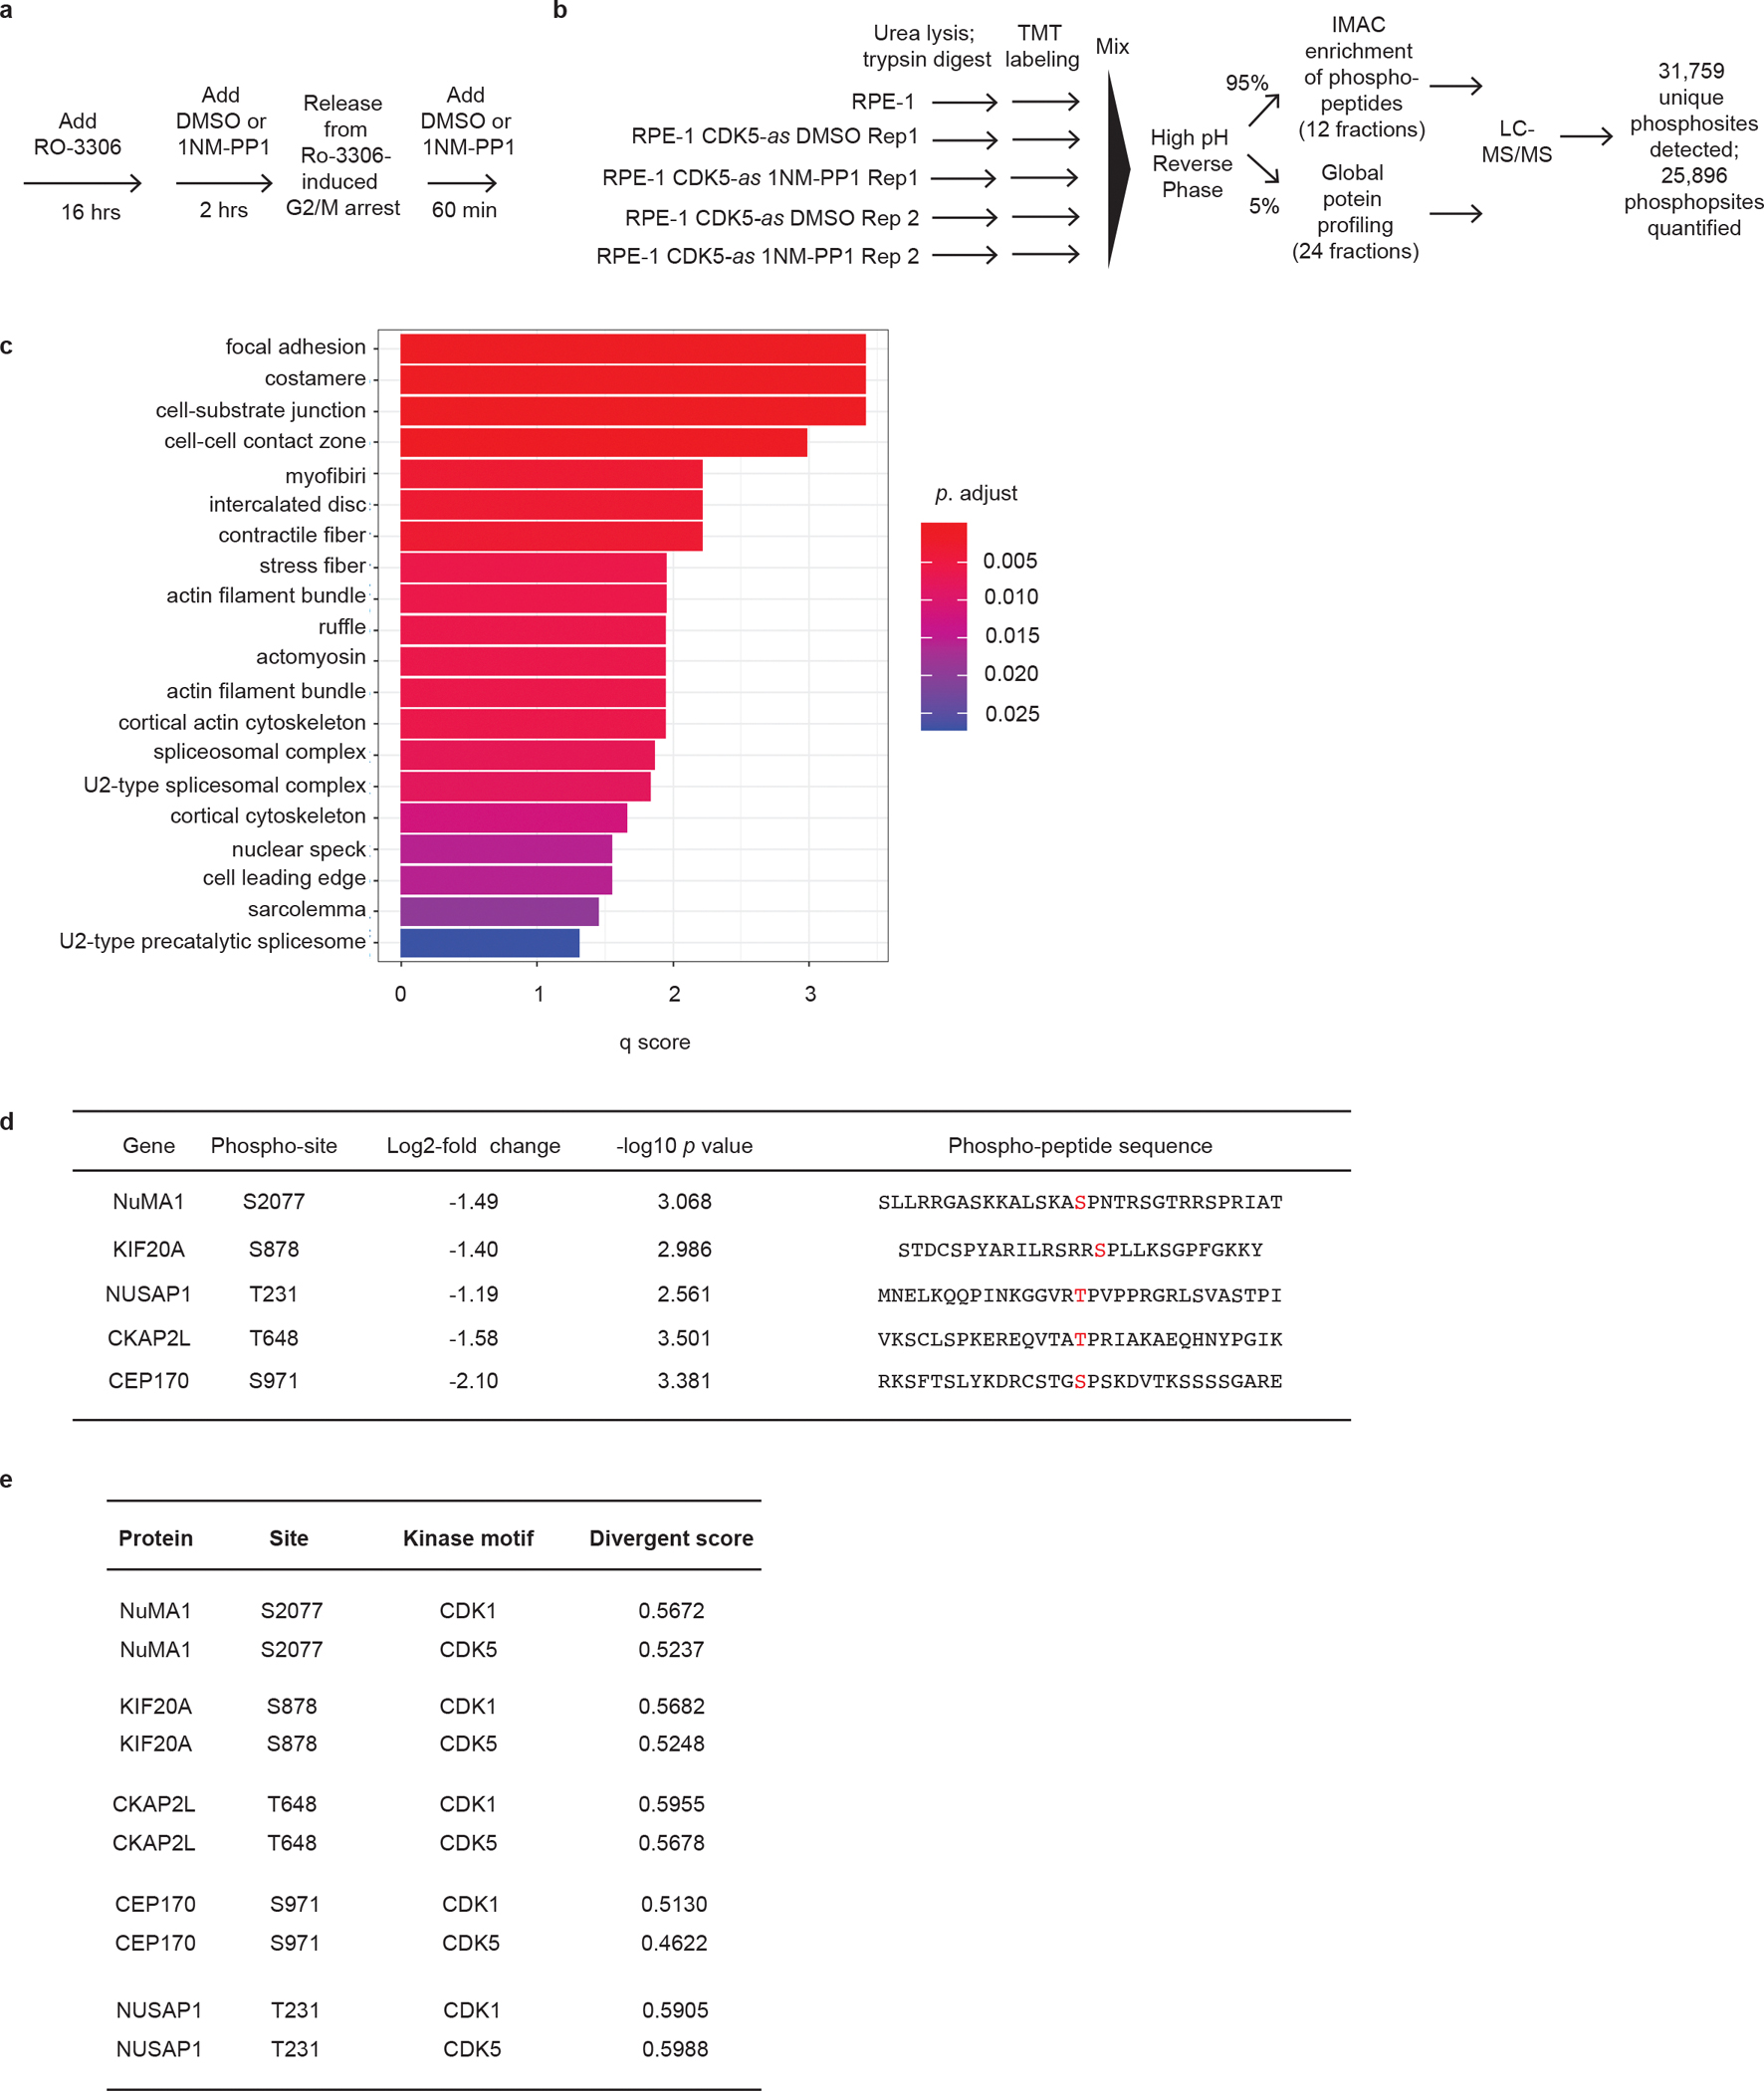
CDK1 has been known to be the sole cyclin-dependent kinase (CDK) partner of cyclin B1 to drive mitotic progression1. Here we demonstrate that CDK5 is active during mitosis and is necessary for maintaining mitotic fidelity. CDK5 is an atypical CDK owing to its high expression in post-mitotic neurons and activation by non-cyclin proteins p35 and p392. Here, using independent chemical genetic approaches, we specifically abrogated CDK5 activity during mitosis, and observed mitotic defects, nuclear atypia and substantial alterations in the mitotic phosphoproteome. Notably, cyclin B1 is a mitotic co-factor of CDK5. Computational modelling, comparison with experimentally derived structures of CDK-cyclin complexes and validation with mutational analysis indicate that CDK5-cyclin B1 can form a functional complex. Disruption of the CDK5-cyclin B1 complex phenocopies CDK5 abrogation in mitosis. Together, our results demonstrate that cyclin B1 partners with both CDK5 and CDK1, and CDK5-cyclin B1 functions as a canonical CDK-cyclin complex to ensure mitotic fidelity.


Conflict of interest statement

Competing interests: A.D.D. reports consulting for AstraZeneca, Bayer AG, Blacksmith/Lightstone Ventures, Bristol Myers Squibb, Cyteir Therapeutics, EMD Serono, Impact Therapeutics, PrimeFour Therapeutics, Pfizer, Tango Therapeutics and Zentalis Pharmaceuticals/Zeno Management; is an Advisory Board member for Cyteir and Impact Therapeutics; a stockholder in Cedilla Therapeutics, Cyteir, Impact Therapeutics and PrimeFour Therapeutics, and reports receiving commercial research grants from Bristol Myers Squibb, EMD Serono, Moderna and Tango Therapeutics. The remaining authors declare no competing interests.

Figures

Extended Data Fig. 1.
Extended Data Fig. 1.. Inhibition of CDK5 in analog-sensitive (CDK5-as) system.
a, Schematics depicting specific inhibition of the CDK5 analog-sensitive (as) variant. Canonical ATP-analog inhibitor (In, yellow) targets endogenous CDK5 (dark green) at its ATP-binding catalytic site nonspecifically since multiple kinases share structurally similar catalytic sites (left panel). The analog-sensitive (as, light green) phenylalanine-to-glycine (F80G) mutation confers a structural change adjacent to the catalytic site of CDK5 that does not impact its catalysis but accommodates the specific binding of a non-hydrolysable bulky orthogonal inhibitor 1NM-PP1(In*, orange). Introduction of 1NM-PP1 thus selectively inhibits CDK5-as variant (right panel). b, Immunoblots showing two clones (Cl 23 and Cl 50) of RPE-1 cells expressing FLAG-HA-CDK5-as in place of endogenous CDK5. Representative results are shown from three independent repeats. c, Proliferation curve of parental RPE-1 and RPE-1 CDK5-as cells. Data represent mean +/− s.d. from three independent repeats. p-value was determined by Mann Whitney U test. d, Immunoblots showing immunoprecipitated CDK1-cyclin B1 complex or CDK5-as-cyclin B1 complex by the indicated antibody-coupled agarose, from nocodazole arrested RPE-1 CDK5-as cells with treated with or without 1NM-PP1 for inhibition of CDK5-as, from three independent replicate experiments. e, In-vitro kinase activity quantification of immunoprecipitated complex shown in d. Data represent mean +/− s.d. from three independent experiments. p-values were determined by unpaired, two-tailed student’s t-test. f, Immunoblots of RPE-1 CDK5-as cells treated with either DMSO or 1NM-PP1 for 2 hours prior to and upon release from RO-3306 and collected at 60 minutes following release. Cells were lysed and blotted with anti-bodies against indicated proteins (upper panel). Quantification of the relative intensity of PP4R3β phosphorylation at S840 in 1NM-PP1-treated CDK5-as cells compared to DMSO-treatment (lower panel). g, Experimental scheme for specific and temporal abrogation of CDK5 in RPE-1 CDK5-as cells. Data represent mean +/− S.D from quadruplicate repeats. p-value was determined by one sample t and Wilcoxon test. h, Hoechst staining showing primary nuclei and micronuclei of RPE-1 CDK5-as with indicated treatment; scale bar is as indicated (left panel). Data represent mean +/− s.d. of three independent experiments from n=2174 DMSO, n=1788 1NM-PP1 where n is the number of cells. p-values were determined by unpaired, two-tailed student’s t-test. Scale bar is as indicated. Uncropped gel images are provided in Supplementary Fig. 1.
Extended Data Fig. 2.
Extended Data Fig. 2.. Degradation of CDK5 in degradation tag (CDK5-dTAG) system.
a, Schematic depicting the dTAG-13-inducible protein degradation system. Compound dTAG-13 links protein fused with FKBP12F36V domain (dTAG) to CRBN-DDB1-CUL4A E3 ligase complex, leading to CRBN-mediated degradation. b, Immunoblots showing two clones of RPE-1 cells that express dTAG-HA-CDK5 in place of endogenous CDK5 (Cl N1 and Cl N4). Representative results are shown from three independent repeats. c, Proliferation curve of parental RPE-1 and RPE-1 CDK5-dTAG. Data represent mean +/− s.d. of three independent repeats. p-value was determined by Mann Whitney U test. d and e, Representative images of RPE-1 CDK5-dTAG clone 1 (N1) (d) and RPE-1 CDK5-dTAG clone 4 (N4) (e) treated with DMSO or dTAG-13 for 2 hours prior to and upon release from G2/M arrest and fixed at 120 minutes after release (top panel); quantification of CDK5 total intensity per cell (lower panels). Data represent mean +/− s.d. of at least two independent experiments from n = 100 cells each condition. p-values were determined by unpaired, two-tailed student’s t-test. f, Immunoblots showing level of indicated proteins in RPE-1 CDK5-dTAG cells. Cells were treated with either DMSO or dTAG-13 for 2 hours prior to and upon release from RO-3306 and lysed at 60 minutes following release (upper panel). Quantification of the relative intensity of PP4R3β phosphorylation at S840 in dTAG13-treated CDK5-dTAG cells compared to DMSO-treatment (lower panel). Data represent mean +/− s.d. of four independent experiments. p-value was determined by one sample t and Wilcoxon test. g, Experimental scheme for specific and temporal abrogation of CDK5 in RPE-1 CDK5-dTAG cells. h, Hoechst staining showing primary nuclei and micronuclei of RPE-1 CDK5-dTAG with indicated treatment; scale bar is as indicated (left panel). Data represent mean +/− s.d. of three independent experiments from n=2094 DMSO and n=2095 dTAG-13, where n is the number of cells. p-values were determined by unpaired, two-tailed student’s t-test. Scale bar is as indicated. Uncropped gel images are provided in Supplementary Fig. 1.
Extended Data Fig. 3.
Extended Data Fig. 3.. CDK5 abrogation render chromosome alignment and segregation defect despite intact spindle assembly checkpoint and timely mitotic duration.
a and b, Live-cell imaging snapshots of RPE-1 CDK5-as cells (a) and RPE-1 CDK5-dTAG cells (b) expressing mCherry-H2B and GFP-α-tubulin, abrogated of CDK5 by treatment with 1NM-PP1 or dTAG-13, respectively. Imaging commenced in prophase following release from RO-3306 into fresh media containing indicated chemicals (left); quantification of the percentage of cells with abnormal nuclear morphology (right). c and d, Representative snapshots of the final frame prior to metaphase-to-anaphase transition from a live-cell imaging experiment detailing chromosome alignment at the metaphase plate of RPE- CDK5-as (c) and RPE-1 CDK5-dTAG (d) expressing mCherry-H2B, and GFP-α-tubulin (left); quantification of the percentage of cells displaying abnormal chromosome alignment following indicated treatments (top right). e, Representative images showing the range of depolymerization outcomes (low polymers, high polymers and spindle-like) in DMSO- and 1NM-PP1-treated cells, as shown in Fig 2e, from n=50 for each condition, where n is number of metaphase cells. f, Quantifications of mitotic duration from nuclear envelope breakdown (NEBD) to anaphase onset of RPE-1 CDK5-as (left) and RPE-1 CDK5-dTAG (right) cells, following the indicated treatments. Live-cell imaging of RPE-1 CDK5-as and RPE-1 CDK5-dTAG cells expressing mCherry-H2B and GFP-BAF commenced following release from RO-3306 arrest into fresh media containing DMSO or 1NM-PP1 or dTAG-13. g, Quantifications of the percentage of RPE-1 CDK5-as (left) and RPE-1 CDK5-dTAG (right) cells that were arrested in mitosis following the indicated treatments. Imaging commenced in prophase cells as described in a, following release from RO-3306 into fresh media in the presence or absence nocodazole as indicated. The data in a, c, and g represent mean +/− s.d. of at least two independent experiments from n=85 DMSO and n=78 1NM-PP1 in a and c; from n = 40 cells for each treatment condition in g. The data in b, d, and f represent mean +/− s.d. of three independent experiments from n=57 DMSO and n=64 dTAG-13 in b and d; from n= 78 DMSO and n=64 1NM-PP1; n=59 DMSO and n=60 dTAG-13, in f, where n is the number of cells. p-values were determined by unpaired, two-tailed student’s t-test. Scale bar is as indicated.
Extended Data Fig. 4.
Extended Data Fig. 4.. CDK5 and CDK1 regulate tubulin dynamics.
a, b, Immunostaining of RPE-1 cells with antibodies against CDK1 and α-tubulin (a); and CDK5 and α-tubulin (b) at indicated stages of mitosis. c, d, Manders’ overlap coefficient M1 (CDK1 versus CDK5 on α-tubulin) (c); and M2 (α-tubulin on CDK1 versus CDK5) (d) at indicated phases of mitosis in cells shown in a and b. The data represent mean +/− s.d. of at least two independent experiments from n = 25 cells in each mitotic stage. p-values were determined by unpaired, two-tailed student’s t-test.
Extended Data Fig. 5.
Extended Data Fig. 5.. Phosphoprotoemics analysis to identify mitotic CDK5 substrates.
a, Scheme of cell synchronization for phosphoproteomics: RPE-1 CDK5-as cells were arrested at G2/M by treatment with RO-3306 for 16 hours. The cells were treated with 1NM-PP1 to initiate CDK5 inhibition. 2 hours post-treatment, cells were released from G2/M arrest into fresh media with or without 1NM-PP1 to proceed through mitosis with or without continuing inhibition of CDK5. Cells were collected at 60 minutes post-release from RO-3306 for lysis. b, Schematic for phosphoproteomics-based identification of putative CDK5 substrates. c, Gene ontology analysis of proteins harboring CDK5 inhibition-induced up-regulated phosphosites. d, Table indicating phospho-site of proteins that are down-regulated as result of CDK5 inhibition. e, Table indicating the likely kinases to phosphorylate the indicated phosphosites of the protein, as predicted by Scansite 4. Divergent score denotes the extent by which phosphosite diverge from known kinase substrate recognition motif, hence higher divergent score indicating the corresponding kinase is less likely the kinase to phosphorylate the phosphosite.
Extended Data Fig. 6.
Extended Data Fig. 6.. Cyclin B1 is a mitotic co-factor of CDK5 and of CDK1.
a, Endogenous CDK5 was immunoprecipitated from RPE-1 cells collected at time points corresponding to the indicated cell cycle stage. Cell lysate input and elution of immunoprecipitation were immunoblotted by antibodies against the indicated proteins. RPE-1 cells were synchronized to G2 by RO-3306 treatment for 16 hours and to prometaphase (M) by nocodazole treatment for 6 hours. Asynch: Asynchronous. Uncropped gel images are provided in Supplementary Fig. 1. b, Immunostaining of RPE-1 cells with antibodies against the indicated proteins at indicated mitotic stages (upper panels). Manders’ overlap coefficient M1 (Cyclin B1 on CDK1) and M2 (CDK1 on Cyclin B1) at indicated mitotic stages for in cells shown in b (lower panels). The data represent mean +/− s.d. of at least two independent experiments from n = 25 mitotic cells in each mitotic stage. p-values were determined by unpaired, two-tailed student’s t-test. c, Table listing common proteins as putative targets of CDK5, uncovered from the phosphoproteomics anlaysis of down-regulated phosphoproteins upon CDK5 inhibition (Figure 3 and Supplementary Data Table 1), and those of cyclin B1, uncovered from phosphoproteomics analysis of down-regulated phospho-proteins upon cyclin B1 degradation (Figure 6 and Table EV2 in Hegarat et al. EMBO J. 2020). Proteins relevant to mitotic functions are highlighted in red.
Extended Data Fig. 7.
Extended Data Fig. 7.. Structural prediction and analyses of the CDK5-cyclin B1 complex.
a, Predicted alignment error (PAE) plots of the top five AlphaFold2 (AF2)-predicted models of CDK5-cyclin B1 (top row) and CDK1-cyclin B1 (bottom row) complexes, ranked by interface-predicted template (iPTM) scores. b, AlphaFold2-Multimer-predicted structure of the CDK5-cyclin B1 complex. c, Structural comparison of CDK-cyclin complexes. Left most panel: Structural-overlay of AF2 model of CDK5-cyclin B1 and crystal structure of phospho-CDK2-cyclin A3-substrate complex (PDB ID:1QMZ). The zoomed-in view of the activation loops of CDK5 and CDK2 is shown in the inset. V163 (in CDK5), V164 (in CDK2) and Proline at +1 position in the substrates are indicated with arrows. Middle panel: Structural-overlay of AF2 model of CDK5-cyclin B1 and crystal structure of CDK1-cyclin B1-Cks2 complex (PDB ID:4YC3). The zoomed-in view of the activation loops of CDK5 and CDK1 is shown in the inset. Cks2 has been removed from the structure for clarity. Right most panel: structural-overlay of AF2 models of CDK5-cyclin B1 and CDK1-cyclin B1 complex. The zoomed view of the activation loops of CDK5 and CDK1 is shown in the inset. d, Secondary structure elements of CDK5, cyclin B1 and p25. The protein sequences, labelled based on the structural models, are generated by PSPript for CDK5 (AF2 model) (i), cyclin B1 (AF2 model) (ii) and p25 (PDB ID:3O0G) (iii). Structural elements (α, β, γ) are defined by default settings in the program. Key loops highlighted in Fig. 4d are mapped onto the corresponding sequence.
Extended Data Fig. 8.
Extended Data Fig. 8.. Phosphorylation of CDK5 S159 is required for kinase activity and mitotic fidelity.
a, Structure of the CDK5-p25 complex (PDB ID: 1h41). CDK5 (blue) interacts with p25 (yellow). Serine 159 (S159, magenta) is in the T-loop. b, Sequence alignment of CDK5 and CDK1 shows that S159 in CDK5 is the analogous phosphosite as that of T161 in CDK1 for T-loop activation. Sequence alignment was performed by CLC Sequence Viewer (https://www.qiagenbioinformatics.com/products/clc-sequence-viewer/). c, Immunoblots of indicated proteins in nocodazole-arrested mitotic (M) and asynchronous (Asy) HeLa cell lysate. d, Myc-His-tagged CDK5 S159 variants expressed in RPE-1 CDK5-as cells were immunoprecipitated from nocodazole-arrested mitotic lysate by Myc-agarose. Input from cell lysate and elution from immunoprecipitation were immunoblotted with antibodies against indicated protein. EV= empty vector. In vitro kinase activity assay of the indicated immunoprecipitated complex shown on the right panel. Data represent mean +/− s.d. of four independent experiments. p-values were determined by unpaired two-tailed student’s t-test. e, Immunoblots showing RPE-1 FLAG-CDK5-as cells stably expressing Myc-His-tagged CDK5 WT and S159A, which were used in live-cell imaging and immunofluorescence experiments to characterize chromosome alignment and spindle architecture during mitosis, following inhibition of CDK5-as by 1NM-PP1, such that only the Myc-His-tagged CDK5 WT and S159A are not inhibited. Representative results are shown from three independent repeats. f, Hoechst staining showing nuclear morphology of RPE-1 CDK5-as cells expressing indicated CDK5 S159 variants following treatment with either DMSO or 1NMP-PP1 and fixation at 120 minutes post-release from RO-3306-induced arrest (upper panel); quantification of nuclear circularity and solidity (lower panels) g, Snapshots of live-cell imaging RPE-1 CDK5-as cells expressing indicated CDK5 S159 variant, mCherry-H2B, and GFP-α-tubulin, after release from RO-3306-induced arrest at G2/M, treated with 1NM-PP1 2 hours prior to and upon after release from G2/M arrest (upper panel); quantification of cells displaying abnormal chromosome alignment in (lower panel). Representative images are shown from two independent experiments, n= 30 cells each cell line. h, Representative images of RPE-1 CDK5-as cells expressing indicated CDK5 S159 variants in metaphase, treated with DMSO or 1NM-PP1 for 2 hours prior to and upon release from RO-3306-induced arrest, and then released into media containing 20μM proTAME for 2 hours, fixed and stained with tubulin and DAPI (upper panel); metaphase plate width and spindle length measurements for these representative cells were shown in the table on right; quantification of metaphase plate width and spindle length following the indicated treatments (lower panel). Data in f and h represent mean +/− s.d. of at least two independent experiments from n=486 WT, n=561 S159A, and n=401 EV, where n is the number of cells in f; from n=65 WT, n=64 S159A, and n=67 EV, where n is the number of cells in h. Scale bar is as indicated. Uncropped gel images are provided in Supplementary Fig. 1.
Extended Data Fig. 9.
Extended Data Fig. 9.. The CDK5 co-factor-binding helix regulates CDK5 kinase activity.
a, Structure of the CDK5-p25 complex (PDB ID: 1h41). CDK5 (blue) interacts with p25 (yellow) at the PSSALRE helix (green). Serine 46 (S46, red) is in the PSSALRE helix. Serine 159 (S159, magenta) is in the T-loop. b, Sequence alignment of CDK5 and CDK1 shows that S46 is conserved in CDK1 and CDK5. Sequence alignment was performed by CLC Sequence Viewer (https://www.qiagenbioinformatics.com/products/clc-sequence-viewer/). c, Immunoblots of CDK5 immunoprecipitation from lysate of E. coli BL21 (DE3) expressing His-tagged human CDK5 WT or CDK5 S46D, mixed with lysate of E. coli BL21 (DE3) expressing His-tagged human cyclin B1. Immunoprecipitated CDK5 alone or in the indicated complex were used in kinase activity assay, shown in Fig 5b. Representative results are shown from three independent repeats. d, Immunoblots showing RPE-1 FLAG-CDK5-as cells stably expressing Myc-His-tagged CDK5 S46 phospho-variants, which were used in live-cell imaging and immunofluorescence experiments to characterize chromosome alignment and spindle architecture during mitosis, following inhibition of CDK5-as by 1NM-PP1, such that only the Myc-His-tagged CDK5 S46 phospho-variants are not inhibited. Representative results are shown from three independent repeats. e, Immunostaining of RPE-1 CDK5-as cells expressing Myc-His-tagged CDK5 WT or S46D with anti-PP4R3β S840 (pS840) antibody following indicated treatment (DMSO vs 1NM-PP1). Scale bar is as indicated (left). Normalized intensity level of PP4R3β S840 phosphorylation (right). Data represent mean +/− s.d. of at least two independent experiments from n=40 WT and n=55 S46D, where n is the number of metaphase cells. p-values were determined by unpaired two-tailed student’s t-test. f, Immunoblots showing level of indicated proteins in RPE-1 CDK5-as cells expressing Myc-His-tagged CDK5 WT or S46D. Cells were treated with either DMSO or 1NM-PP1 for 2 hours prior to and upon release from RO-3306 and collected and lysed at 60 minutes following release (left). Quantification of the intensity of PP4R3β phosphorylation at S840 (right). Data represent mean +/− s.d. of four independent experiments. p-values were determined by two-tailed one sample t and Wilcoxon test. g, Representative snapshots of live-cell imaging of RPE-1 CDK5-as cells harboring indicated CDK5 S46 variants expressing mCherry-H2B and GFP-α-tubulin, treated with 1NM-PP1, as shown in Fig 5d, from n = 35 cells. Imaging commenced in prophase following release from RO-3306 into fresh media containing indicated chemicals. Uncropped gel images are provided in Supplementary Fig. 1.
Extended Data Fig. 10.
Extended Data Fig. 10.. Localization of CDK5 S46 phospho-variants.
Immunostaining of RPE-1 CDK5-as cells stably expressing Myc-His CDK5-WT, S46A, and S46D with antibodies against indicated protein in prophase, prometaphase, and metaphase. Data represent at least two independent experiments from n= 25 cells of each condition in each mitotic stage.
Extended Data Fig. 11.
Extended Data Fig. 11.. RPE-1 harboring CDK5-as introduced by CRISPR-mediated knock-in recapitulates chromosome mis-segregation defects observed in RPE-1 overexpressing CDK5-as upon inhibition of CDK5-as by 1NM-PP1 treatment.
a, Chromatogram showing RPE-1 that harbors the homozygous CDK5-as mutation F80G introduced by CRISPR-mediated knock-in (lower panel), replacing endogenous WT CDK5 (upper panel). b, Immunoblots showing level of CDK5 expressed in parental RPE-1 and RPE-1 that harbors CDK5-as F80G mutation in place of endogenous CDK5. c, Representative images of CDK5-as knocked-in RPE-1 cells exhibiting lagging chromosomes following indicated treatments. d, Quantification of percentage of cells exhibiting lagging chromosomes following indicated treatments shown in (c). Data represent mean +/− s.d. of three independent experiments from n = 252 DMSO, n = 220 1NM-PP1, where n is the number of cells. p-value was determined by two-tailed Mann Whitney U test.
Extended Data Fig. 12.
Extended Data Fig. 12.. CDK5 is highly expressed in post-mitotic neurons and overexpressed in cancers.
a, CDK5 RNAseq expression in tumors (left) with matched normal tissues (right). The data are analyzed using 22 TCGA projects. Note that CDK5 expression is higher in many cancers compared to the matched normal tissues. BLCA, urothelial bladder carcinoma; BRCA, breast invasive carcinoma; CESC cervical squamous cell carcinoma and endocervical adenocarcinoma; CHOL, cholangiocarcinoma; COAD, colon adenocarcinoma; ESCA, esophageal carcinoma; HNSC, head and neck squamous cell carcinoma; KICH, kidney chromophobe; KIRC, kidney renal clear cell carcinoma; KIRP, kidney renal papillary cell carcinoma; LIHC, liver hepatocellular carcinoma; LUAD, lung adenocarcinoma; LUSC, lung squamous cell carcinoma; PAAD, pancreatic adenocarcinoma; PCPG, pheochromocytoma and paraganglioma; PRAD, prostate adenocarcinoma; READ, rectum adenocarcinoma; SARC, sarcoma; STAD, stomach adenocarcinoma; THCA, thyroid carcinoma; THYM, thymoma; and UCEC, uterine corpus endometrial carcinoma. p-value was determined by two-sided Student’s t-test. ****: p <= 0.0001; ***: p <= 0.001; **: p <= 0.01; *: p <= 0.05; ns: not significant, p > 0.05. b, Scatter plots showing cells of indicated cancer types that are more dependent on CDK5 and less dependent on CDK1. Each dot represents a cancer cell line. The RNAi dependency data (in DEMETER2) for CDK5 and CDK1 were obtained from the Dependency Map (depmap.org). The slope line represents a simple linear regression analysis for the indicated cancer type. The four indicated cancer types (Head/Neck, Ovary, CNS/Brain, and Bowel) showed a trend of more negative CDK5 RNAi effect scores (indicative of more dependency) with increasing CDK1 RNAi effect scores (indicative of less dependency). The p value represents the significance of the correlation computed from a simple linear regression analysis of the data. Red circle highlights the subset of the cells that are relatively less dependent on CDK1 but more dependent on CDK5. c, Scatter plots showing bowel cancer cells that expresses CDK5 while being less dependent on CDK1. Each dot represents a cancer cell line. The data on gene effect of CDK1 CRISPR and CDK5 mRNA level were obtained from the Dependency Map (depmap.org). The slope line represents a simple linear regression analysis. Red circle highlights the subset of cells that are relatively less dependent on CDK1 but expresses higher level of CDK5. For b and c, solid line represents the best-fit line from simple linear regression using GraphPad Prism. Dashed lines represent 95% confidence bands of the best-fit line. p-value is determined by the F test testing the null hypothesis that the slope is zero. d, Scatter plots showing rapidly dividing cells of indicated cancer types that are more dependent on CDK5 and less dependent on CDK1. Each dots represents a cancer cell line. The doubling time data on the x-axis were obtained from the Cell Model Passports (cellmodelpassports.sanger.ac.uk). The RNAi dependency data (in DEMETER2) for CDK5, or CDK1, on the y-axis were obtained from the Dependency Map (depmap.org). Only cell lines with doubling time of less than 72 hours are displayed and included for analysis. Each slope line represents a simple linear regression analysis for each cancer type. The indicated three cancer types were analyzed and displayed because they showed a trend of faster proliferation rate (lower doubling time) with more negative CDK5 RNAi effect (more dependency) but increasing CDK1 RNAi effect (less dependency) scores. The p value represents the significance of the association of the three cancer types combined, computed from a multiple linear regression analysis of the combined data, using cancer type as a covariate. Red circle depicts subset of fast dividing cells that are relatively more dependent on CDK5 (left) and less dependent on CDK1 (right). Solid lines represent the best-fit lines from individual simple linear regressions using GraphPad Prism. p-value is for the test with the null hypothesis that the effect of the doubling time is zero from the multiple linear regression RNAi ~ Intercept + Doubling Time (hours) + Lineage.
Fig. 1
Fig. 1. Abrogation of CDK5 renders abnormal nuclear morphology, lagging chromosomes and micronuclei.
a, and b, Hoechst staining showing nuclear morphology of RPE-1 CDK5-as (a) and RPE-1 CDK5-dTAG (b) cells with indicated treatment, fixed at 120 minutes post-release from RO-3306-induced arrest at G2/M (left panel); Percentage of cells displaying abnormal nuclear morphology after indicated treatment (right panel). c and d, Quantification of nuclear circularity and solidity of RPE-1 CDK5-as (c) and CDK5-dTAG (d) from the experiment shown in (a) and (b) respectively. e and f, Representative images of RPE-1 CDK5-as (e) and CDK5-dTAG cells (f) exhibiting ACA-positive lagging chromosomes following indicated treatments. Lagging chromosomes are indicated by punctate square; scale bar is as indicated (left panel). Quantification of percentage of cells exhibiting total lagging chromosomes and ACA-positive lagging chromosomes following indicated treatments (right panel). Quantification of percentage of cells with micronuclei following indicated treatment (right panel). Data in a to e represent mean +/− s.d. of three independent experiments from n=2174 DMSO, n=1788 1NM-PP1 in a, c; n=2094 DMSO, n=2095 dTAG-13 in b, d. Data in f represent mean +/− s.d. of at least two independent experiments from n = 300 anaphase cells for each condition in e, f. p-values were determined by unpaired, two-tailed student’s t-test. Scale bar is as indicated.
Fig. 2
Fig. 2. Abrogation of CDK5 leads to chromosome alignment defects and abnormal spindle architecture.
a, Schematic depicting spindle structure parameters measured in (b) and (c). b and c, Representative images of RPE-1 CDK5-as (b) and RPE-1 CDK5-dTAG (c) cells treated as indicated, released from RO-3306 into media containing 20μM proTAME for 2 hours and stained with α-tubulin and DAPI (upper panel). Metaphase plate width and spindle length measurements for these representative cells are shown in the table on the right. Quantification of metaphase plate width and spindle length following indicated treatments (lower panel). d, Representative images of RPE-1 CDK5-as and/or RPE-1 CDK5-dTAG cells that were treated as indicated, released from RO-3306 into media containing 20μM proTAME for 2 hours and stained with α-tubulin (green) and ACA (magenta) (left). Quantification of inter-kinetochore distance (IKD) as measured by the distance between two sister kinetochores stained with ACA, following indicated treatments as described (right). e, Representative images of metaphase RPE-1 CDK5-as cells depicting indicated spindle microtubule polymer levels, as described in previous study, after the cells had been exposed to cold shock treatment; quantification of the frequency of indicated spindle microtubule polymer levels observed after cold shock treatment (right). Data in a-e represent mean +/− s.d. of three independent experiments from n=121 DMSO, n=182 1NM-PP1 in b; n=134 DMSO, n=176 dTAG-13 in c, where n is the number of metaphase cells; from n=498 DMSO, n=497 1NM-PP1; n=522 DMSO and n=562 dTAG-13 in d, where n is the number of kinetochores; from n=50 for each condition, where n is number of metaphase cells in e. p-values were determined by unpaired, two-tailed student’s t-test. Scale bar is as indicated.
Fig. 3
Fig. 3. Abrogation of CDK5 is associated with reduced phosphorylation of spindle regulators.
a, Volcano plot of differential phosphosite abundance in 1NM-PP1- versus DMSO-treated mitotic RPE-1 CDK5-as cells at 60 minutes post-release from RO-3306-induced synchronization at G2/M. Phosphosites downregulated with log2-fold change lower than −1.0 and p-value lower than 0.01 as result of 1NM-PP1 treatment are in highlighted in red. Phosphosites upregulated with log2-fold change higher than 1.0 and p-value lower than 0.01 as result of 1NM-PP1 treatment are in highlighted in blue. Phosphosites downregulated as result of 1NM-PP1 treatment, in proteins known to regulate microtubule dynamics, are indicated in black. b, Gene ontology analysis of down-regulated phosphoproteins as result of CDK5 inhibition. c, Immunoblots showing phosphorylated Ser/Pro proteins immunoprecipitated from RPE1 CDK5-as cells following indicated treatment by phospho-Ser/Pro antibody (pS/P) that recognizes CDK phosphorylation motif, and immunoblotted with antibodies against indicated proteins. The pSP band intensities, quantified by Image J, represents mean +/− s.d. from triplicate repeats of experiments. p-values were determined by unpaired, two-tailed student’s t-test. Uncropped gel images are provided in Supplementary Fig. 1. d, Representative images of metaphase RPE-1 CDK5-as cells treated with either DMSO or 1NM-PP1 upon release from RO-3306, fixed and stained with antibody against NuMA1 (upper panel); quantification of normalized intensity of NuMA1 (lower panel). Data in d represent mean +/− s.d of at least two independent experiments from n=35 DMSO and n=56 1NM-PP1, where n is the number of mitotic cells. p-values were determined by unpaired, two-tailed student’s t-test. Scale bar is as indicated.
Fig. 4
Fig. 4. Cyclin B1 forms complex with and activates CDK5 in mitosis.
a, Endogenous CDK5 or cyclin B1 was immunoprecipitated from HeLa cells, collected at time points corresponding to the indicated representative stage in mitosis after release from nocodazole-induced arrest at prometaphase, and immunoblotted by antibodies against indicated proteins. Asynch: Asynchronous. Representative results are shown from two independent repeats. b, Immunoblots of CDK5 immunoprecipitation from insect cell lysate overexpressing human CDK5, mixed with bacterial lysate overexpressing indicated CDK5 co-factors. In vitro kinase activity of the immunoprecipitated kinase complex shown on the right. Data represents mean −/+ s.d from four independent experiments. p-values were determined by unpaired, two-tailed student’s t-test. Uncropped gel images of a, b are provided in Supplementary Fig. 1.c, Immunostaining showing localization of indicated proteins in RPE-1 cells at indicated stages of mitosis. Scale bar is as indicated. Manders’ overlap coefficient M1 (cyclin B1 on CDK5) and M2 (CDK5 on cyclin B1) for cells are shown on the right panels. Data represent mean +/− s.d. of at least two independent experiments from n= 30 cells in each stage of mitosis. p-values were determined by unpaired, two-tailed student’s t-test. d, Overlay of CDK5 (green)-cyclin B1 (cyan) model complex on CDK5 (peach)-p25 (yellow) crystal structure (PDB ID:3O0G). Inset shows the CDK5 activation loop positioning in both complexes.
Fig. 5
Fig. 5. Disruption of the CDK5-cyclin B1 complex phenotypically recapitulates CDK5 abrogation.
a, Immunoblots of FLAG immunoprecipitation of indicated FLAG-CDK5 variants expressed in RPE-1, arrested in prometaphase by nocodazole treatment. Uncropped gel images are provided in Supplementary Fig. 1. b, Quantification of relative kinase activity of indicated immunoprecipitated CDK5 kinase complex. Data represent mean +/− s.d from three independent experiments. c, Hoechst staining showing nuclear morphology of RPE-1 CDK5-as cells expressing indicated S46 phospho-variants, treated with 1NM-PP1, fixed at 120 minutes post-release from RO-3306-induced arrest at G2/M. Quantification of nuclear circularity and nuclear solidity (lower panels). d, Representative snapshots of the final frame prior to metaphase-to-anaphase transition from live-cell imaging experiments detailing chromosome alignment at the metaphase plate of RPE-1 CDK5-as cells treated with 1NM-PP1 and expressing indicated S46 phospho-variants, mCherry-H2B, and GFP-α-tubulin; quantification of the percentage of cells displaying abnormal chromosome alignment in metaphase (lower panel). e, Representative images of RPE-1 CDK5-as cells expressing indicated S46 phospho-variants, treated with 1NM-PP1 prior and upon release from RO-3306-induced arrest into media containing proTAME, and stained with α-tubulin and DAPI; measurements of metaphase plate width and spindle lengths of cells shown in the representative image are indicated in a table on the right (lower panel); quantification of metaphase plate width and spindle length following indicated treatments (right panel). Data in c represent mean +/− s.d. of three independent experiments from n=1201 WT, n=1993 S46A, n=2444 S46D, and n=1820 EV, where n is the number of cells. Data in d and e represent mean +/− s.d. of at least two independent experiments from n= 35 cells for each treatment condition in d; n=55 WT, n=75 S46A, n=81 S46D, and n=66 EV in e, where n is the number of cells. p-values were determined by unpaired, two-tailed student’s t-test. Scale bar is as indicated.

References

    1. Wieser S & Pines J The biochemistry of mitosis. Cold Spring Harb Perspect Biol 7, a015776 (2015). - PMC - PubMed
    1. Dhavan R & Tsai LH A decade of CDK5. Nat Rev Mol Cell Biol 2, 749–759 (2001). - PubMed
    1. Malumbres M Cyclin-dependent kinases. Genome Biol 15, 122 (2014). - PMC - PubMed
    1. Coverley D, Laman H & Laskey RA Distinct roles for cyclins E and A during DNA replication complex assembly and activation. Nat Cell Biol 4, 523–528 (2002). - PubMed
    1. Desai D, Wessling HC, Fisher RP & Morgan DO Effects of phosphorylation by CAK on cyclin binding by CDC2 and CDK2. Mol Cell Biol 15, 345–350 (1995). - PMC - PubMed

LinkOut - more resources