. 2024 Oct;634(8035):970-978.
doi: 10.1038/s41586-024-07894-z. Epub 2024 Sep 4.

A pathology foundation model for cancer diagnosis and prognosis prediction

Affiliations

A pathology foundation model for cancer diagnosis and prognosis prediction

Xiyue Wang et al. Nature. 2024 Oct.

Abstract

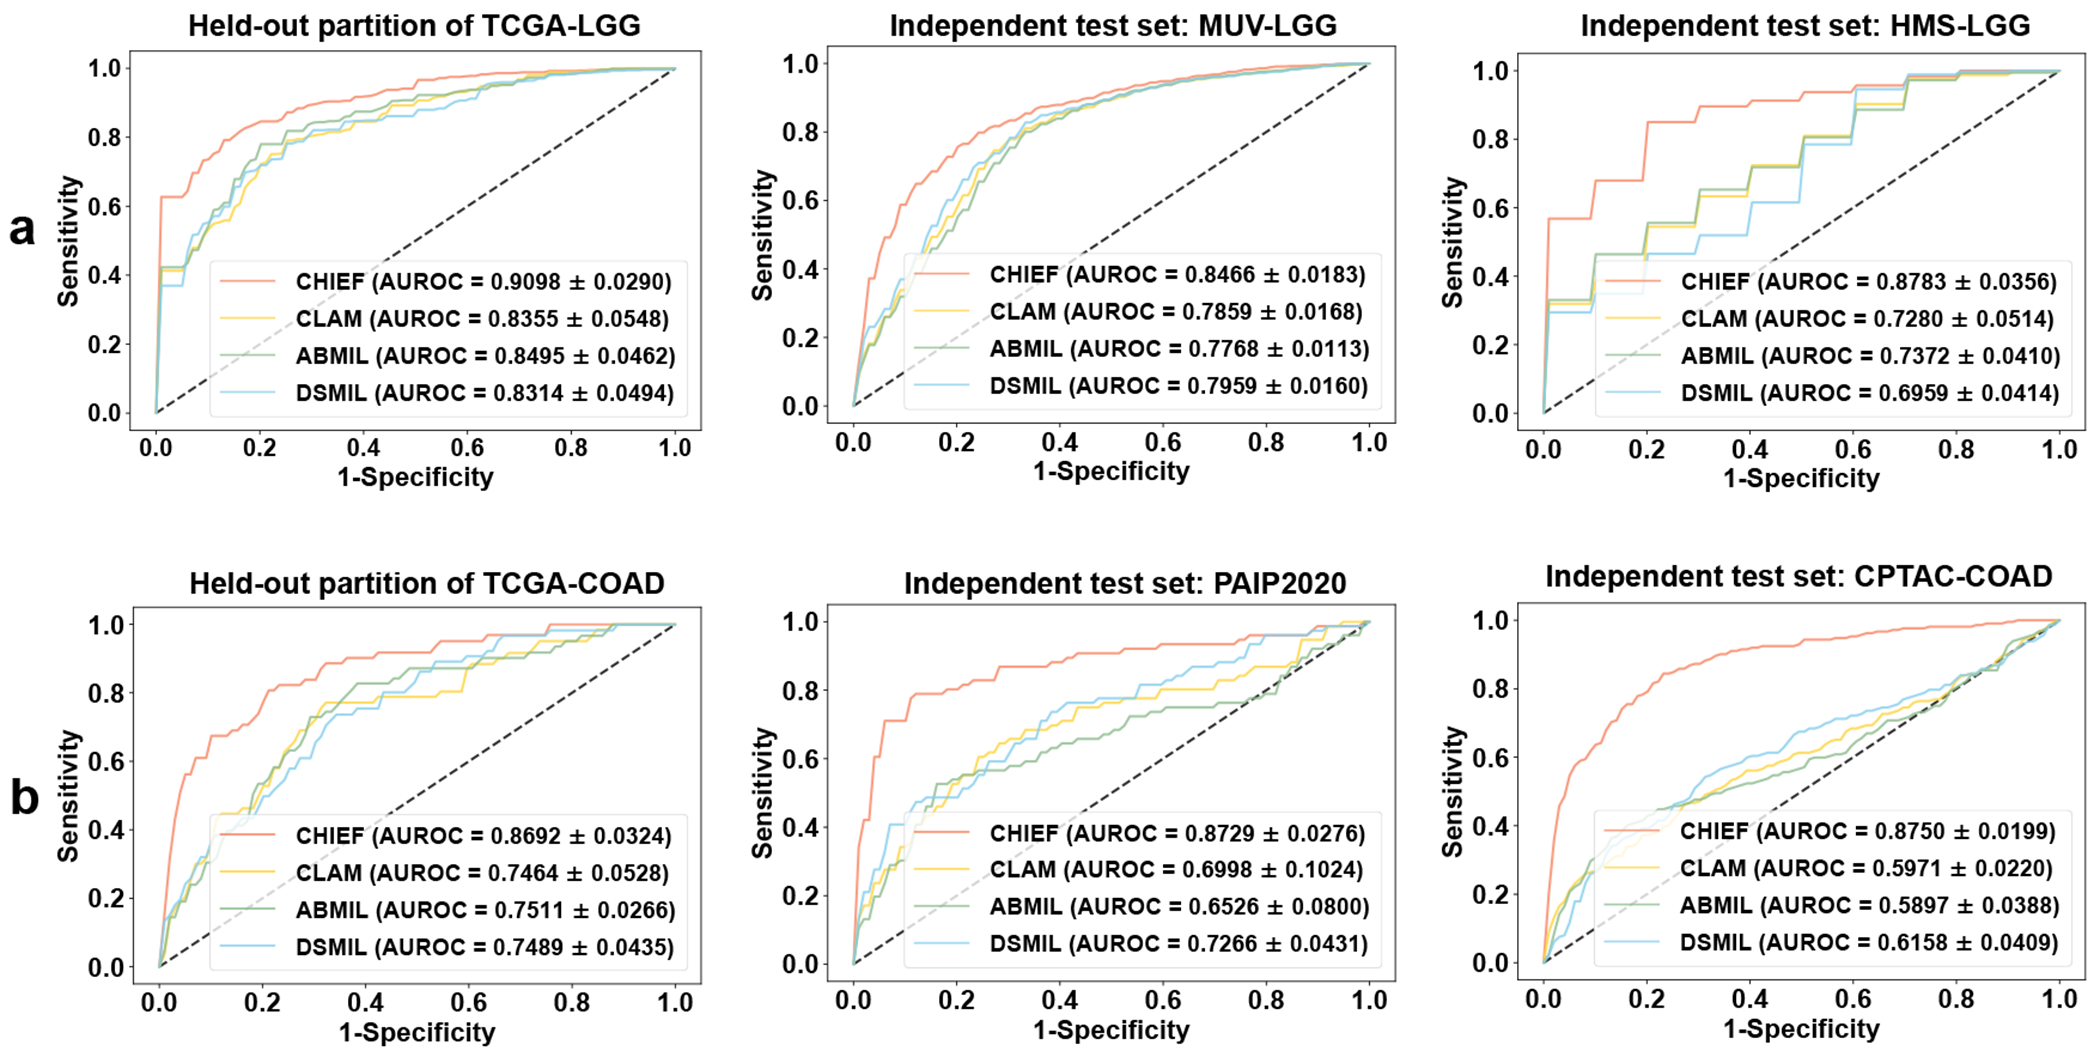
Histopathology image evaluation is indispensable for cancer diagnoses and subtype classification. Standard artificial intelligence methods for histopathology image analyses have focused on optimizing specialized models for each diagnostic task1,2. Although such methods have achieved some success, they often have limited generalizability to images generated by different digitization protocols or samples collected from different populations3. Here, to address this challenge, we devised the Clinical Histopathology Imaging Evaluation Foundation (CHIEF) model, a general-purpose weakly supervised machine learning framework to extract pathology imaging features for systematic cancer evaluation. CHIEF leverages two complementary pretraining methods to extract diverse pathology representations: unsupervised pretraining for tile-level feature identification and weakly supervised pretraining for whole-slide pattern recognition. We developed CHIEF using 60,530 whole-slide images spanning 19 anatomical sites. Through pretraining on 44 terabytes of high-resolution pathology imaging datasets, CHIEF extracted microscopic representations useful for cancer cell detection, tumour origin identification, molecular profile characterization and prognostic prediction. We successfully validated CHIEF using 19,491 whole-slide images from 32 independent slide sets collected from 24 hospitals and cohorts internationally. Overall, CHIEF outperformed the state-of-the-art deep learning methods by up to 36.1%, showing its ability to address domain shifts observed in samples from diverse populations and processed by different slide preparation methods. CHIEF provides a generalizable foundation for efficient digital pathology evaluation for patients with cancer.


Conflict of interest statement

Jun Zhang and X.H. were employees of Tencent AI Lab. K.-H.Y. is an inventor of U.S. patent 16/179,101 (patent assigned to Harvard University) and was a consultant of Curatio.DL (not related to this work). K.L.L. was a consultant of Travera, BMS, Servier, Integragen, LEK, and Blaze Bioscience, received equity from Travera, and has research funding from BMS and Lilly (not related to this work). The remaining authors declare no competing interests.

Figures

Extended Data Fig. 1.
Extended Data Fig. 1.. CHIEF accurately identified the origins of tumors, with results validated in independent patient cohorts from the Clinical Proteomic Tumor Analysis Consortium (CPTAC).
a. The confusion matrix of CHIEF’s prediction in the held-out test sets. The overall macro-averaged accuracy of CHIEF is 0.895. b. CHIEF achieved high prediction performance and generalizability to independent cohorts in tumor origin prediction (AUROC=0.9853±0.0245). Micro-averaged one-versus-rest ROC curves for tumor origin classification are shown. We presented the AUROC±s.d. calculated across 18 tumor origins. In comparison, state-of-the-art methods have substantially lower performance in the independent cohorts (two-sided Wilcoxon signed-rank test P-value=0.000015). c. CHIEF attained higher accuracy than state-of-the-art deep learning methods in tumor origin prediction. Overall accuracies for the held-out (n=1,895) and independent test sets (n=3,019) for CHIEF and other deep learning methods are shown. d. CHIEF attained higher AUROC, sensitivity, and specificity for each tumor origin in the held-out test sets (n=1,895) compared with other methods. The model performance for all 18 tumor origins is shown. e. CHIEF possessed significantly higher AUROC, sensitivity, and specificity for each origin in the independent test sets (n=3,019, P-value=0.003906, two-sided Wilcoxon signed-rank test). In contrast, standard machine learning approaches suffer from substantial performance drops when applied to patient cohorts not involved in model development. In c-e, error bars represent 95% confidence intervals computed by the bootstrap method (n=1,000 replicates), and the centers represent the values of various performance metrics specified in these figure panels. The detailed sample size for each cancer type shown in d-e can be found in Supplementary Table 14.
Extended Data Fig. 2.
Extended Data Fig. 2.. Visualization of model attention scores showed CHIEF accurately identified cancerous regions of melanoma, lung, and kidney cancers.
For each cancer type, the left image panel represented the ground truth annotations labeled by experienced pathologists. Because CHIEF employs a weakly supervised approach that only requires slide-level annotations, these region-level annotations were not used during the training phase. The middle panel visualized the amount of attention CHIEF paid to each region in the WSIs. The right panel showed the zoomed-in view of regions receiving high (image tiles with red outlines) and low (image tiles with black outlines) attention scores. The original WSIs and their corresponding heatmaps are available at https://yulab.hms.harvard.edu/projects/CHIEF/CHIEF.htm.
Extended Data Fig. 3.
Extended Data Fig. 3.. Detailed genetic mutation prediction results organized by cancer types.
Prediction performance of prevalent genetic mutations (n=11,483) and targeted-therapy-associated genetic mutations (n=6,013) is shown. The detailed sample counts for each genetic mutation are available in Supplementary Tables 17–18. CHIEF predicted several prevalent mutations (e.g., TP53 in ACC, LGG, and UCEC) with AUROCs > 0.80. The mean ± 95% confidence interval is shown for each prediction task. Error bars represent the 95% confidence intervals estimated by 5-fold cross-validation (5 independent runs).
Extended Data Fig. 4.
Extended Data Fig. 4.. CHIEF attained a high performance in predicting genetic mutation status from histopathology images across cancer types.
Prediction performance in the held-out test set (TCGA) and independent test set (CPTAC) were shown side by side. These results were grouped by the genes to highlight the prediction performance of the same genes across cancer types. The red and blue horizontal lines represent the average AUROCs in the held-out and independent test sets, respectively. a. CHIEF’s performance in predicting mutation status for frequently mutated genes across cancer types. Supplementary Table 17 shows the detailed sample count for each cancer type. b. CHIEF’s performance in predicting genetic mutation status related to FDA-approved targeted therapies. Supplementary Table 18 shows the detailed sample count for each cancer type. In a and b, results are presented as mean ± 95% confidence interval. Error bars represent the 95% confidence intervals estimated by 5-fold cross-validation.
Extended Data Fig. 5:
Extended Data Fig. 5:. CHIEF predicted IDH status of glioma samples in multiple patient cohorts.
CHIEF classified glioma samples with and without IDH mutation. Here, we showed that CHIEF successfully predicted IDH mutation status in both high and low histological grade groups defined by conventional visual-based histopathology assessment. a. Regions with increased cellularity and perinuclear halos received high model attention in IDH-mutant samples, while regions showing poorer cell adhesion received high attention in IDH-wildtype slides. We used samples from the MUV-GBM dataset as an example for this visualization. The bottom figures show the corresponding image tiles. Six experienced pathologists (see Methods) examined these tiles independently and annotated the morphological patterns correlated with regions receiving high and low attention. b. IDH-mutant gliomas from the six cohorts exhibit a similar bi-modal distribution along the attention score axis. In contrast, IDH-wildtype gliomas display an unimodal distribution with mostly low-attention image regions. We normalized the attention scores to a range from 0 to 1, representing the importance of each image tile to the prediction output by CHIEF. These analyses included samples from TCGA-GBM (n=834), MUV-GBM (n=507), HMS-GBM (n=88), TCGA-LGG (n=842), MUV-LGG (n=365), and HMS-LGG (n=82). In these violin plots, the central white dots represent the median, the thick black bars indicate the interquartile range (IQR), and the thin black lines (whiskers) extend to 1.5 times the IQR from the first and third quartiles. The width of the violin represents the density of data at different values.
Extended Data Fig. 6.
Extended Data Fig. 6.. CHIEF predicted MSI status in multiple colorectal cancer patient cohorts.
a. Solid tumor regions of MSI-high samples received high attention scores, while adjacent benign mucosal epithelium regions received low attention scores. In MSI-low samples, most regions received low attention scores. Example images from the PAIP2020 dataset were shown in this visualization. The bottom portion of this figure panel showed image tiles receiving high and low attention scores. Malignant regions were highly attended in both MSI-low and MSI-high samples. Solid tumors, intraluminal and extraluminal mucin, and signet ring cells received high attention in MSI-high samples. In MSI-low samples, infiltrative malignant glands interfacing with fibroblasts, luminal necrosis, and lymphocytic infiltrates received relatively high attention. Adjacent benign colonic epithelium receives low attention in both MSI-high and MSI-low patients. b. CHIEF paid high levels of attention to 30% of regions in MSI-high samples, while more regions in MSI-low samples received low attention scores. Attention score distributions of the three patient cohorts (n=437 in TCGA-COAD, n=77 in PAIP2020, and n=221 in CPTAC-COAD) are shown. In these violin plots, the central white dots represent the median, the thick black bars indicate the interquartile range (IQR), and the thin black lines (whisker) extend to 1.5 times the IQR from the first and third quartiles. The width of the violin represents the density of data at different values.
Extended Data Fig. 7.
Extended Data Fig. 7.. Survival prediction results for patients with all stages.
Previous methods pooled patients with all stages in their survival outcome prediction, , . To facilitate comparisons with these previous reports, we compared CHIEF with baseline methods in this study setting, using 9,404 whole slide images from 6,464 patients. CHIEF attained substantially better survival prediction performance (unadjusted two-sided log-rank test P-value < 0.05 in all patient cohorts under study) and distinguished patients with different survival outcomes using histopathology images alone. Supplementary Fig. 5 shows results from two baseline methods (PORPOISE and DSMIL). Error bands represent 95% confidence intervals.
Extended Data Fig. 8.
Extended Data Fig. 8.. Visualization of model attention showed regions of importance in survival prediction for lung cancer patients.
In patients with shorter-term survival, CHIEF paid high levels of attention to lesional regions with high tumor cellularity and strands of fibrosis in lung adenocarcinoma, tumor budding in squamous cell carcinoma, and necrotic regions in both types of lung cancers. In contrast, highly attended regions in patients with lower mortality risks highlighted dyskeratosis in lung squamous cell carcinoma. The original WSIs and their corresponding heatmaps are available at https://yulab.hms.harvard.edu/projects/CHIEF/CHIEF_survival.htm.
Extended Data Fig. 9.
Extended Data Fig. 9.. Quantitative analyses of regions receiving high attention revealed pathology microenvironments predictive of molecular profiles and survival outcomes.
For each WSI, we selected the top 1% of patches with the highest attention from CHIEF at 40× magnification. We excluded WSIs with fewer than 100 image patches. We employed Hover-Net trained with pathologists’ annotations in the PanNuke dataset (including tumor cells, lymphocytes, stromal cells, necrotic cells, and epithelial cells) for cell segmentation and classification. We compared the cell type compositions across different patient groups. a. Colorectal cancer samples with MSI-high status have significantly more tumor-infiltrating lymphocytes in the high-attention regions (unadjusted two-sided Mann-Whitney U test P-value=0.00052 in PAIP2020, P-value=0.00016 in CPTAC-COAD). b. IDH wild-type glioma samples have significantly more necrotic cells (unadjusted two-sided Mann-Whitney U test P-value=0.00006 in TCGA-GBM and P-value=0.000001 in TCGA-LGG). c. Samples from longer-term colorectal cancer survivors have a larger number of stromal cells, more tumor-infiltrating lymphocytes, and fewer tumor cells in the high-attention regions, compared with those with shorter-term survival. Samples from shorter-term lung squamous cell carcinoma survivors have a larger fraction of tumor cells and smaller fractions of lymphocytes and epithelial cells in the high-attention regions, compared with those with longer-term survival. These analyses included samples from PAIP2020 (n=77), CPTAC-COAD (n=221), TCGA-GBM (n=825), TCGA-LGG (n=834), TCGA-COADREAD (n=520), and TCGA-LUSC (n=400). In these box plots, the central lines indicate the median, box bounds are the 25th and 75th percentiles, and whiskers extend to 1.5 times the interquartile range. In these figures, one star (*), two stars (**), three stars (***), and four stars (****) represent P-value < 0.05, P-value < 0.01, P-value < 0.001, and P-value < 0.0001, respectively.
Fig. 1.
Fig. 1.. An overview of the Clinical Histopathology Imaging Evaluation Foundation (CHIEF) model.
a. CHIEF is a generalizable machine learning framework for weakly supervised histopathological image analysis. CHIEF extracts pathology imaging representations useful for cancer classification, tumor origin prediction, genomic profile prediction, and prognostic analyses. During the pretraining process, we cropped the WSIs into non-overlapping imaging tiles, and we encoded the anatomic site information of each WSI using the CLIP embedding method to obtain a feature vector for each anatomic site. We merged the text and image embeddings to represent the heterogeneous pathology information from the training data. We then employed the pathology imaging features extracted by CHIEF to infer cancer types directly. In the genomic profile and prognostic prediction tasks, CHIEF features served as the foundation for fine-tuning models for each specific task. These graphics were created with BioRender.com. b. A summary of the 60,530 slides for training the CHIEF model. We collected these pathology slides belonging to 19 anatomical sites from 14 cohorts. c. CHIEF significantly outperformed state-of-the-art methods in cancer classification, genomic profile identification, and survival prediction tasks by up to 36.1%.
Fig. 2.
Fig. 2.. CHIEF outperformed state-of-the-art deep learning methods in detecting cancer cells using whole slide pathology images.
We validated CHIEF’s capability of cancer detection using 15 independent datasets collected from multiple hospitals worldwide. Our test datasets encompassed 13,661 whole-slide images from 11 sites of origin. a. CHIEF attained up to 0.9943 in the AUROCs across 15 independent test datasets and consistently outperformed (two-sided Wilcoxon signed-rank test P-value=0.000061) three deep learning methods (i.e., CLAM, ABMIL, and DSMIL). The receiver operating characteristic (ROC) curves of CHIEF and baseline methods are shown. The mean AUROC and its 95% confidence intervals, calculated using the nonparametric bootstrapping method (n=1,000 replicates), are presented. b. Visualization of model attention scores showed CHIEF accurately identified cancerous regions within WSIs. For each cancer type, the left image panel represented the ground truth annotations labeled by experienced pathologists. The middle panel visualized the amount of attention CHIEF paid to each region in the WSIs. The right panel showed the zoomed-in view of regions receiving high (image tiles with red outlines) and low (image tiles with black outlines) attention scores. The original WSIs and their corresponding heatmaps are available at https://yulab.hms.harvard.edu/projects/CHIEF/CHIEF.htm.
Fig. 3.
Fig. 3.. CHIEF successfully predicted genetic mutations across cancer types using histopathology images.
CHIEF predicted prevalent somatic mutations (n=11,483) and mutations related to targeted therapies (n=6,013) in multiple cancer types using histopathology images alone. We stratified our analyses by cancer types and organized the prediction results by genes. The detailed sample counts for each cancer type can be found in Supplementary Tables 17–18. Due to differences in the tumor microenvironment in different cancer types, variations in the prediction performance were observed. The mean ± 95% confidence interval for each prediction task is shown. Error bars represent the 95% confidence intervals estimated by 5-fold cross-validation.
Fig. 4:
Fig. 4:. CHIEF predicted the IDH status of glioma samples and the MSI status of colorectal cancer patients in multiple cohorts.
a. CHIEF successfully identified IDH mutation status in low histological grade groups (n=1,289). These results indicated that CHIEF characterized IDH-related morphological signals independent of histological grades. The left figures show the mean ROCs of 10-fold cross-validations using the TCGA-LGG (n=842) dataset. The middle and right figures show the validation results in the independent datasets (MUV-LGG (n=365) and HMS-LGG (n=82)). b. CHIEF identified MSI-high patients with AUROCs of 0.869-0.875. The left figure panel represented the MSI prediction performance in the TCGA-COAD dataset (n=437) using 4-fold cross-validation. The middle and right panels illustrated the performance of two independent test sets (i.e., PAIP2020 (n=77) and CPTAC-COAD (n=221)). Results in a-b are presented as mean ± s.d. across cross-validation.
Fig. 5:
Fig. 5:. CHIEF predicted survival outcomes of cancer patients, with the results validated in 15 validation cohorts collected from multiple hospitals worldwide.
a. CHIEF distinguished longer-term survivors from shorter-term survivors among stage I and stage II cancer patients (n=4,147). Kaplan-Meier curves for CHIEF-based predictions are shown. Two-sided log-rank test without adjustment is used to compare the survival distributions between the high-risk and low-risk groups (P=0.0005 in TCGA-BRCA, P=0.0189 in DFCI-BRCA, P=0.0013 in PLCO-BRCA, P<0.0001 in TCGA-RCC, P=0.0495 in CPTAC-RCC, P=0.0293 in BWH-RCC, P=0.0006 in TCGA-LUAD, P=0.035 in DFCI-LUAD, P=0.011 in PLCO-LUAD, P=0.0144 in TCGA-LUSC, P<0.0001 in CPTAC-LUSC, P=0.0004 in TCGA-UCEC, P=0.0176 in CPTAC-UCEC, P=0.0003 in TCGA-COADREAD, and P=0.0008 in PLCO-Colon). Error bands represent 95% confidence intervals. b. CHIEF significantly outperformed other methods in predicting cancer patients’ survival outcomes. Concordance indices (c-index) of held-out (n=2,593) and independent cohorts (n=1,554) are shown. Box plots were generated based on 5-fold cross-validation. Dashed lines represent the mean c-indices across datasets. In these box plots, the central line is the median, box bounds are the 25th and 75th percentiles, and whiskers extend to 1.5 times the interquartile range. These statistics included samples from TCGA-BRCA (n=760), TCGA-COADREAD (n=294), TCGA-LUAD (n=344), TCGA-LUSC (n=334), TCGA-RCC (n=507), TCGA-UCEC (n=354), DFCI-BRCA (n=48), PLCO-BRCA (n=647), DFCI-LUAD (n=235), PLCO-LUAD (n=139), CPTAC-LUSC (n=81), CPTAC-RCC (n=124), BWH-RCC (n=49), CPTAC-UCEC (n=183), and PLCO-COLON (n=48).

References

    1. Van der Laak J, Litjens G & Ciompi F Deep learning in histopathology: the path to the clinic. Nat. Med 27, 775–784 (2021). - PubMed
    1. Shmatko A, Ghaffari Laleh N, Gerstung M & Kather JN Artificial intelligence in histopathology: enhancing cancer research and clinical oncology. Nat. Cancer 3, 1026–1038 (2022). - PubMed
    1. Song AH et al. Artificial intelligence for digital and computational pathology. Nat. Rev. Bioeng 1, 930–949 (2023).
    1. Campanella G et al. Clinical-grade computational pathology using weakly supervised deep learning on whole slide images. Nat. Med 25, 1301–1309 (2019). - PMC - PubMed
    1. Bejnordi BE et al. Diagnostic assessment of deep learning algorithms for detection of lymph node metastases in women with breast cancer. JAMA 318, 2199–2210 (2017). - PMC - PubMed

Method References

    1. Cancer Genome Atlas Research Network, J. et al. The cancer genome atlas pan-cancer analysis project. Nat. Genet 45, 1113–1120 (2013). - PMC - PubMed
    1. Lonsdale J et al. The genotype-tissue expression (GTEx) project. Nat. Genet 45, 580–585 (2013). - PMC - PubMed
    1. Bulten W et al. Artificial intelligence for diagnosis and gleason grading of prostate cancer: the PANDA challenge. Nat. Med 1–10 (2022). - PMC - PubMed
    1. Yacob F et al. Weakly supervised detection and classification of basal cell carcinoma using graph-transformer on whole slide images. Sci. Rep 13, 1–10 (2023). - PMC - PubMed
    1. Xu F et al. Predicting axillary lymph node metastasis in early breast cancer using deep learning on primary tumor biopsy slides. Front. Oncol 11, 4133 (2021). - PMC - PubMed

Publication types