. 2024 Oct;634(8033):415-423.
doi: 10.1038/s41586-024-07898-9. Epub 2024 Sep 4.

DNA methylation controls stemness of astrocytes in health and ischaemia

Affiliations

DNA methylation controls stemness of astrocytes in health and ischaemia

Lukas P M Kremer et al. Nature. 2024 Oct.

Abstract

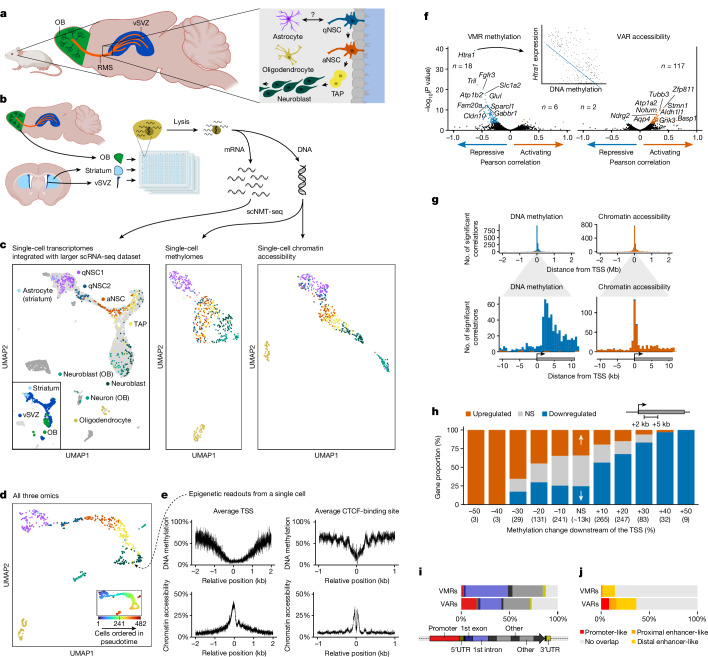
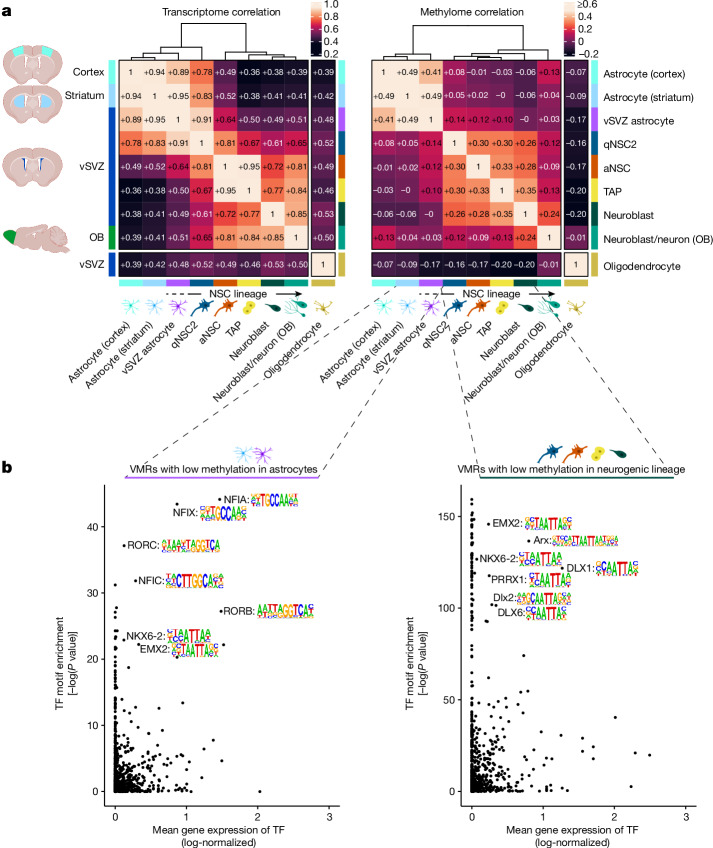
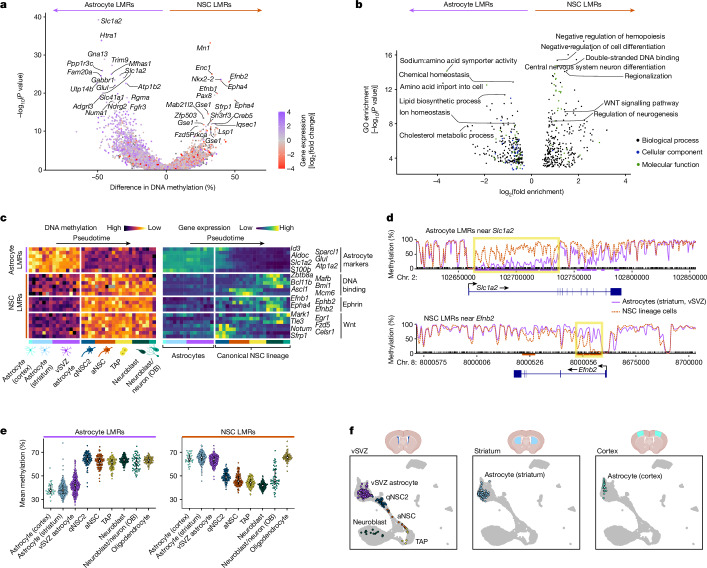
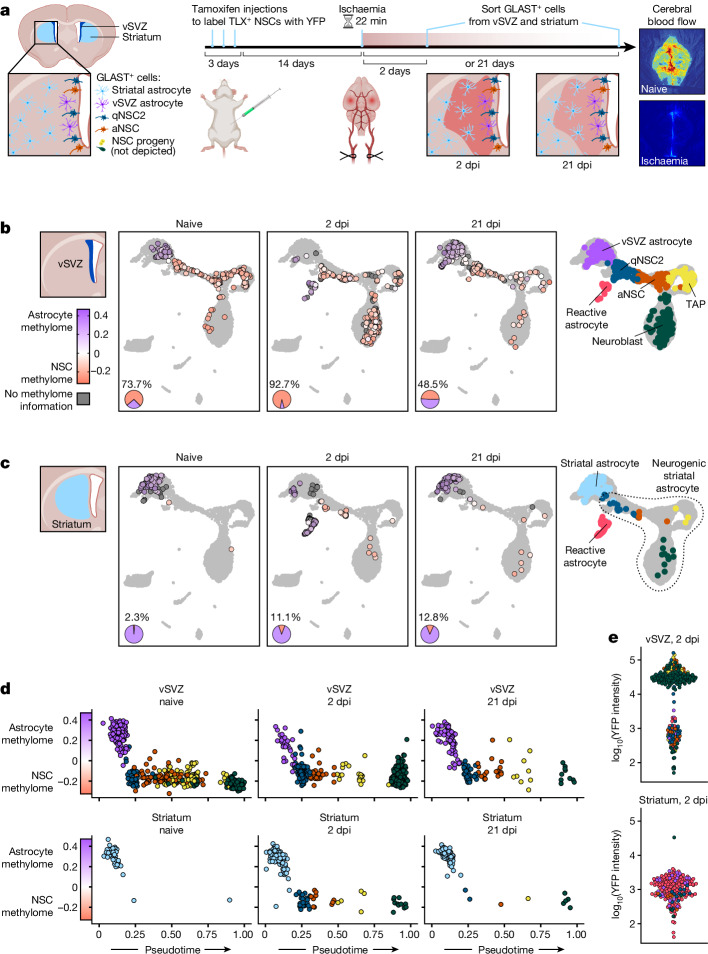
Astrocytes are the most abundant cell type in the mammalian brain and provide structural and metabolic support to neurons, regulate synapses and become reactive after injury and disease. However, a small subset of astrocytes settles in specialized areas of the adult brain where these astrocytes instead actively generate differentiated neuronal and glial progeny and are therefore referred to as neural stem cells1-3. Common parenchymal astrocytes and quiescent neural stem cells share similar transcriptomes despite their very distinct functions4-6. Thus, how stem cell activity is molecularly encoded remains unknown. Here we examine the transcriptome, chromatin accessibility and methylome of neural stem cells and their progeny, and of astrocytes from the striatum and cortex in the healthy and ischaemic adult mouse brain. We identify distinct methylation profiles associated with either astrocyte or stem cell function. Stem cell function is mediated by methylation of astrocyte genes and demethylation of stem cell genes that are expressed later. Ischaemic injury to the brain induces gain of stemness in striatal astrocytes7. We show that this response involves reprogramming the astrocyte methylome to a stem cell methylome and is absent if the de novo methyltransferase DNMT3A is missing. Overall, we unveil DNA methylation as a promising target for regenerative medicine.


Conflict of interest statement

The authors declare no competing interests.

Figures

Fig. 1
Fig. 1. Single-cell triple-omics of the adult NSC lineage.
a, Schematic depiction of the adult NSC lineage of the vSVZ. NSCs represent a specialized subset of astrocytes. OB, olfactory bulb. b, Schematic of the workflow to obtain scNMT-seq data from three brain regions. c, UMAP visualization of each molecular layer, colour coded as in a. Single-cell transcriptomes (540 cells from 5 replicates) were integrated with the larger dataset from ref. , which comprises cells from the vSVZ (light grey) and striatum, RMS and olfactory bulb (dark grey). Bottom left, tissue of origin for each cell. d, UMAP and pseudotime ranks (excluding oligodendrocytes) based on data from all three molecular layers. e, Average methylation and chromatin accessibility levels around TSSs and CTCF-binding sites of one individual neuroblast. f, Correlation of VMR methylation and VAR accessibility with expression of the nearest gene. Negative correlations (blue) indicate a repressive effect of methylation or accessibility; positive correlations (orange) indicate activation. n is the number of nominally significant correlations (Pearson’s two-sided correlation test) after Benjamini–Hochberg adjustment. The y axis shows unadjusted P values. g, Top, distance histogram of all significant correlations (blue, negative; orange, positive) between gene expression and all VMRs and VARs within 2 Mb of the TSS. Bottom, magnified view of the indicated region. h, Genes binned according to methylation change downstream of their TSS. Bar colour denotes the proportion of genes upregulated or downregulated, according to their transcript expression in the NSC lineage; parenthesized numbers denote gene number per bin. NS, not significant. i,j, Overlap of significantly correlating VMRs and VARs with gene features (i) and candidate cis-regulatory elements (j). UTR, untranslated region.
Fig. 2
Fig. 2. Despite similar gene expression, NSCs possess a unique methylome that distinguishes them from other astrocytes.
a, Correlation matrices and hierarchical clustering of gene expression and DNA methylation data, averaged for each cell state. Left, correlation of log-normalized expression values for genes expressed in at least 10% of cells. Right, correlation of methylation values for the 40,000 VMRs with the highest sequencing coverage. b, Motif enrichment of VMRs with low methylation in astrocytes (vSVZ and striatum) or cells of the neurogenic lineage. The scatter plots of transcription factors (TFs) show the unadjusted one-sided enrichment P values reported by HOMER for the transcription factor motif on the y axis, and the mean gene expression for the transcription factor in the respective cell population on the x axis. Human transcription factors are set in all upper case and mouse transcription factors are set with initial upper case only.
Fig. 3
Fig. 3. NSCs possess a pro-neurogenic methylome that clearly distinguishes them from common parenchymal astrocytes.
a, Volcano plot of VMRs, tested for differential methylation between astrocytes (vSVZ and striatum) and cells of the NSC lineage (two-sided Wilcoxon test). VMRs are coloured according to differential expression of the nearest gene. Some genes, such as Slc1a2, intersect multiple VMRs. VMRs with Benjamini–Hochberg adjusted P value < 0.05 were labelled as LMRs. The y axis shows unadjusted P values. b, GO term enrichment of genes near astrocyte LMRs and NSC LMRs from a. The y axis shows unadjusted one-sided GREAT binomial P value. c, Heat map of methylation level (left) and the expression of intersecting genes (right) for selected LMRs along pseudotime. Rows are ordered by hierarchical clustering of gene expression values. Note the clear separation of astrocytes and cells of the canonical NSC lineage (qNSC2→neuroblast) in the methylation data. d, Methylation tracks of Slc1a2 and Efnb2. The curves depict the smoothed average methylation in two pseudobulk cell populations (purple, striatal and vSVZ astrocytes; red, qNSC2→neuroblast). LMRs are marked by red or purple lines below the tracks. Slc1a2 represents an extreme case with a long stretch of differential methylation, whereas differential methylation at Efnb2 occurs predominantly at the first intron (both highlighted in yellow). e, Mean methylation of astrocyte LMRs and NSC LMRs in n = 1,880 cells from 10 samples. Error bars indicate interquartile range; white dots show the median. f, Independent sample of GLAST+ cells from three tissues, used to assess astrocyte LMR methylation in the cortex. scNMT-seq transcriptomes are integrated with data from ref. , corresponding methylomes represent subset of the cells in e.
Fig. 4
Fig. 4. Ischaemic injury induces an NSC methylome in striatal astrocytes.
a, Experiment to assess the effects of ischaemic injury on GLAST+ cells in the vSVZ (astrocytes, NSCs and NSC progeny) and striatum (astrocytes). Both tissues were analysed by scNMT-seq at 2 dpi and 21 dpi. Tamoxifen injections label TLX+ NSCs via Cre-inducible YFP expression to detect potential NSCs that may migrate to the striatum. Right, laser speckle imaging of cerebral blood flow in representative naive and ischaemic mouse brains. b, UMAP visualization of GLAST+ triple-omic cells isolated from the vSVZ (large points), integrated with a larger scRNA-seq dataset (grey shaded region). UMAP coordinates reflect the transcriptomic state and colour reflects the methylome state (Extended Data Fig. 5a,b) of each cell. Pie charts show the proportion of cells inside the neurogenic lineage (qNSC2→neuroblast lineage is shown in salmon). c, GLAST+ cells isolated from the striatum, depicted as in b. d, Methylome state of cells in transcriptome-based pseudotime. e, TLX–YFP fluorescence intensity for a subset of cells that were index-sorted, demonstrating that cells in the striatum do not derive from TLX+ vSVZ NSCs.
Fig. 5
Fig. 5. Ischaemic injury does not induce neurogenesis in Dnmt3a-deficient mice.
a, Experiment to assess whether injury-induced neurogenesis in the striatum depends on the de novo DNA methyltransferase DNMT3A. b, FACS quantification of PSA-NCAM+ neuroblasts in the naive or post-ischaemic striatum of n = 9 Dnmt3a-deficient mice and n = 10 wild-type control mice. Dots represent individual mice, columns represent the mean (on the logit scale) and error bars mark 95% confidence intervals. Brackets mark comparisons, with P value for the (two-sided) contrast indicated above and 95% confidence interval for the difference below the bracket. All inference is performed using a linear model fitted on the logit scale. The P value for the interaction (that is, against the null hypothesis of the two bracket-marked differences not being equal) is 0.017. c, Schematic depiction of genes involved in astrocyte function and neurogenesis, and their methylation and gene expression status in different cell states. d, We propose that DNA methylation locks common parenchymal astrocytes in their astrocyte fate by repressing genes required for neurogenesis. By contrast, these genes are demethylated in NSCs, which permits their progression along the neurogenic lineage. Source Data
Extended Data Fig. 1
Extended Data Fig. 1. Quality measures and marker expression.
a, scNMT-seq quality metrics for all cells that passed quality filtering. “Unique genes” refers to the number of genes with at least one sequencing read per cell. “CpG/GpC-dinucleotides” refers to the number of methylation sites with sequencing coverage and thus known methylation status (large circle: median; error bar: interquartile range). For quality metrics of all cells reported in this study, see Supplementary Fig. 1. b, Gene expression of key marker genes and transcription factors along pseudotime. c, Correlation of promoter methylation (left) and promoter accessibility (right) with gene expression across cells. Negative correlations (blue) indicate a repressive effect of methylation/accessibility; positive correlations (orange) indicate activation. n: number of nominally significant correlations (Pearson’s two-sided correlation test) after Benjamini-Hochberg adjustment; y axis: unadjusted p-values.
Extended Data Fig. 2
Extended Data Fig. 2. Adult neurogenesis involves a major and a minor wave of methylation change.
a, Correlation matrices of transcriptomes, methylomes and chromatin accessibility. Cells are ordered and binned according to pseudotime (based on triple-omic MOFA+ factors), with each bin containing 10 cells on average. b, Histogram of inferred pseudotime points where VMRs become methylated (red) or demethylated (blue). c, Expression and epigenetic state of genes which intersect a VMR that becomes demethylated at the late TAP stage (i.e., the “second wave of demethylation”, dashed orange box in b). Rows ordered by hierarchical clustering of gene expression values. Note their expression in neuroblasts. d, Expression and epigenetic status of genes expressed at different states of the NSC lineage. The top heatmap row indicates the average expression of 100 marker genes per cell state, identified in a differential expression analysis of the single-cell transcriptomes. Middle and bottom rows indicate the average DNA methylation (meth) and chromatin accessibility (acc) at the 100 promoters (p) of these markers, and at 100 VMRs (V) overlapping marker gene bodies. While gene expression of astrocyte markers fades gradually, the methylation of nearby VMRs is clearly distinct between vSVZ astrocytes and qNSC2. The promoters of TAP markers (cell cycle genes) are demethylated and accessible in all cell states. Oligodendrocyte marker expression coincides with low methylation and increased accessibility of both promoters and VMRs. Markers for intermediate cell states show weaker, more ambiguous epigenetic patterns. e-f, Motif enrichment of VMRs with low methylation in oligodendrocytes. e, Scatterplot of TFs, showing the TF motif’s unadjusted one-sided enrichment p-values reported by HOMER on the y axis, and the TF mean gene expression in the respective cell population on the x axis. Human TFs are fully capitalized, the remainder are mouse TFs. f, PCA of single-cell methylomes. PC1 and PC2 separate oligodendrocytes and astrocytes, respectively, from the other cells, and informed the regions for motif enrichment in e and Fig. 2b.
Extended Data Fig. 3
Extended Data Fig. 3. Detailed view of astrocyte LMRs, NSC LMRs and expression of intersecting genes.
a-b, Heatmaps of LMR methylation (left) and expression of intersecting genes (right) in pseudotime. a, All significant LMRs which intersect a gene. b, Labeled LMRs from Fig. 3a. Note that some genes intersect multiple LMRs. Rows are ordered by hierarchical clustering of gene expression values. Cells are separated by tissue and then binned in pseudotime. c, Detailed view of DNA methylation near Slc1a2 in pseudobulk samples of each cell state. Each CpG is represented by a colored vertical line representing its average methylation value in the pseudobulk sample. Short black lines denote the position of CpGs with sequencing coverage. Colored purple/red bars denote LMRs. d-e, Log-normalized expression of Slc1a2 and mean methylation of LMRs intersecting this gene. f-h, Same visualization for Efnb2. For expression and methylation of additional NSC / astrocyte markers, see Supplementary Figs. 4–6. i-j, Chromatin accessibility of naive wild-type cells. i, Average promoter (TSS ± 1 kb) accessibility of genes up- or downregulated in the NSC lineage. To minimize the impact of outliers on the color scale, the 1% (methylation) or 5% (accessibility) highest and lowest values are clipped. j, Mean chromatin accessibility of astrocyte LMRs and NSC LMRs, as well as the difference between these two means (bottom, analogous to the methylome score).
Extended Data Fig. 4
Extended Data Fig. 4. Cell sorting demonstrates that cells captured from the striatum did not migrate from the vSVZ.
a, Representative confocal images of the SVZ and striatum from a naive and a post-ischemic (2 dpi) mouse brain stained with TUNEL (terminal deoxynucleotidyl transferase-dUTP nick end labeling; labels apoptotic cells). Brain slides are counterstained with DAPI (blue). TUNEL+ nuclei (segmented with Cellpose) are shown in white. Scale bar: 100 µm. Bottom right: Quantification of TUNEL+ cells in the vSVZ and striatum of n = 5 mice depicted with 5 shapes (solid shapes: ischemic mice; outlined triangle: naive control; outlined square: sham-operated control; one-sided paired t test). b-c, FACS Strategy for sorting GLAST + cells from the vSVZ (b) and striatum (c). Striatal GLAST + cells correspond to astrocytes, while vSVZ GLAST + cells correspond to NSCs / vSVZ astrocytes. Dead cells and CD45/O4/Ter119 positive cells were excluded. d-e, The YFP intensity of GLAST + cells was captured by index sorting. Dot plots show the fraction of YFP+ cells from the GLAST + population, being higher in the vSVZ sample 2 dpi. Antigen names are written on each axis, followed by the filter used to measure the signal. FACS: Fluorescence-activated cell sorting. SSC-A: Side scatter area. FSC-A: forward scatter area. FSC-H: forward scatter height. RL-780/60-A: APC-Cy7 fluorochrome. VL-450/50-A: Pacific blue fluorochrome. RL-670/14-A: APC fluorochrome. YG-586/15-A: PE fluorochrome. f, FACS quantification of cells of the naive and post-ischemic vSVZ and striatum (n = 3 individual mice per condition). Shown is the percentage of YFP+ (TLX reporter) cells among astrocytes and NSC lineage cells after TAM injection. g-h, Neurosphere assay of cells isolated from the naive and post-ischemic vSVZ and striatum (n = 3 individual mice), quantified in h. Welch’s two-sided t-test. i-j, Immunofluorescence staining of DCX in the naive and post-ischemic vSVZ and striatum of TiCY mice, showing absence of YFP+DCX+ cells in the striatum. Arrows: YFP+DCX+ neuroblasts in the vSVZ; arrowheads: YFP-DCX+ neuroblasts in the striatum. j, Quantification of DCX+ cells in the striata of n = 6 individual mice (points). No YFP+DCX+ cells were observed. Bars and error bars in panels a, f, h, j represent mean and standard error.
Extended Data Fig. 5
Extended Data Fig. 5. Methylation and chromatin accessibility of astrocyte LMRs and NSC LMRs.
a-b, Average methylation of astrocyte LMRs (a), and NSC LMRs (b) from Fig. 3. The methylome score introduced in Fig. 4b is the difference between these two averages.
Extended Data Fig. 6
Extended Data Fig. 6. Expression of reactive astrocyte marker genes.
a-c, Mean log-normalized expression of reactive astrocyte marker genes from. These markers include putative pan reactive marker genes (a) and markers observed in two astrocyte subtypes (b: A1 reactive astrocytes, c: A2 reactive astrocytes). d, Heatmap of reactive astrocyte marker gene expression in the naive and post-ischemic striatum.
Extended Data Fig. 7
Extended Data Fig. 7. Expression of LPS-induced genes reported by Hasel et al..
a, Mean log-normalized expression of genes consistently induced by LPS-injection (from). b, Heatmap of LPS-induced genes that were only observed in one of 10 astrocyte sub-types (top) or the consistent genes from a (bottom). LPS: lipopolysaccharide.
Extended Data Fig. 8
Extended Data Fig. 8. scNMT-seq of post-ischemic mice lacking interferon receptors and DMRs detected after ischemia.
a, Volcano plot of DMRs detected in wild-type mice 2 dpi. Inset: NSC-lineage cells 2 dpi (blue) were tested against naive (red). y axis: unadjusted two-sided p-value obtained with ‘methscan diff’; red: Benjamini-Hochberg adjusted p < 0.05). b, Heatmap of DMR methylation at three timepoints and in post-ischemic IFNAGRKO. c-d, Volcano plot and heatmap of DMRs detected in wild-type mice 21 dpi (statistics as in a). e, Mean methylation of the top DMR from c, which overlaps Dnmt3a. Cells with no sequencing coverage at this DMR are gray. f, Bee swarm plot of data from e. Points: single cells, large point: median. g-h, GLAST+ cells isolated from the IFNAGRKO vSVZ (g) or striatum (h) 2 dpi, depicted as in Fig. 4b,c. For comparison, the inset depicts GLAST+ cells from wild-type 2 dpi. The naive IFNAGRKO control is shown in Extended Data Fig. 6a. Source Data

References

    1. Sohn, J. et al. The subventricular zone continues to generate corpus callosum and rostral migratory stream astroglia in normal adult mice. J. Neurosci.35, 3756–3763 (2015). - PMC - PubMed
    1. Lim, D. A. & Alvarez-Buylla, A. The adult ventricular–subventricular zone (V-SVZ) and olfactory bulb (OB) neurogenesis. Cold Spring Harb. Perspect. Biol.8, a018820 (2016). - PMC - PubMed
    1. Delgado, A. C. et al. Release of stem cells from quiescence reveals gliogenic domains in the adult mouse brain. Science372, 1205–1209 (2021). - PubMed
    1. Cebrian-Silla, A. et al. Single-cell analysis of the ventricular-subventricular zone reveals signatures of dorsal and ventral adult neurogenesis. eLife10, e67436 (2021). - PMC - PubMed
    1. Llorens-Bobadilla, E. et al. Single-cell transcriptomics reveals a population of dormant neural stem cells that become activated upon brain injury. Cell Stem Cell17, 329–340 (2015). - PubMed

MeSH terms