. 2024 Oct;634(8032):228-233.
doi: 10.1038/s41586-024-07901-3. Epub 2024 Sep 4.

Farmed fur animals harbour viruses with zoonotic spillover potential

Affiliations

Farmed fur animals harbour viruses with zoonotic spillover potential

Jin Zhao et al. Nature. 2024 Oct.

Abstract

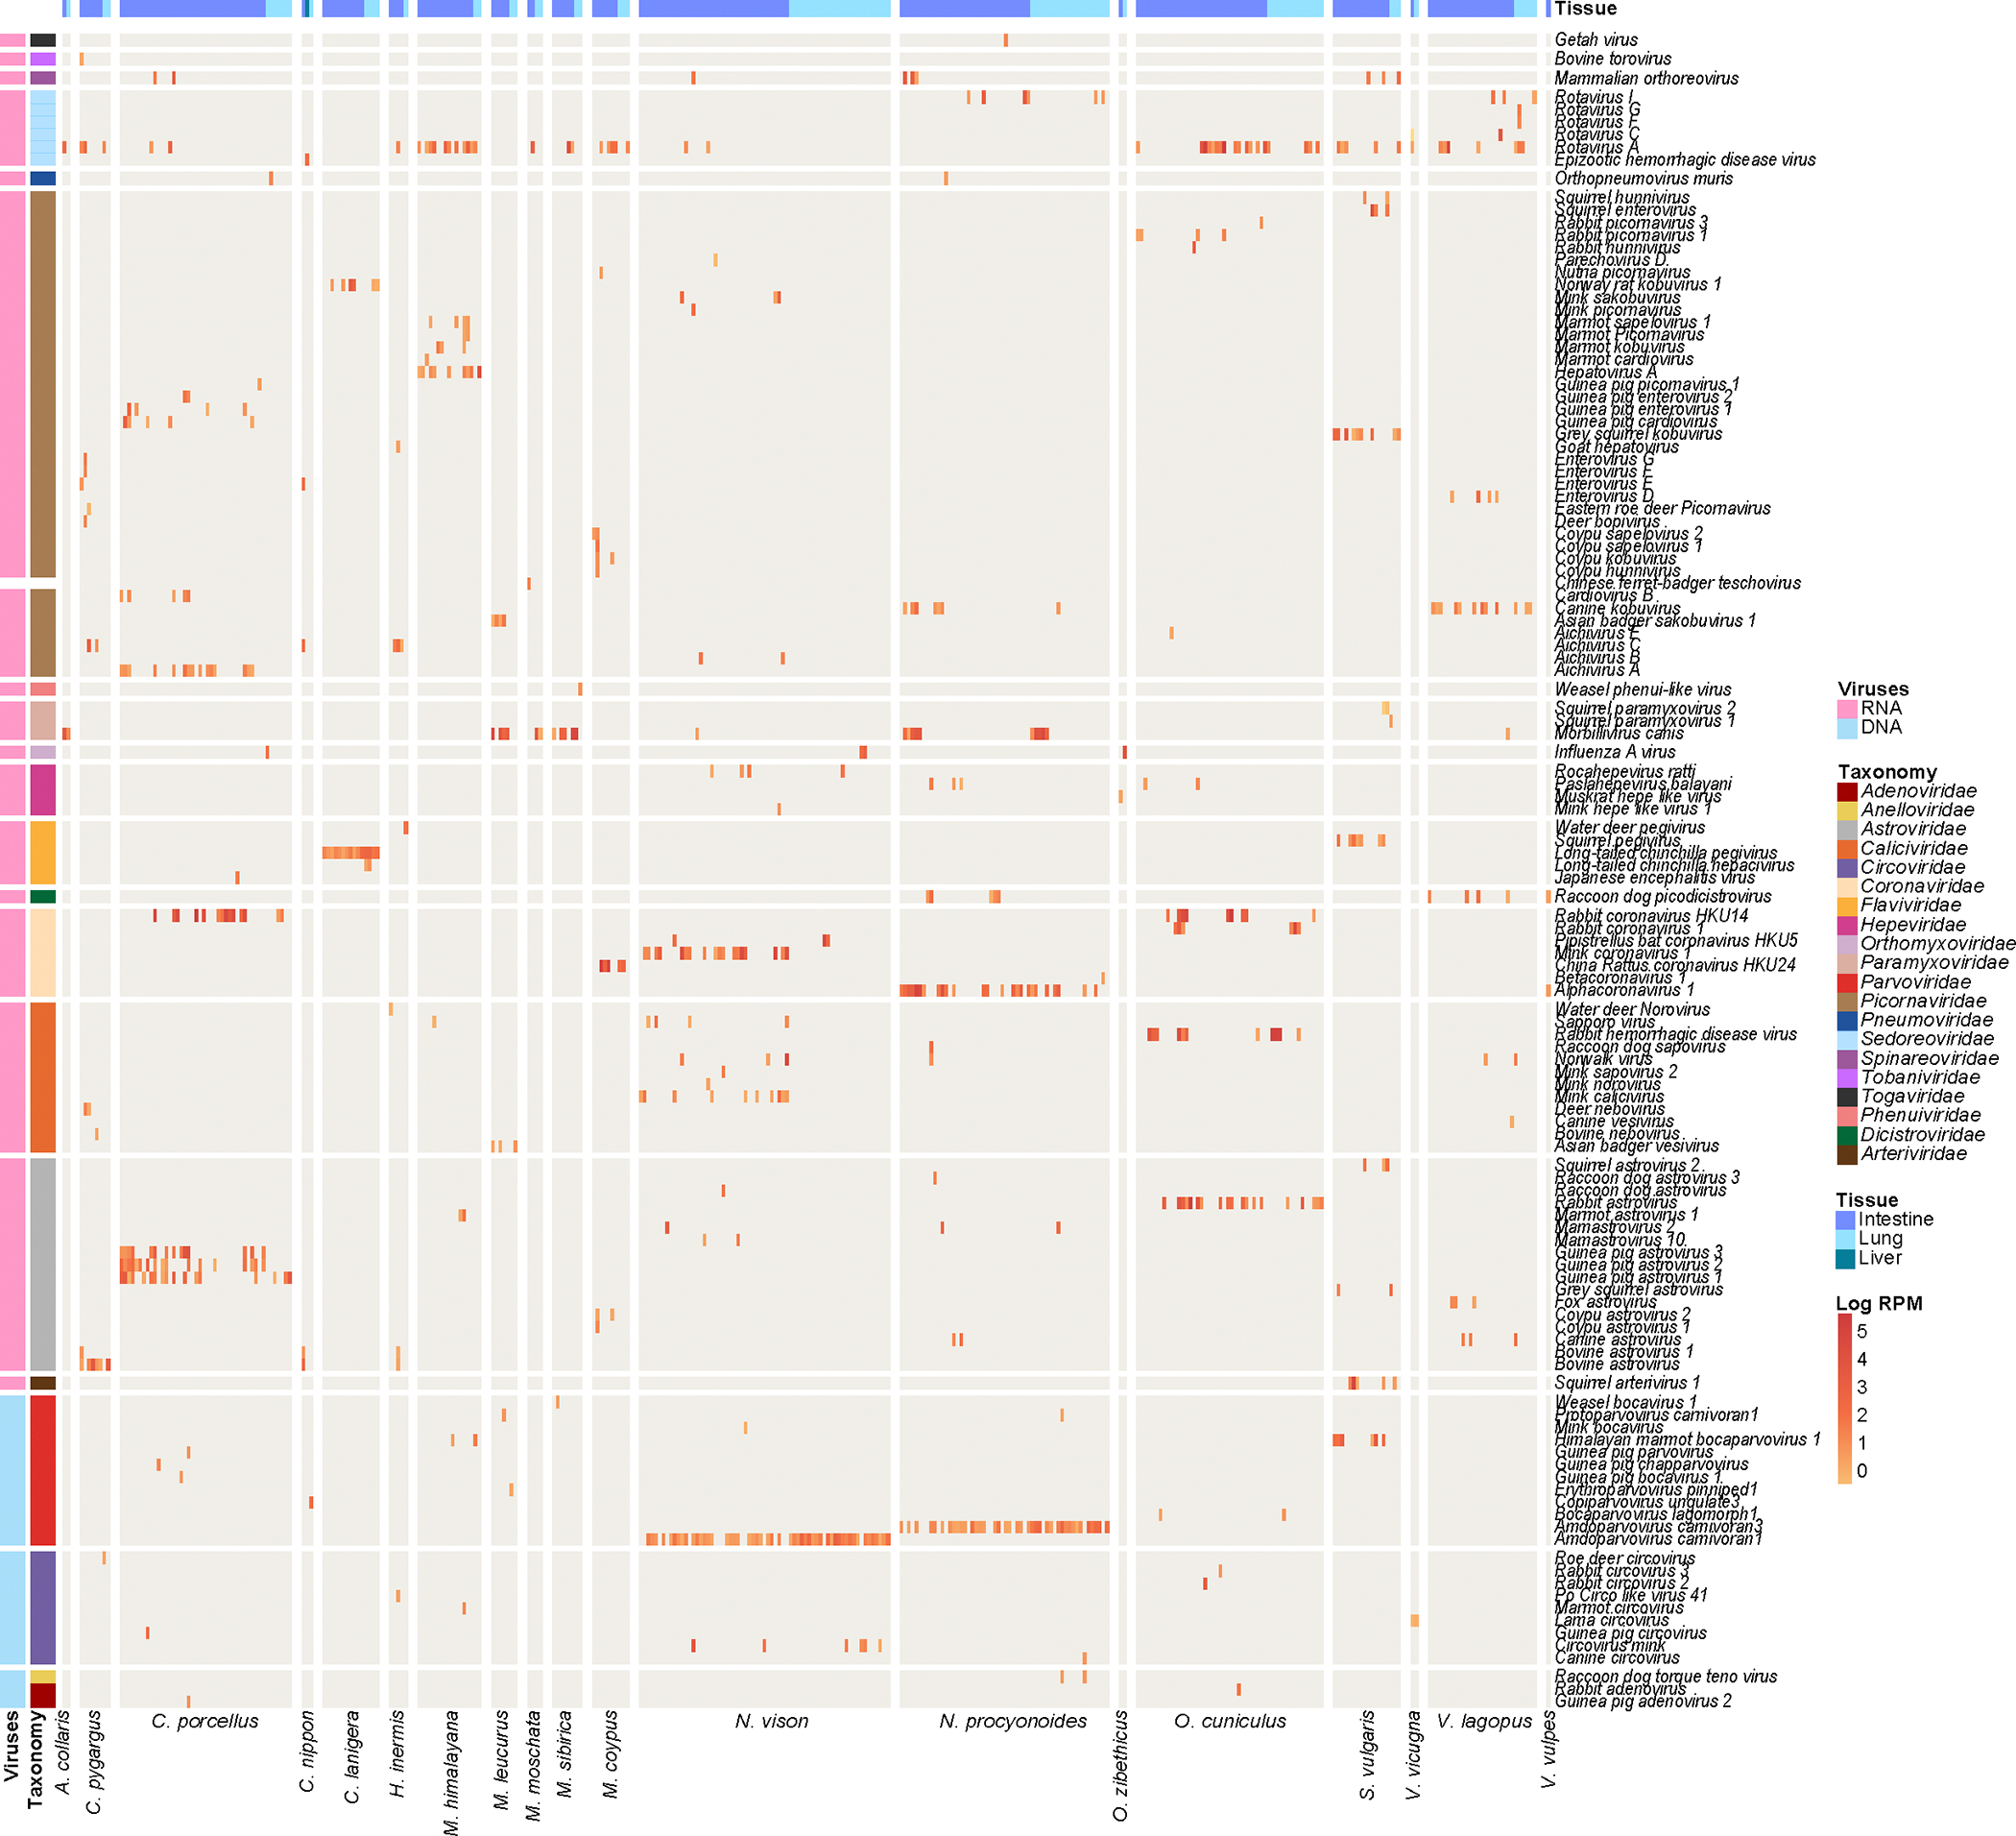
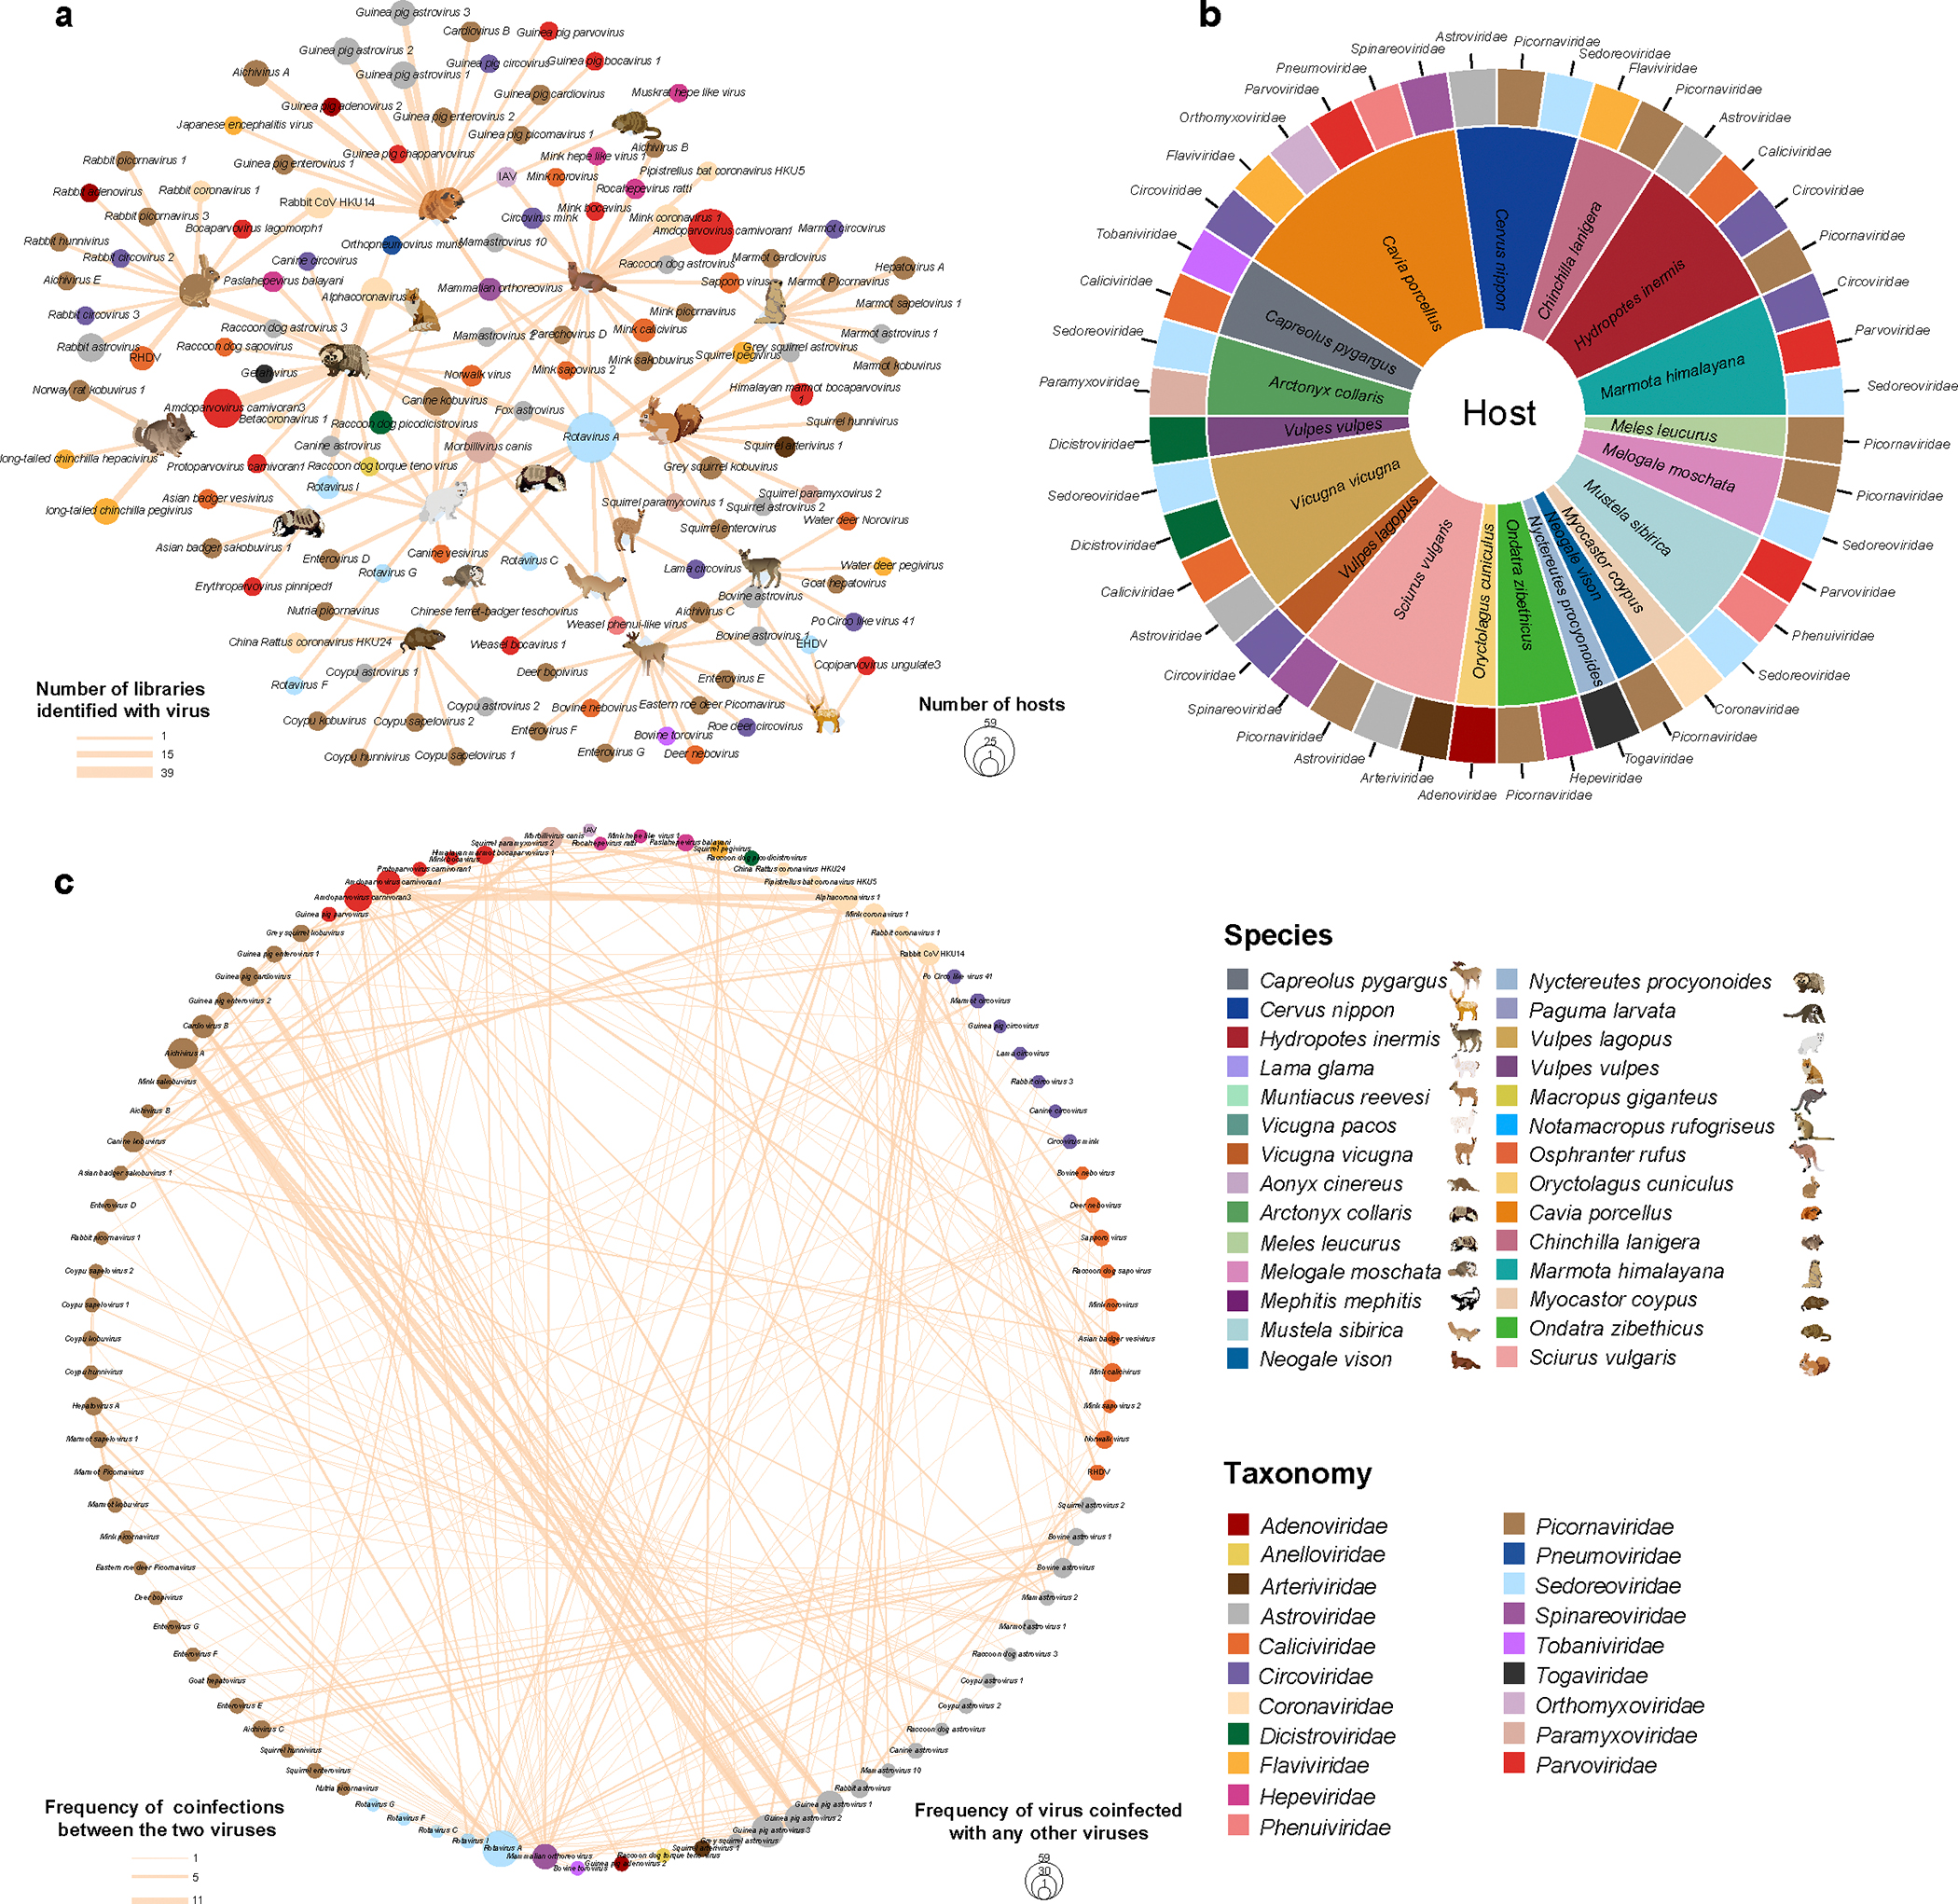
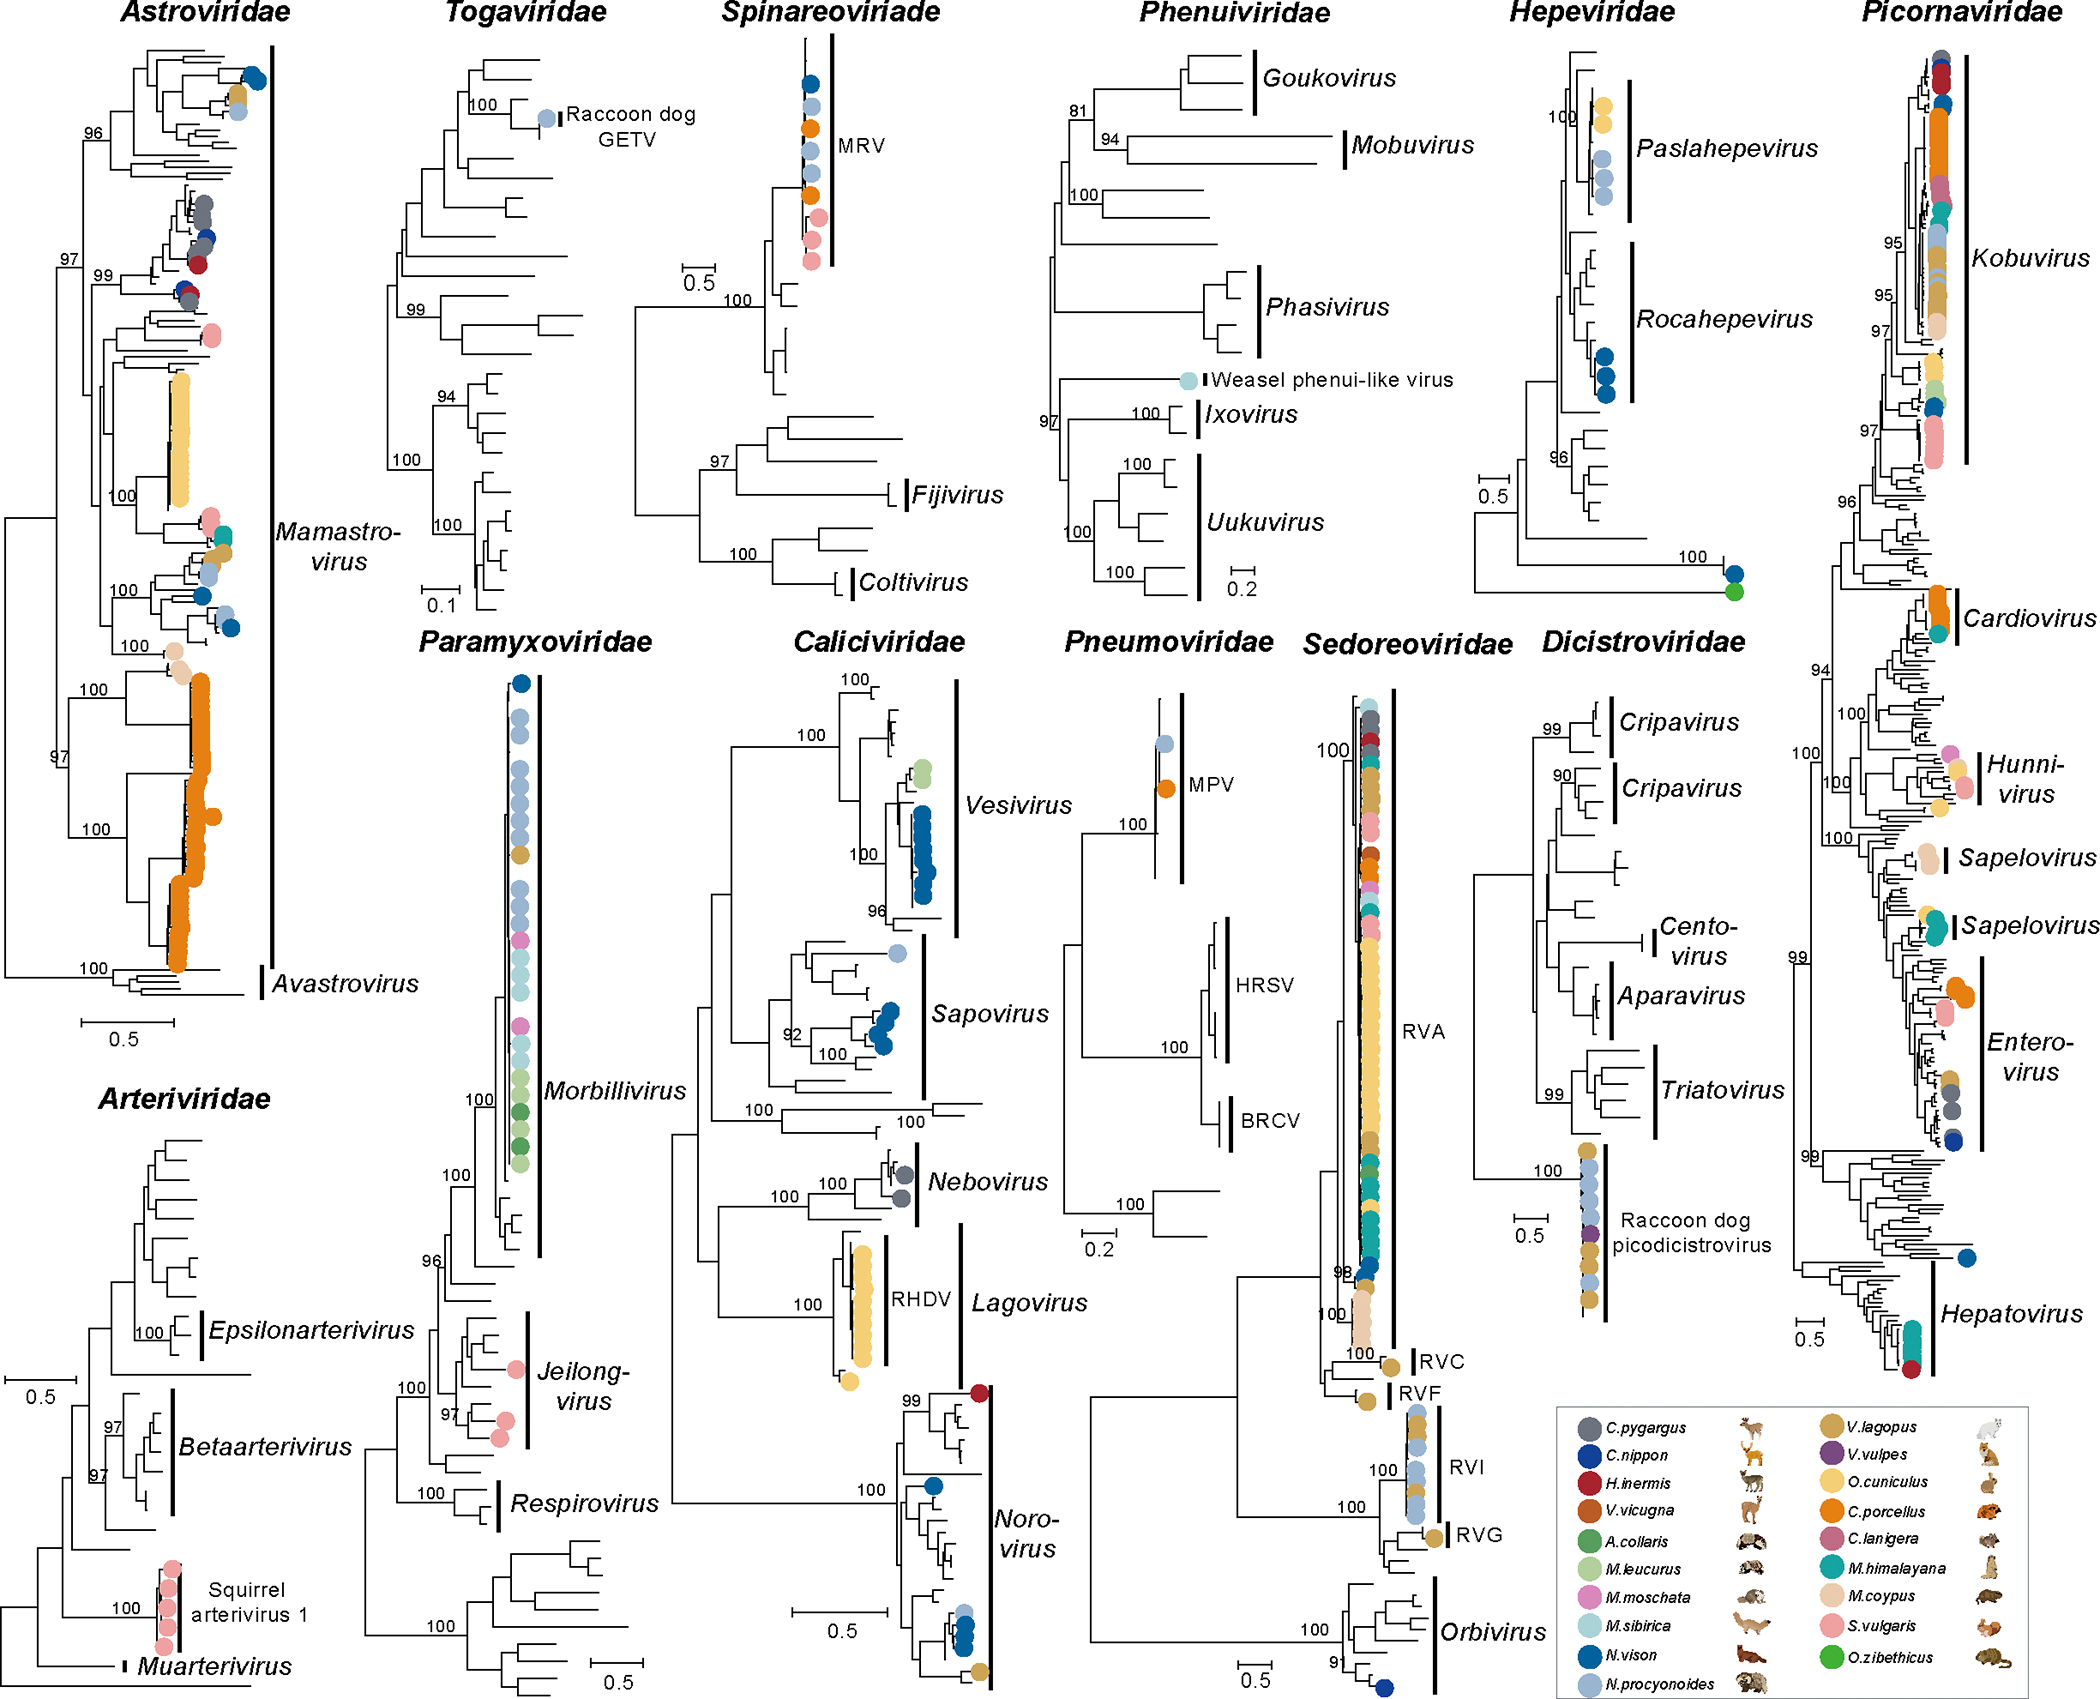
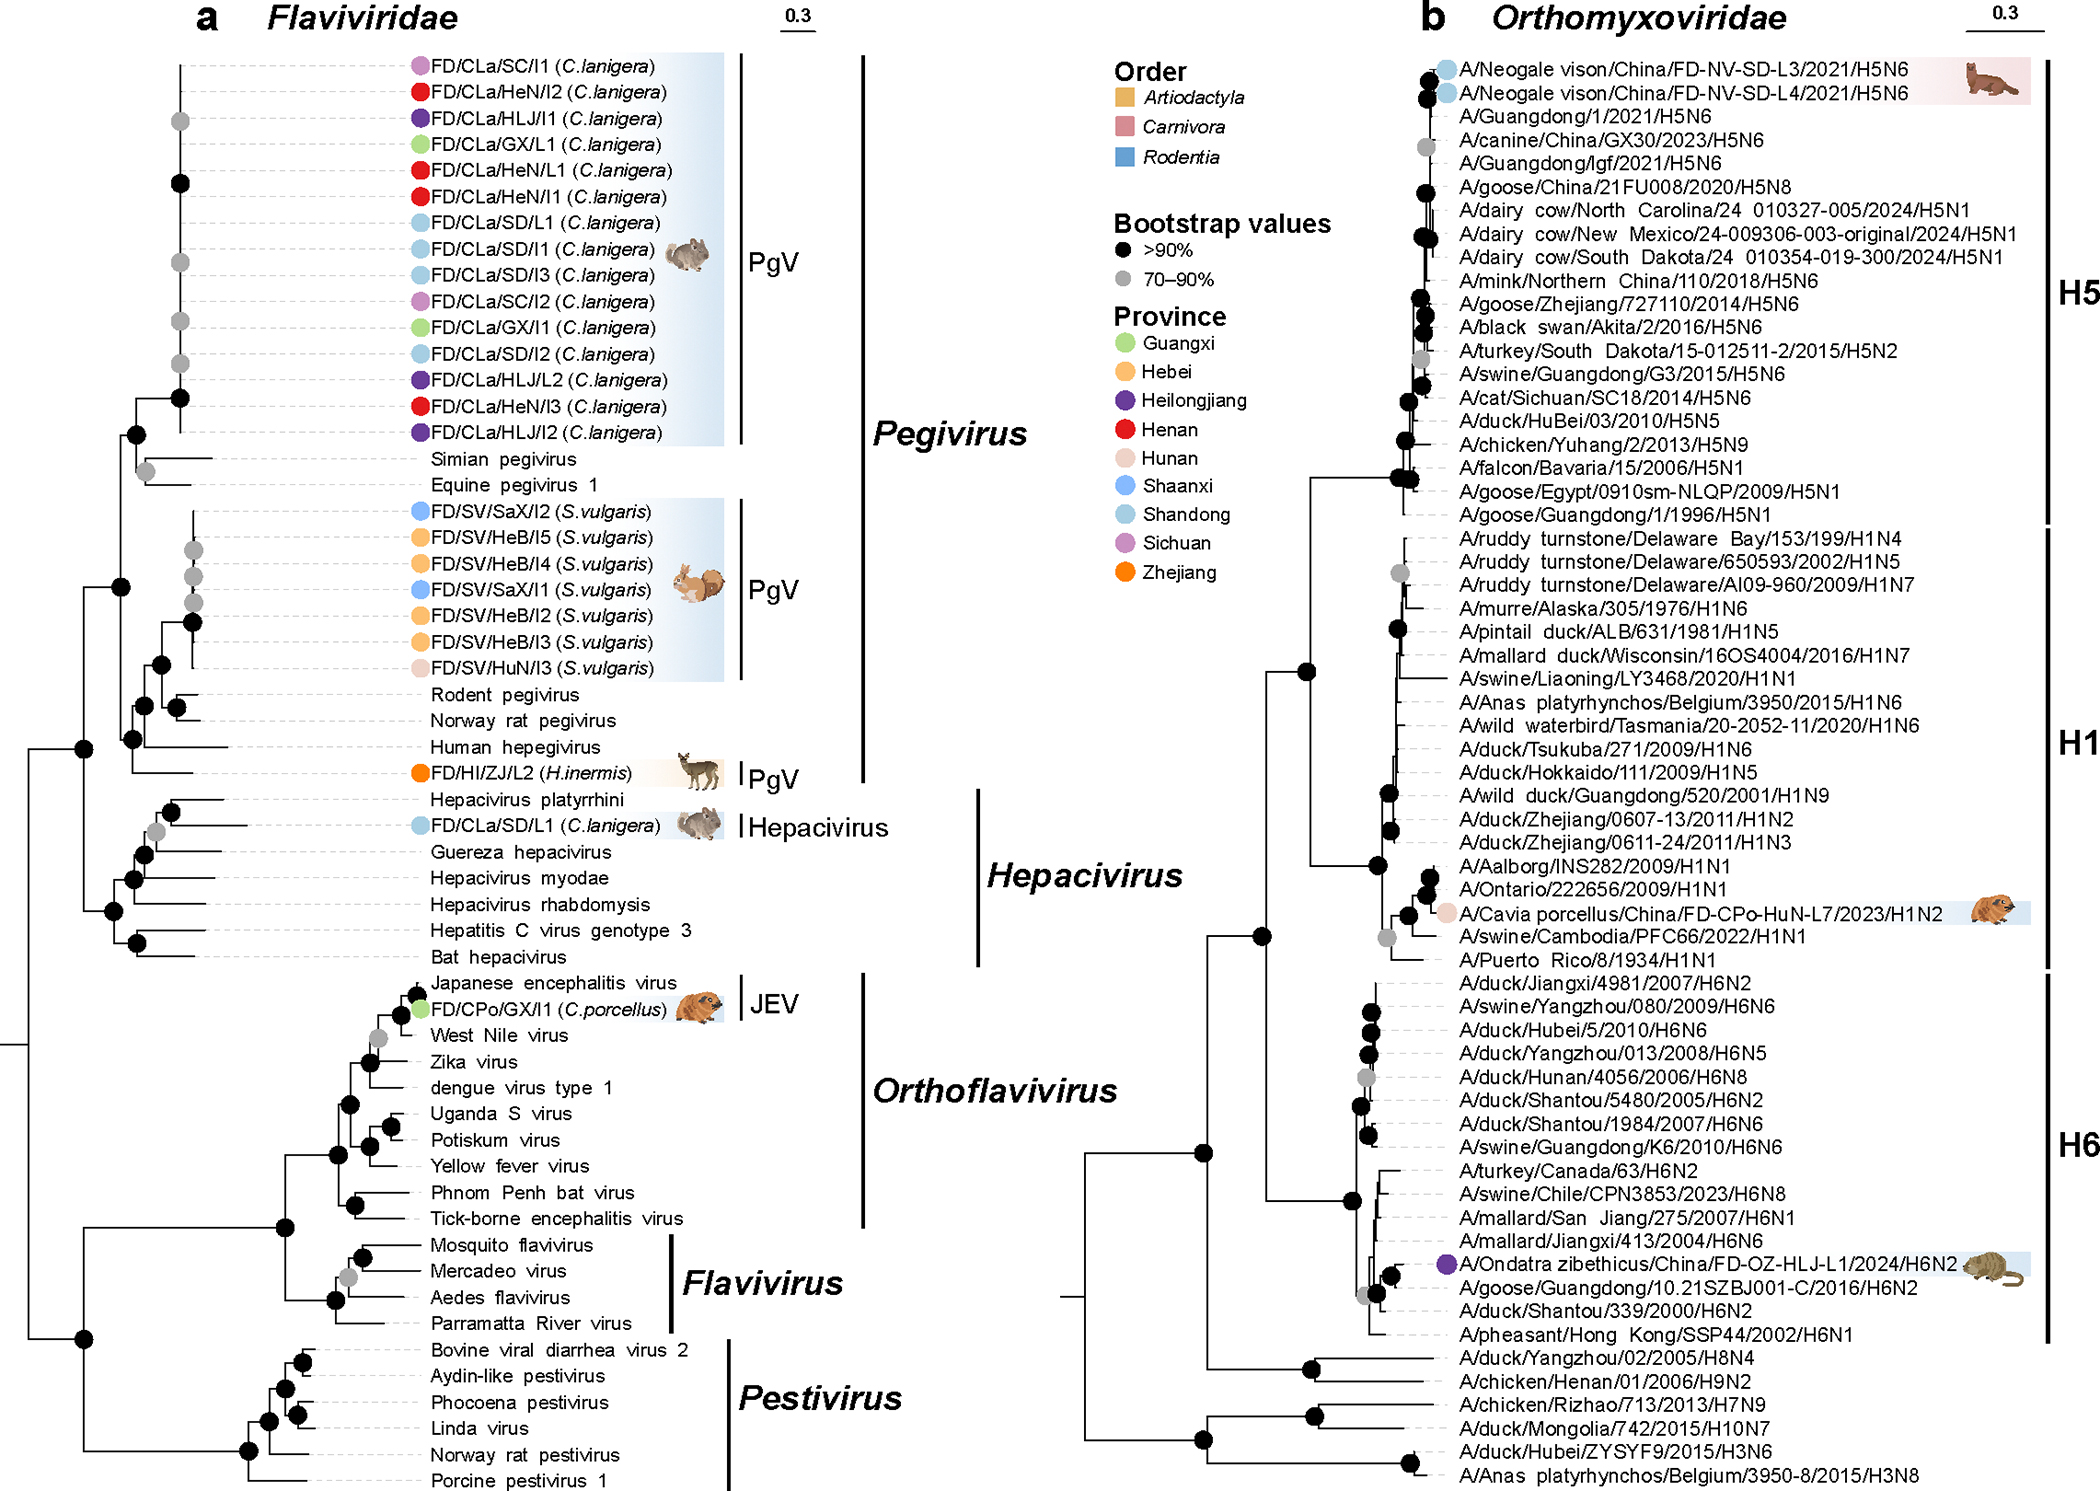
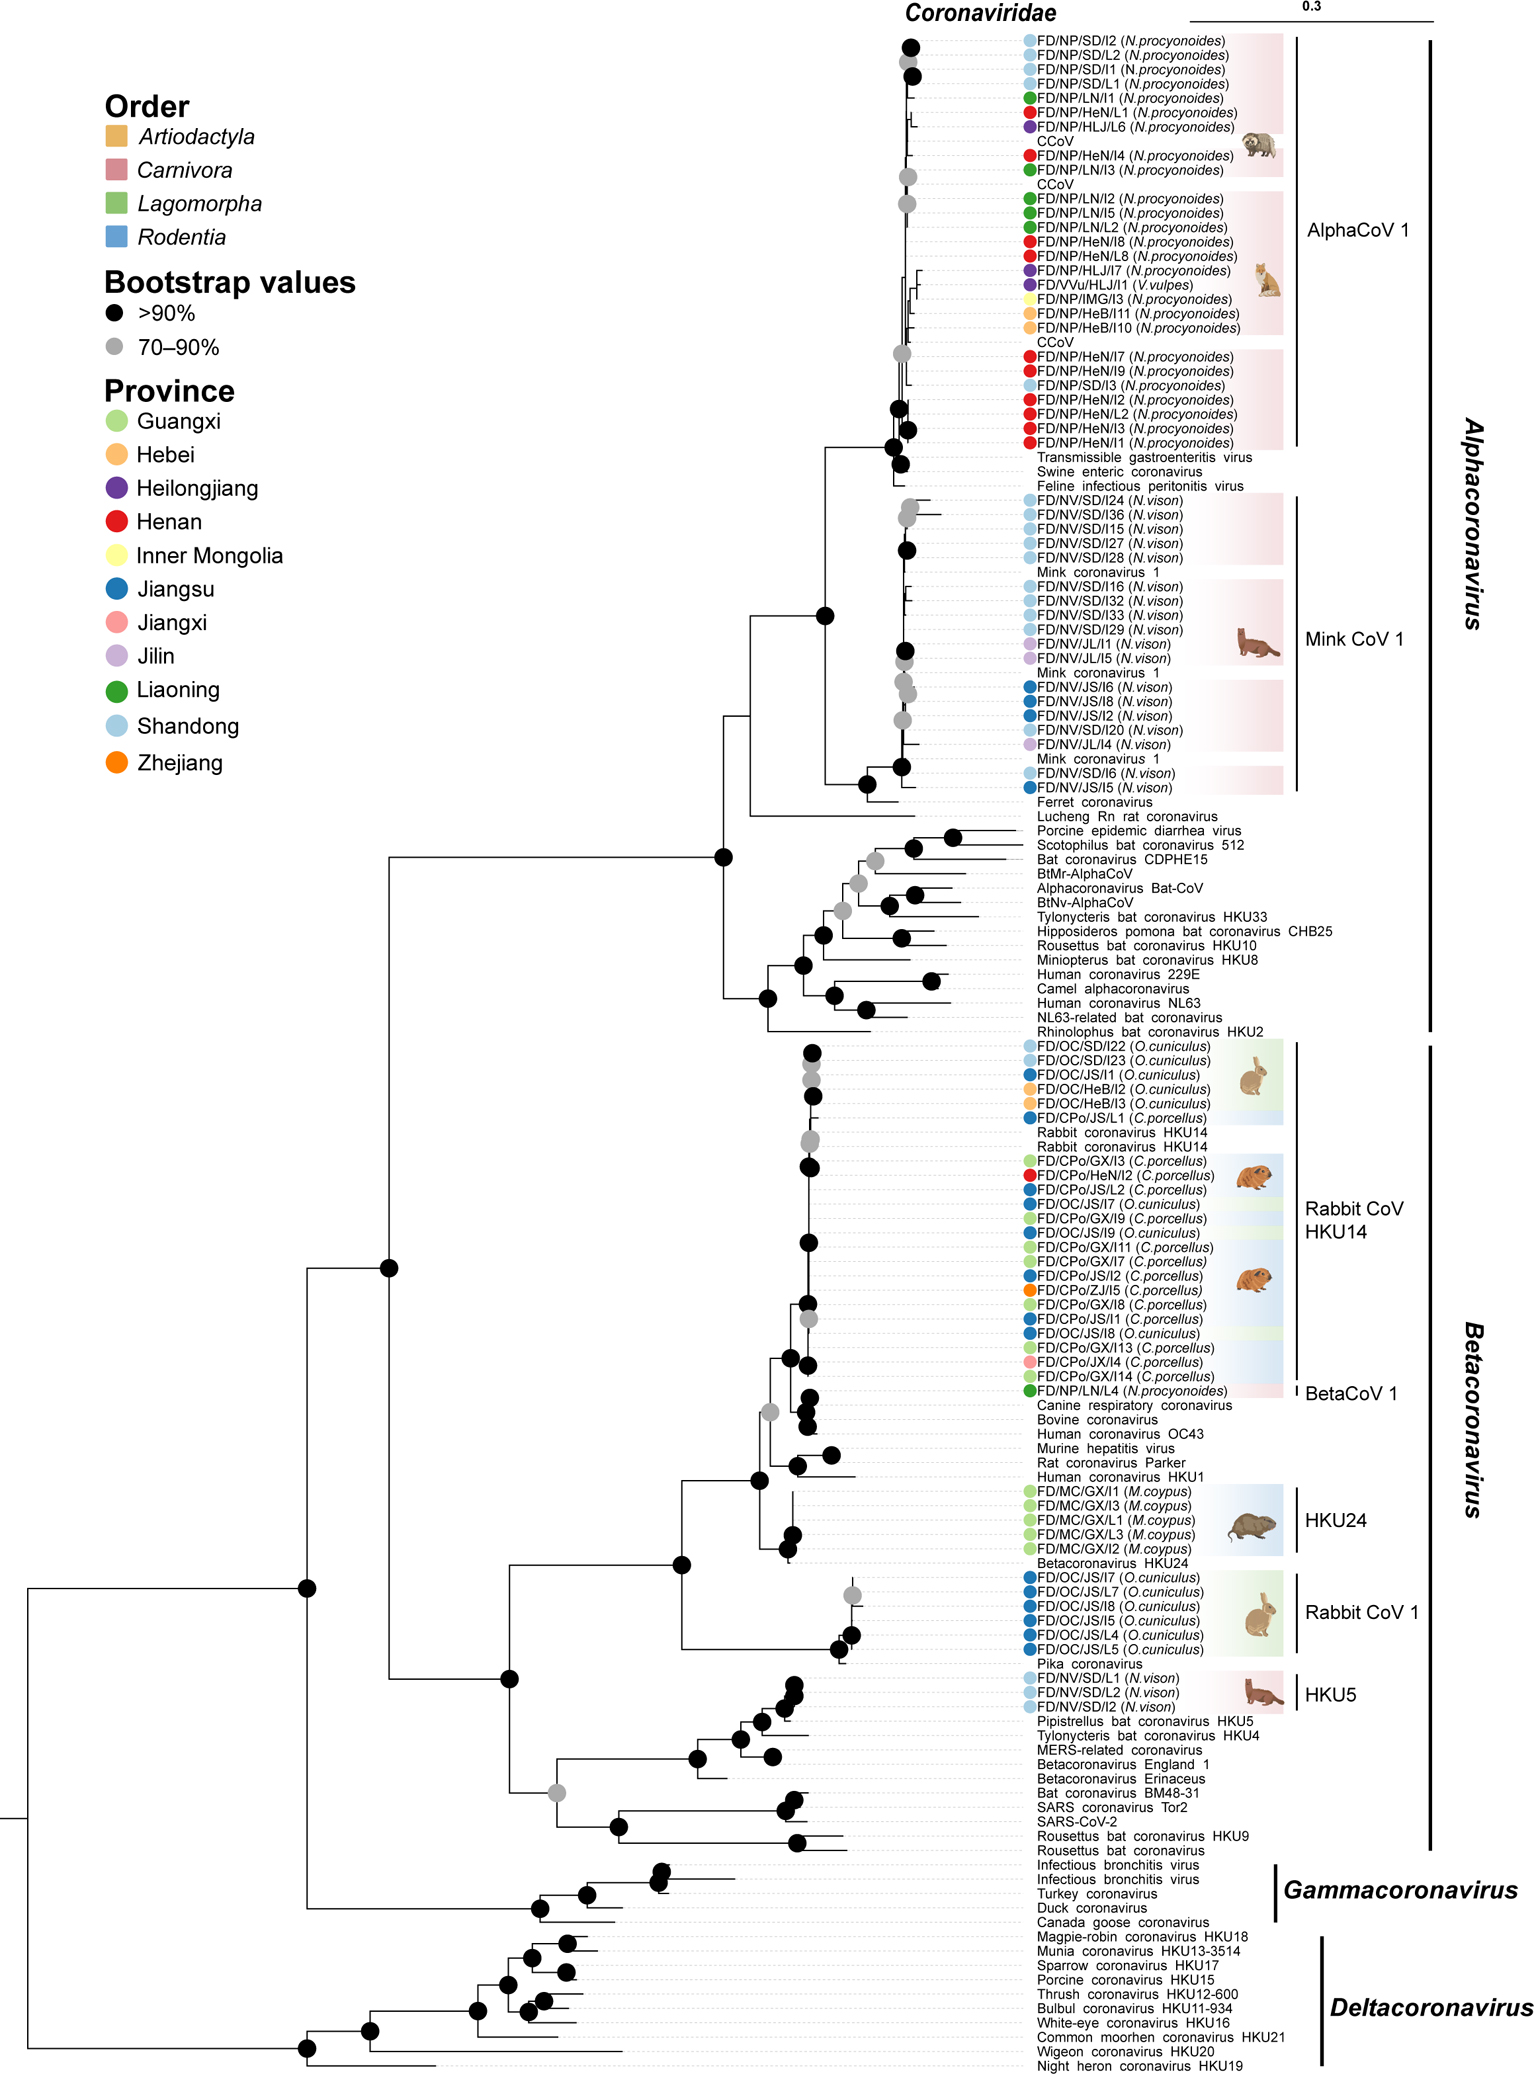
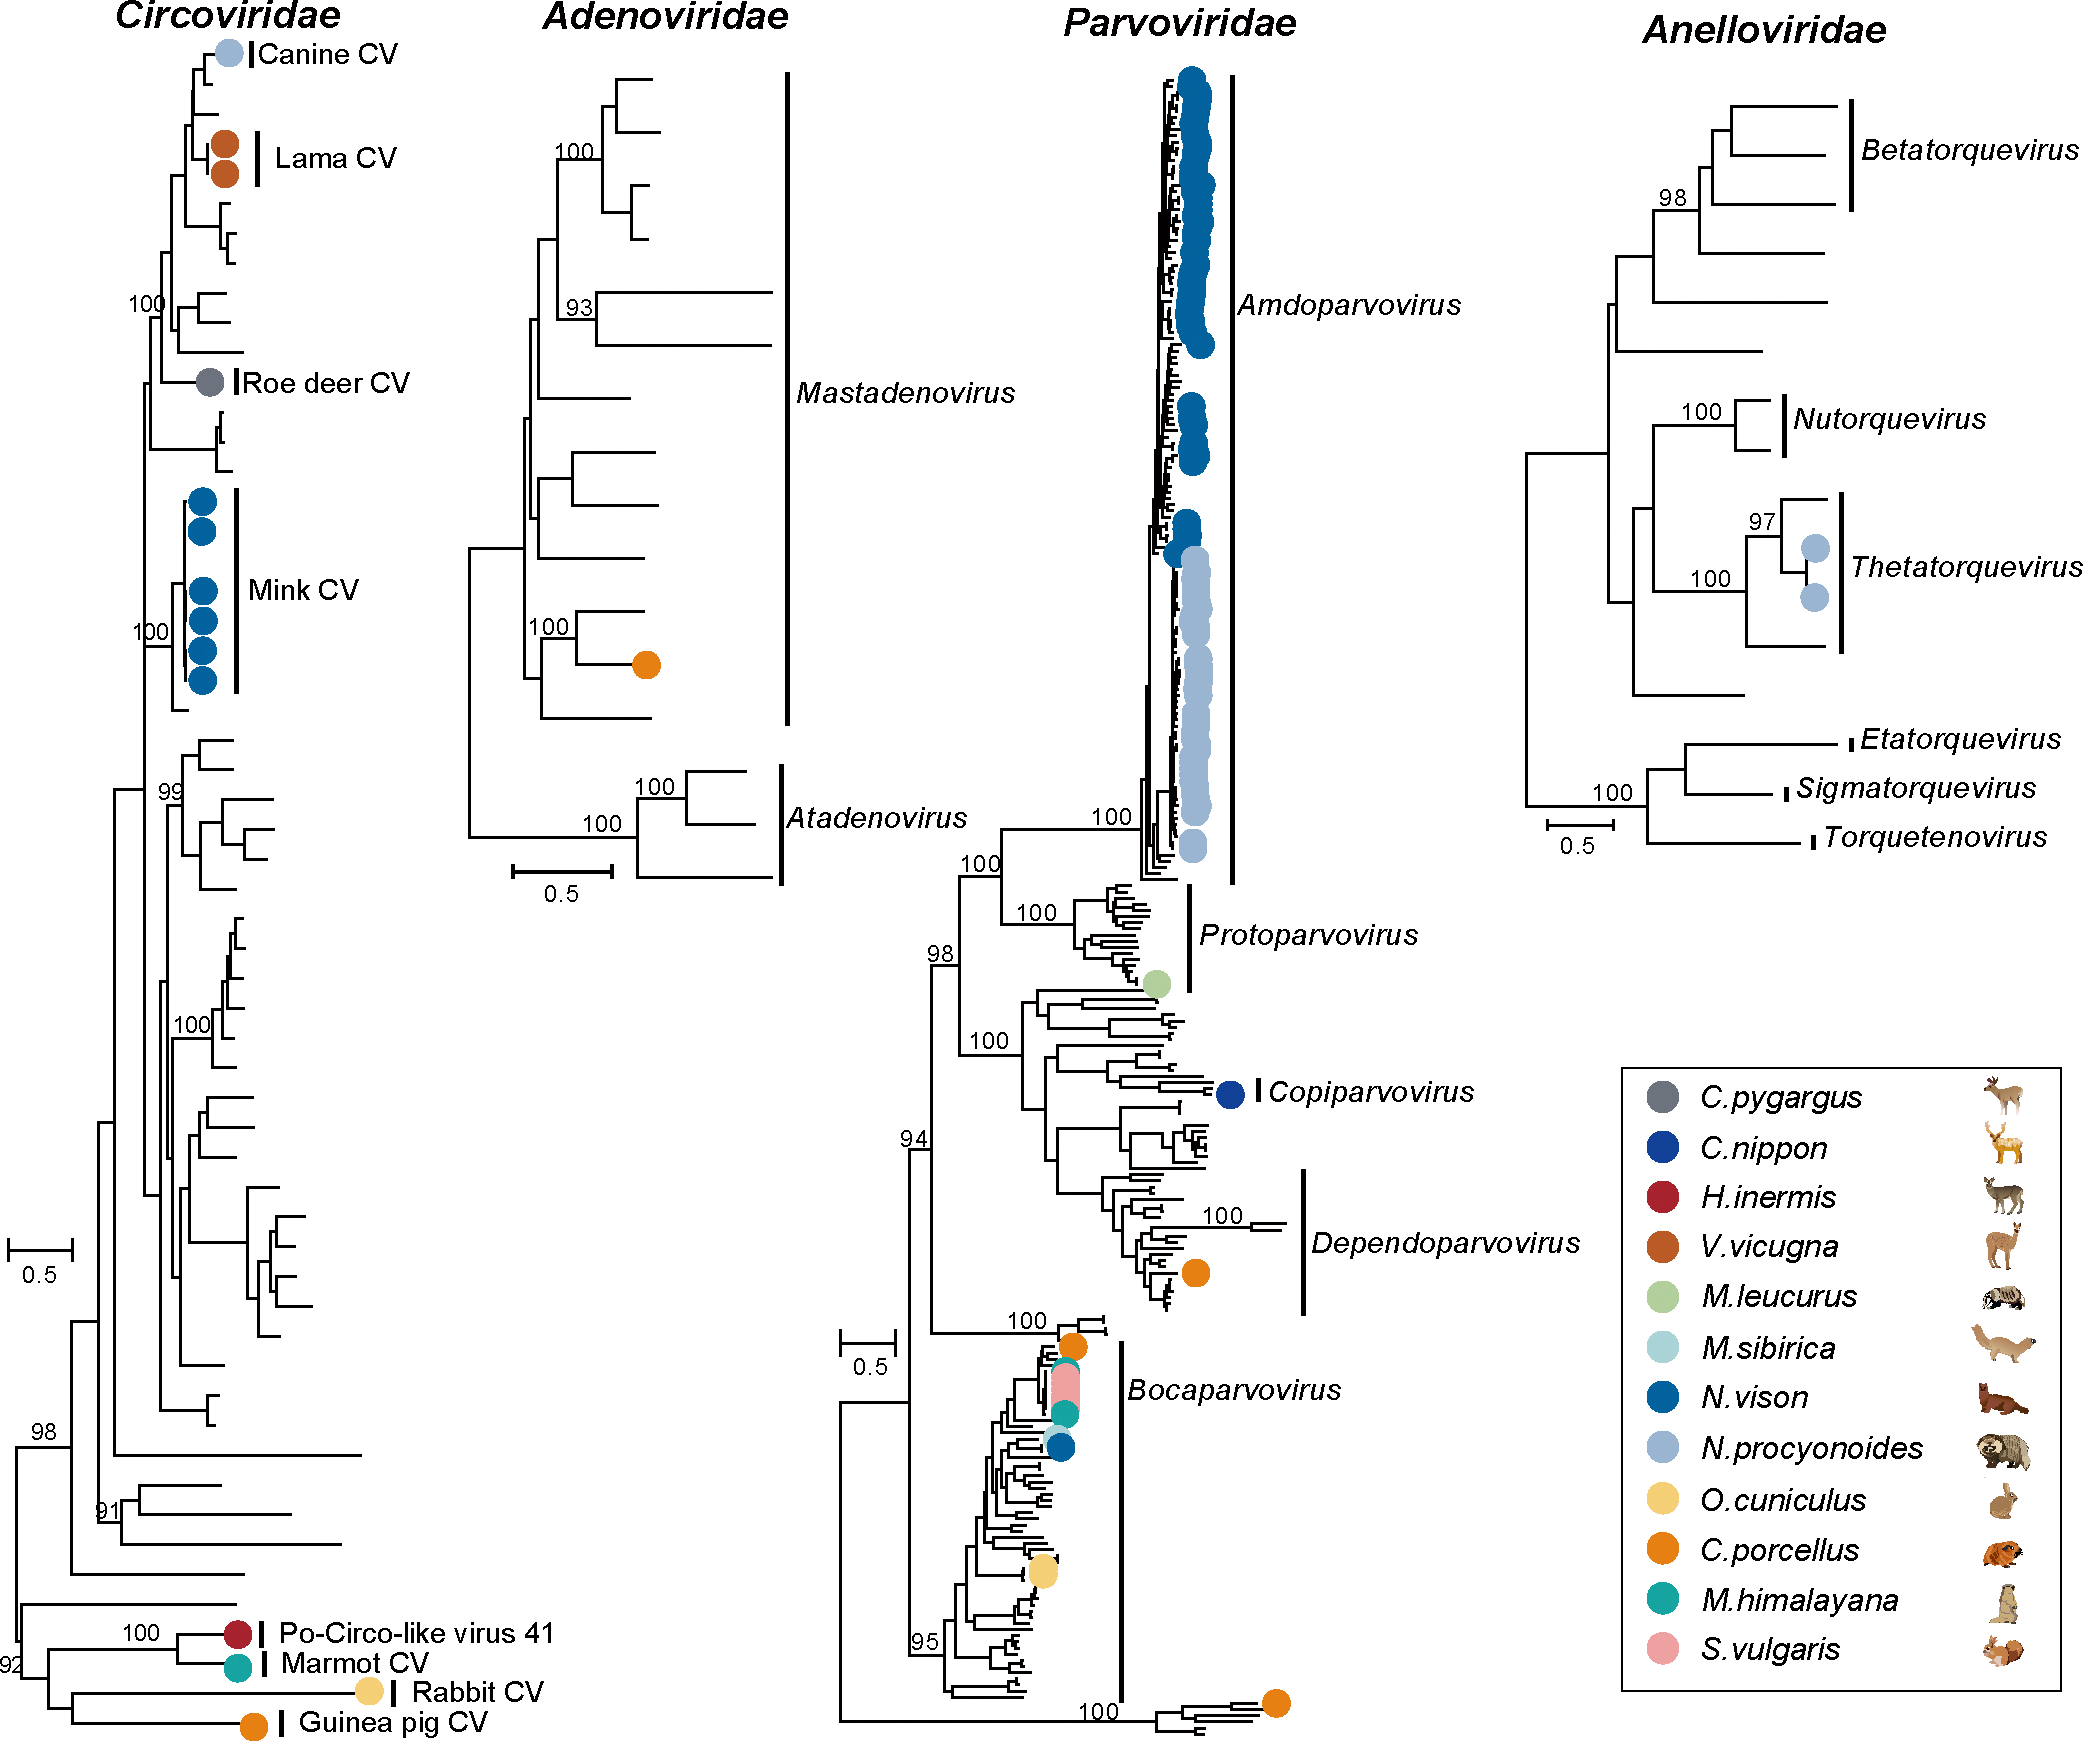
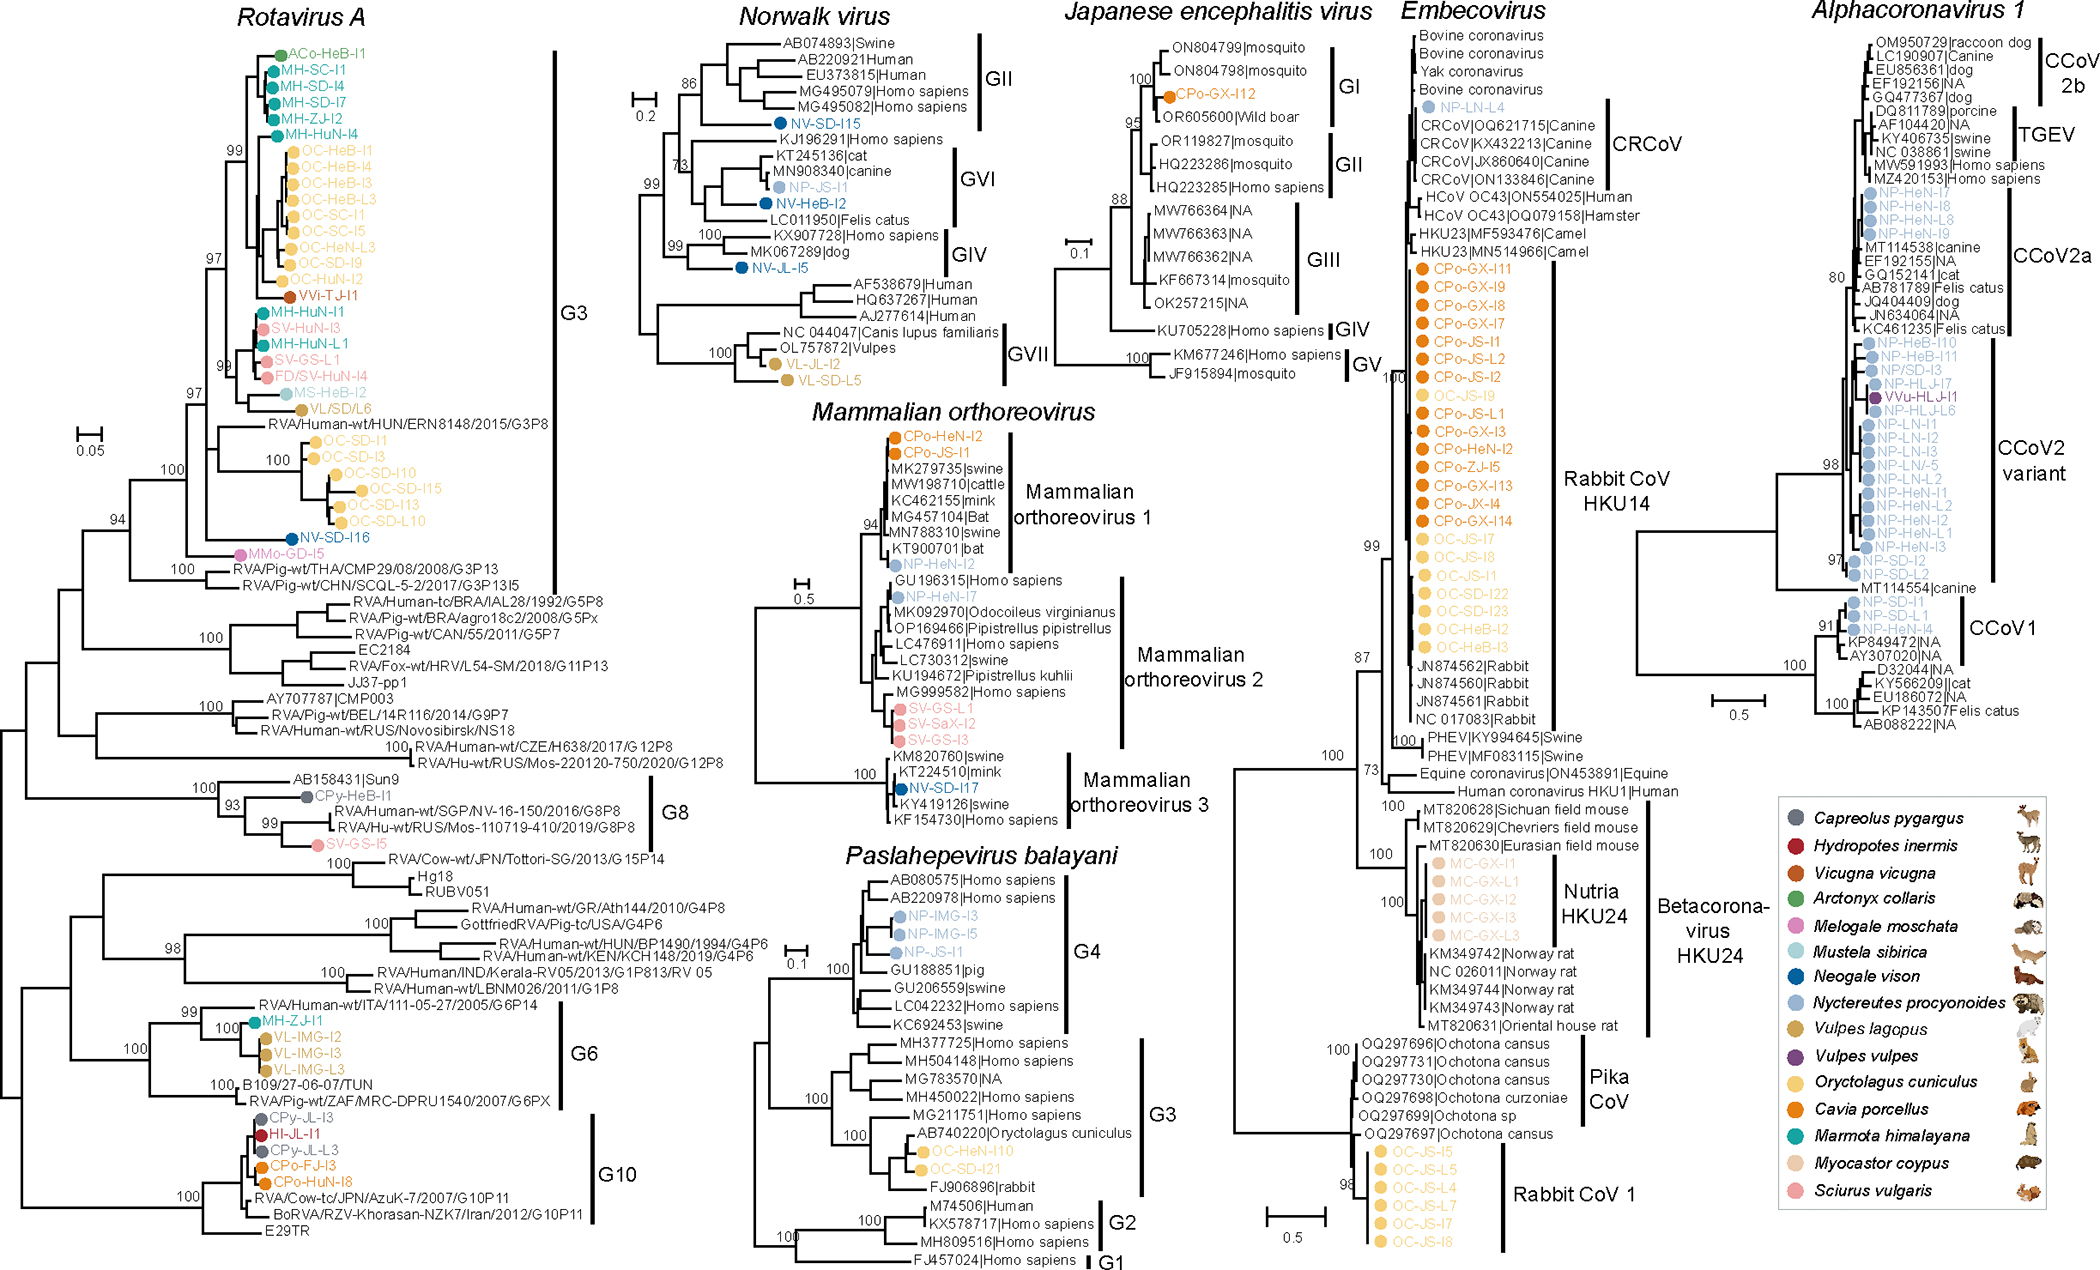
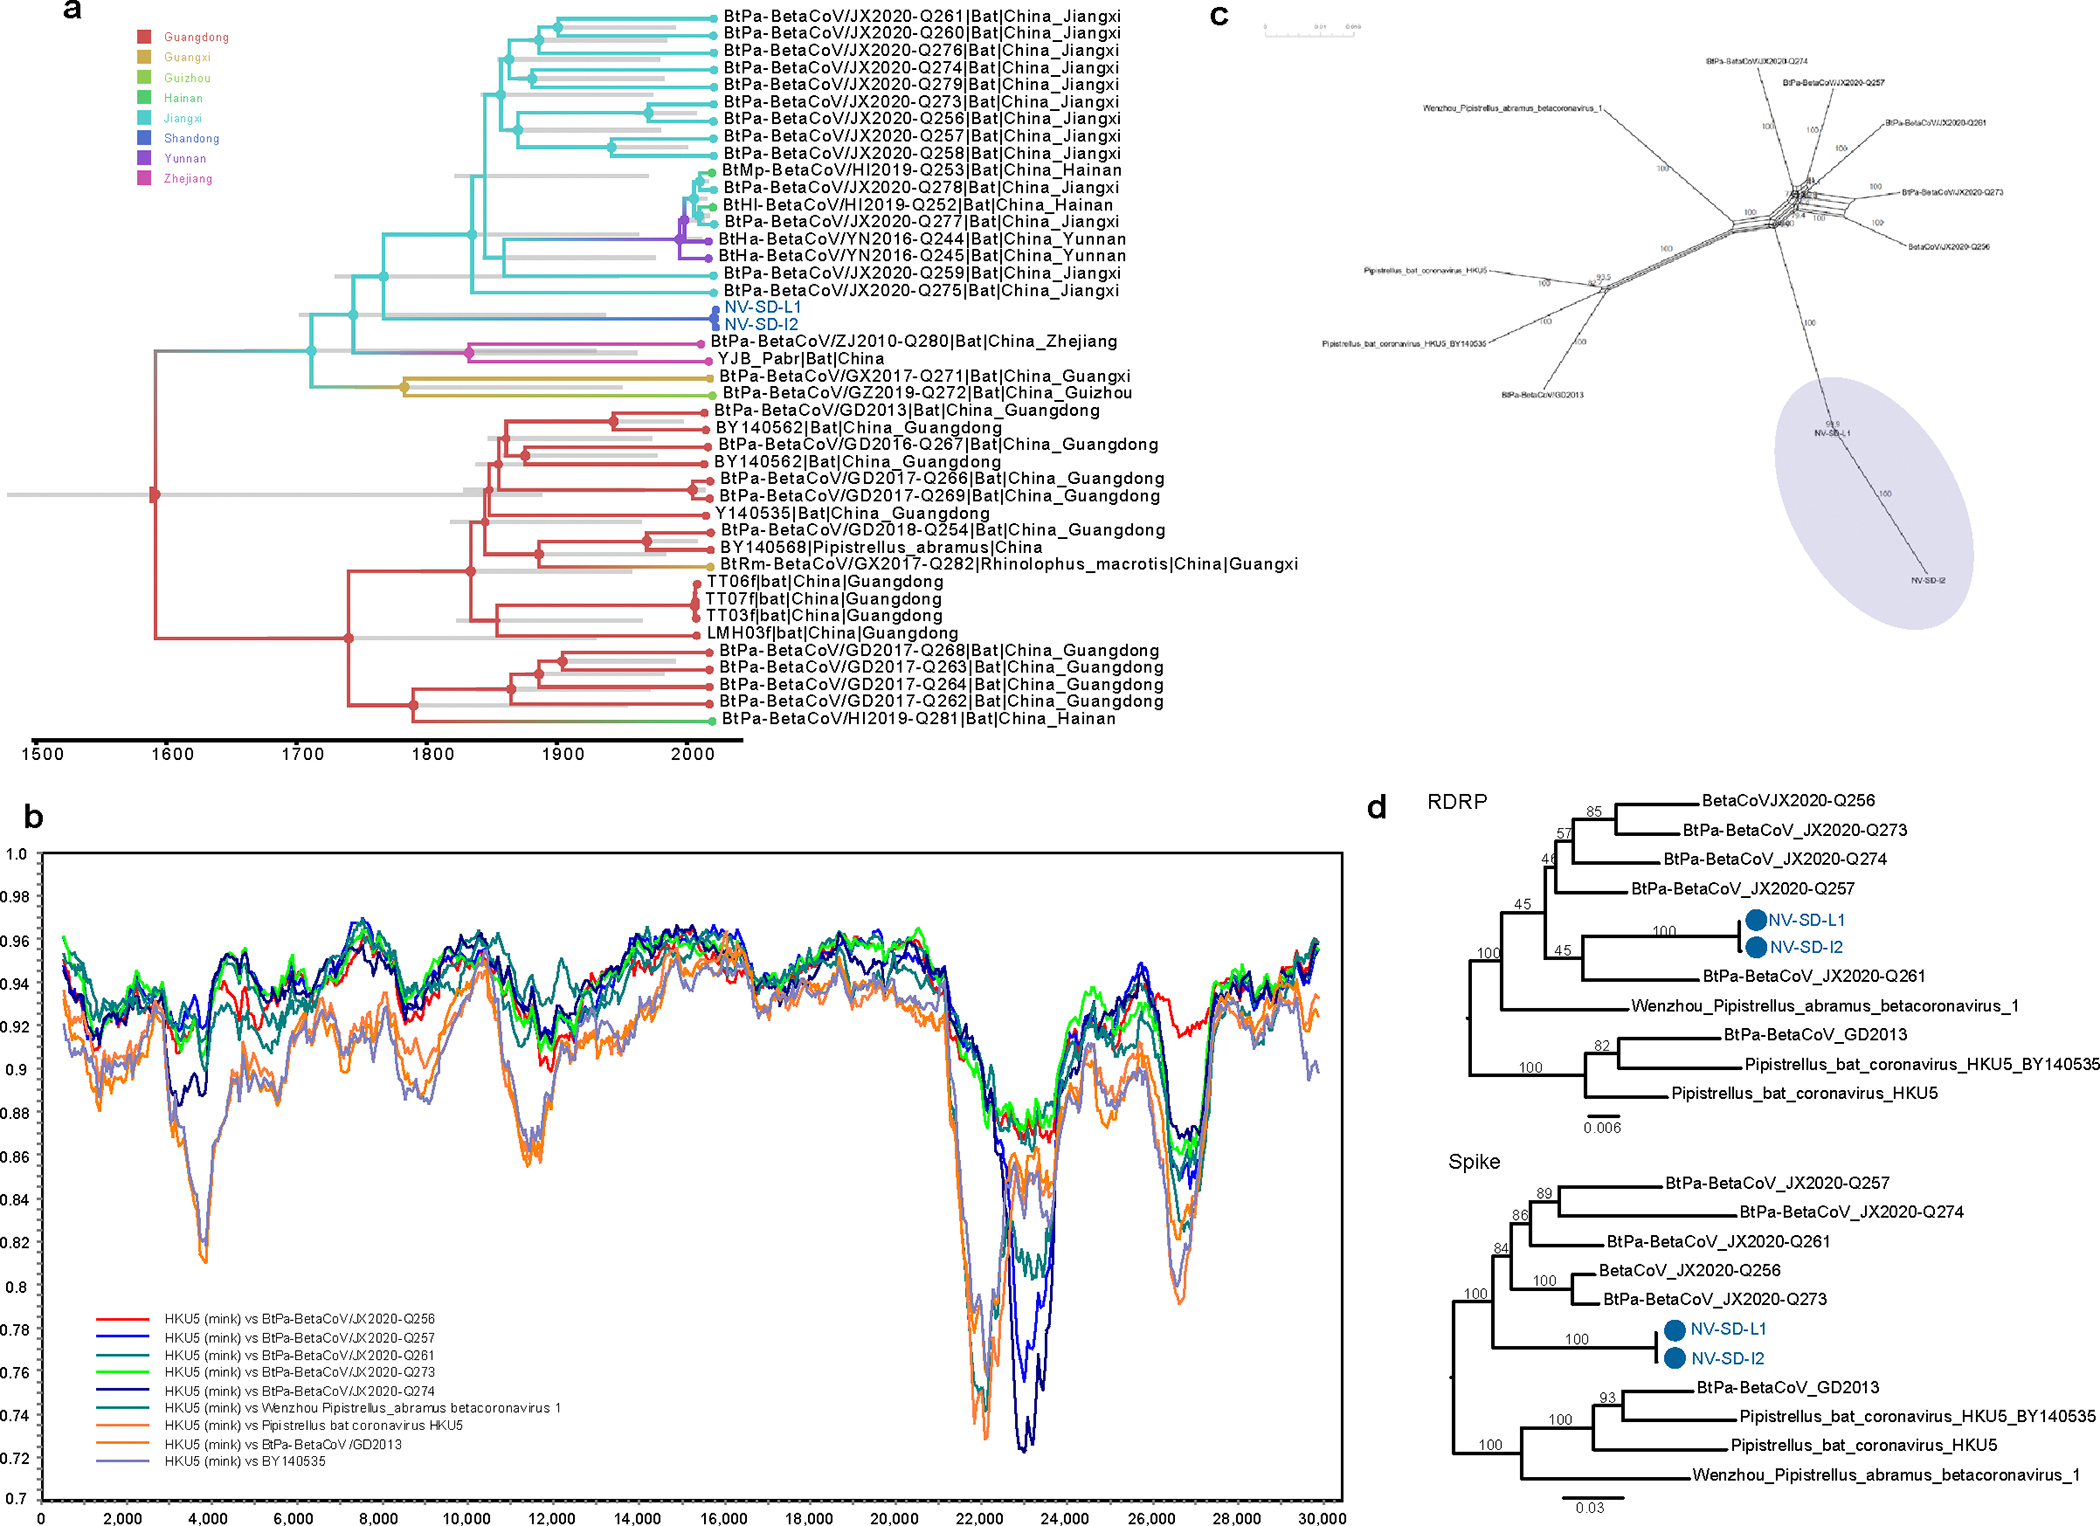
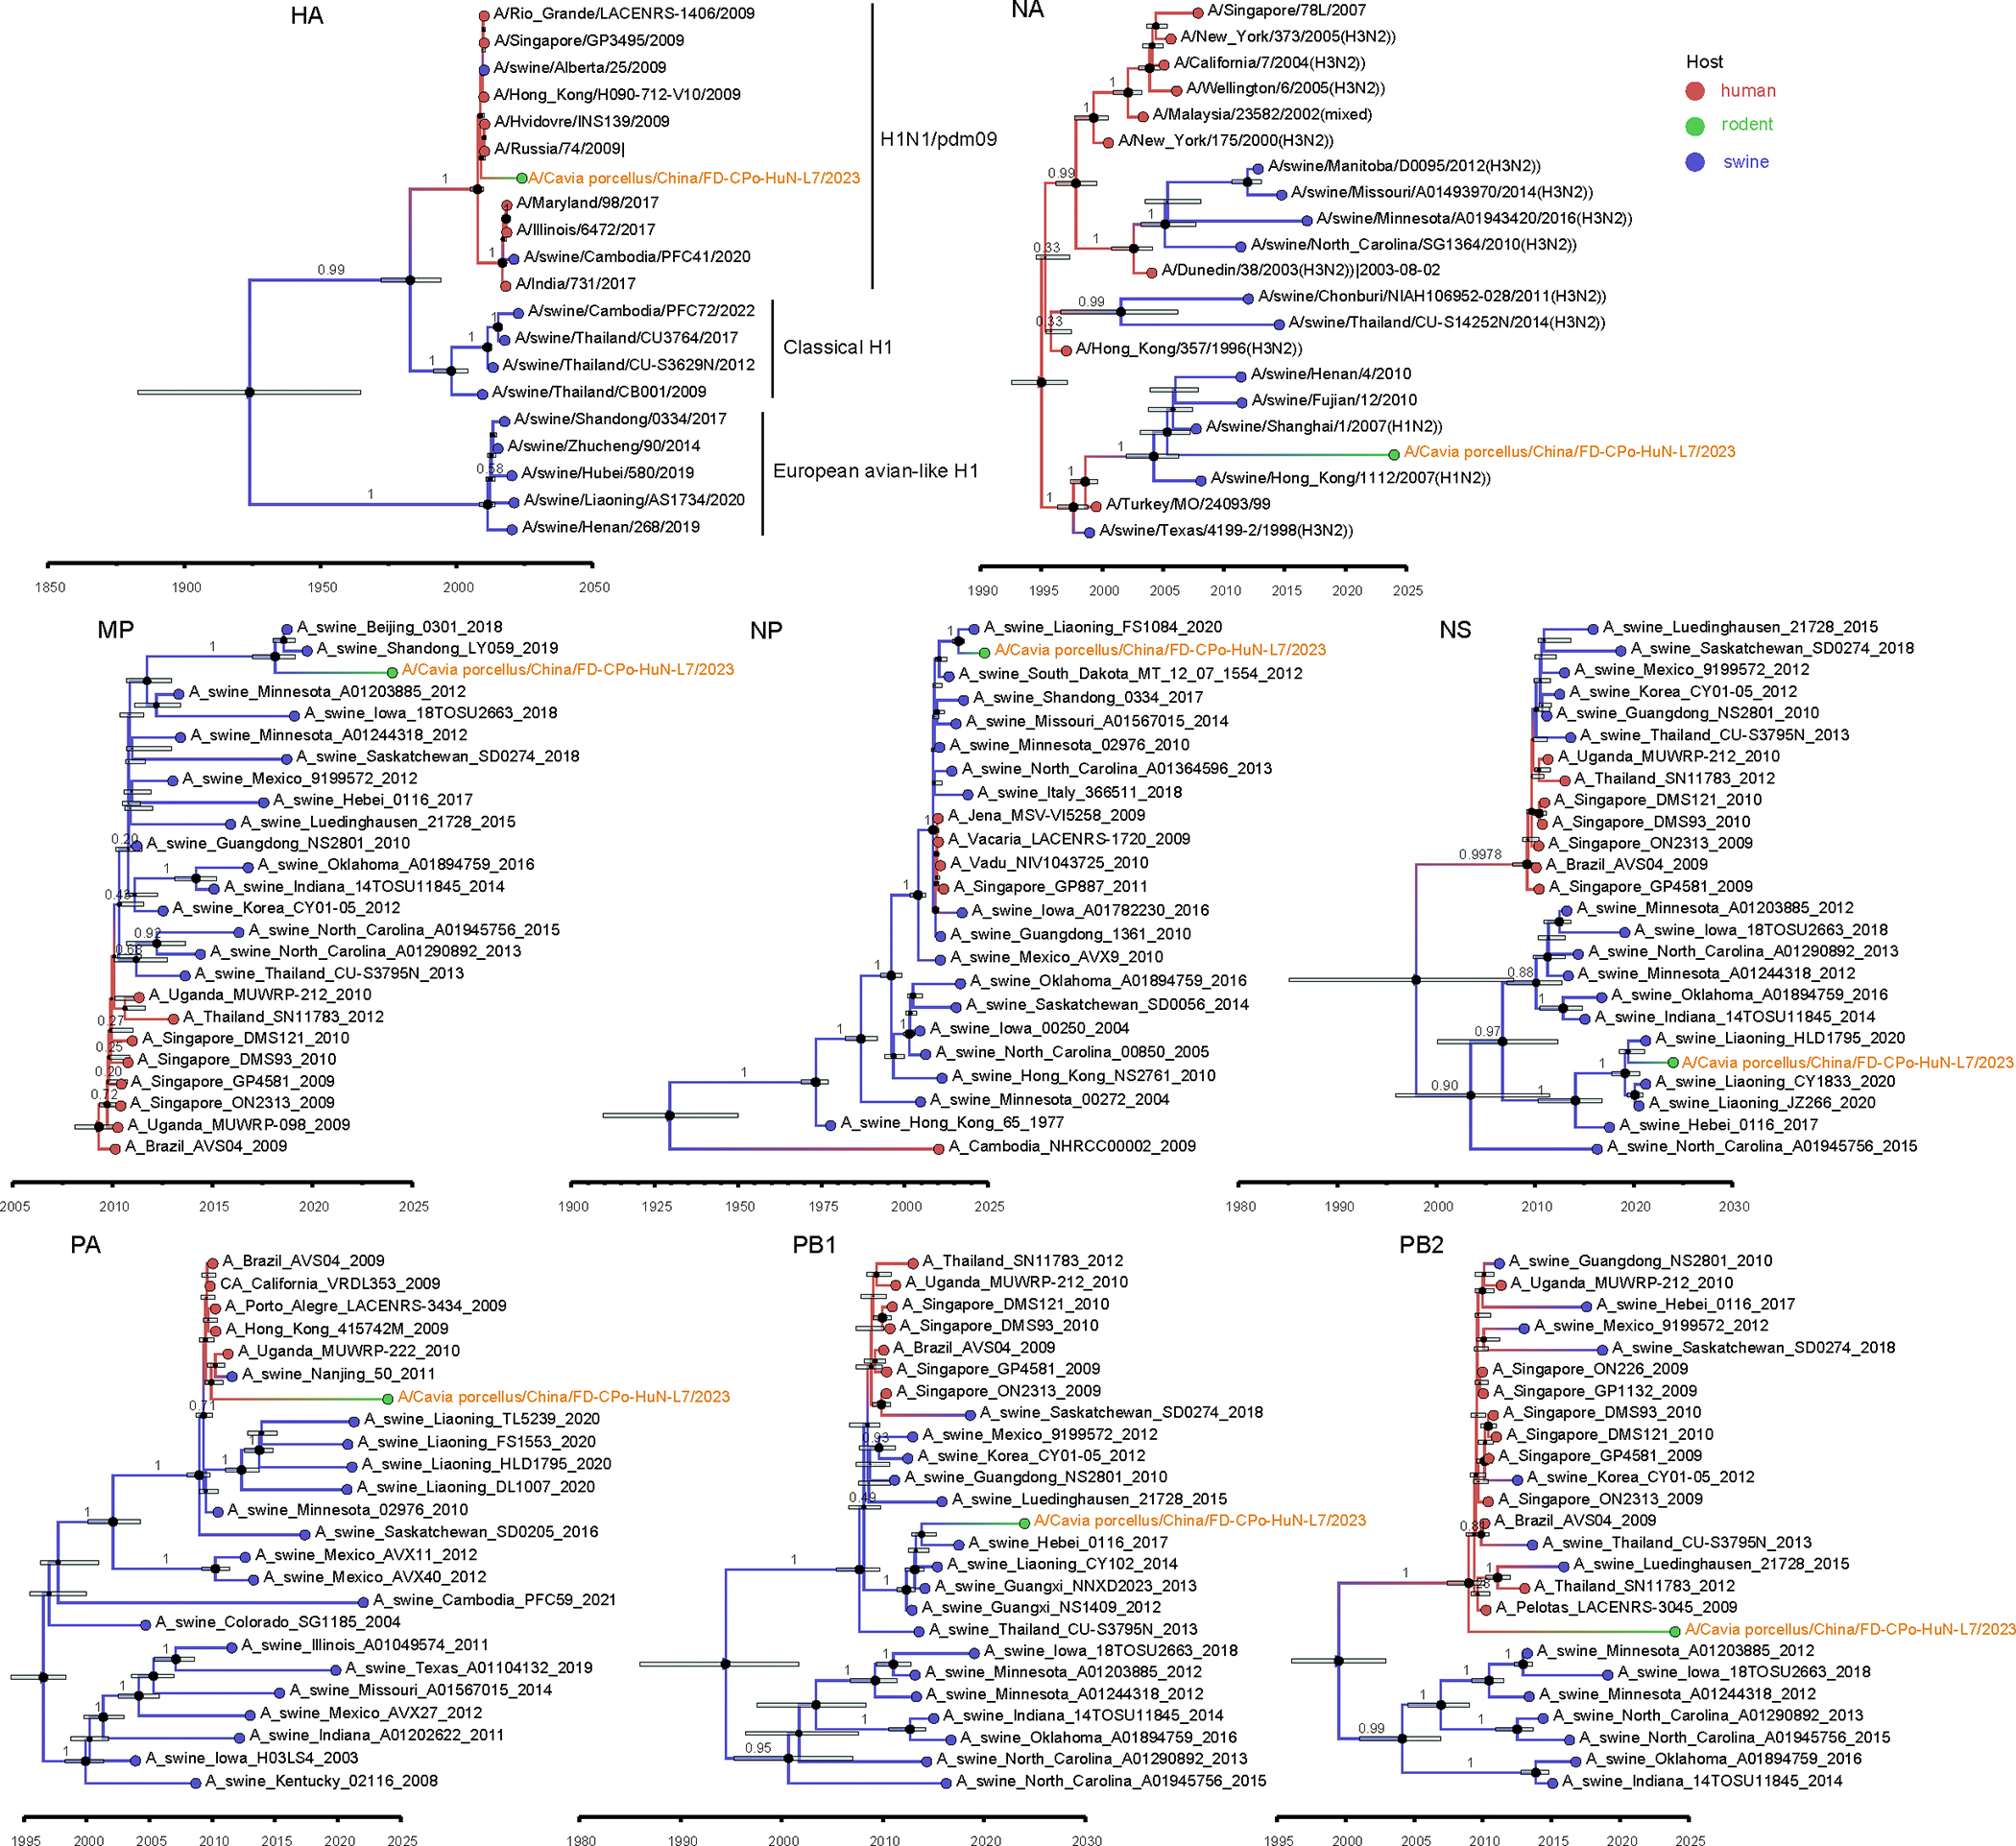
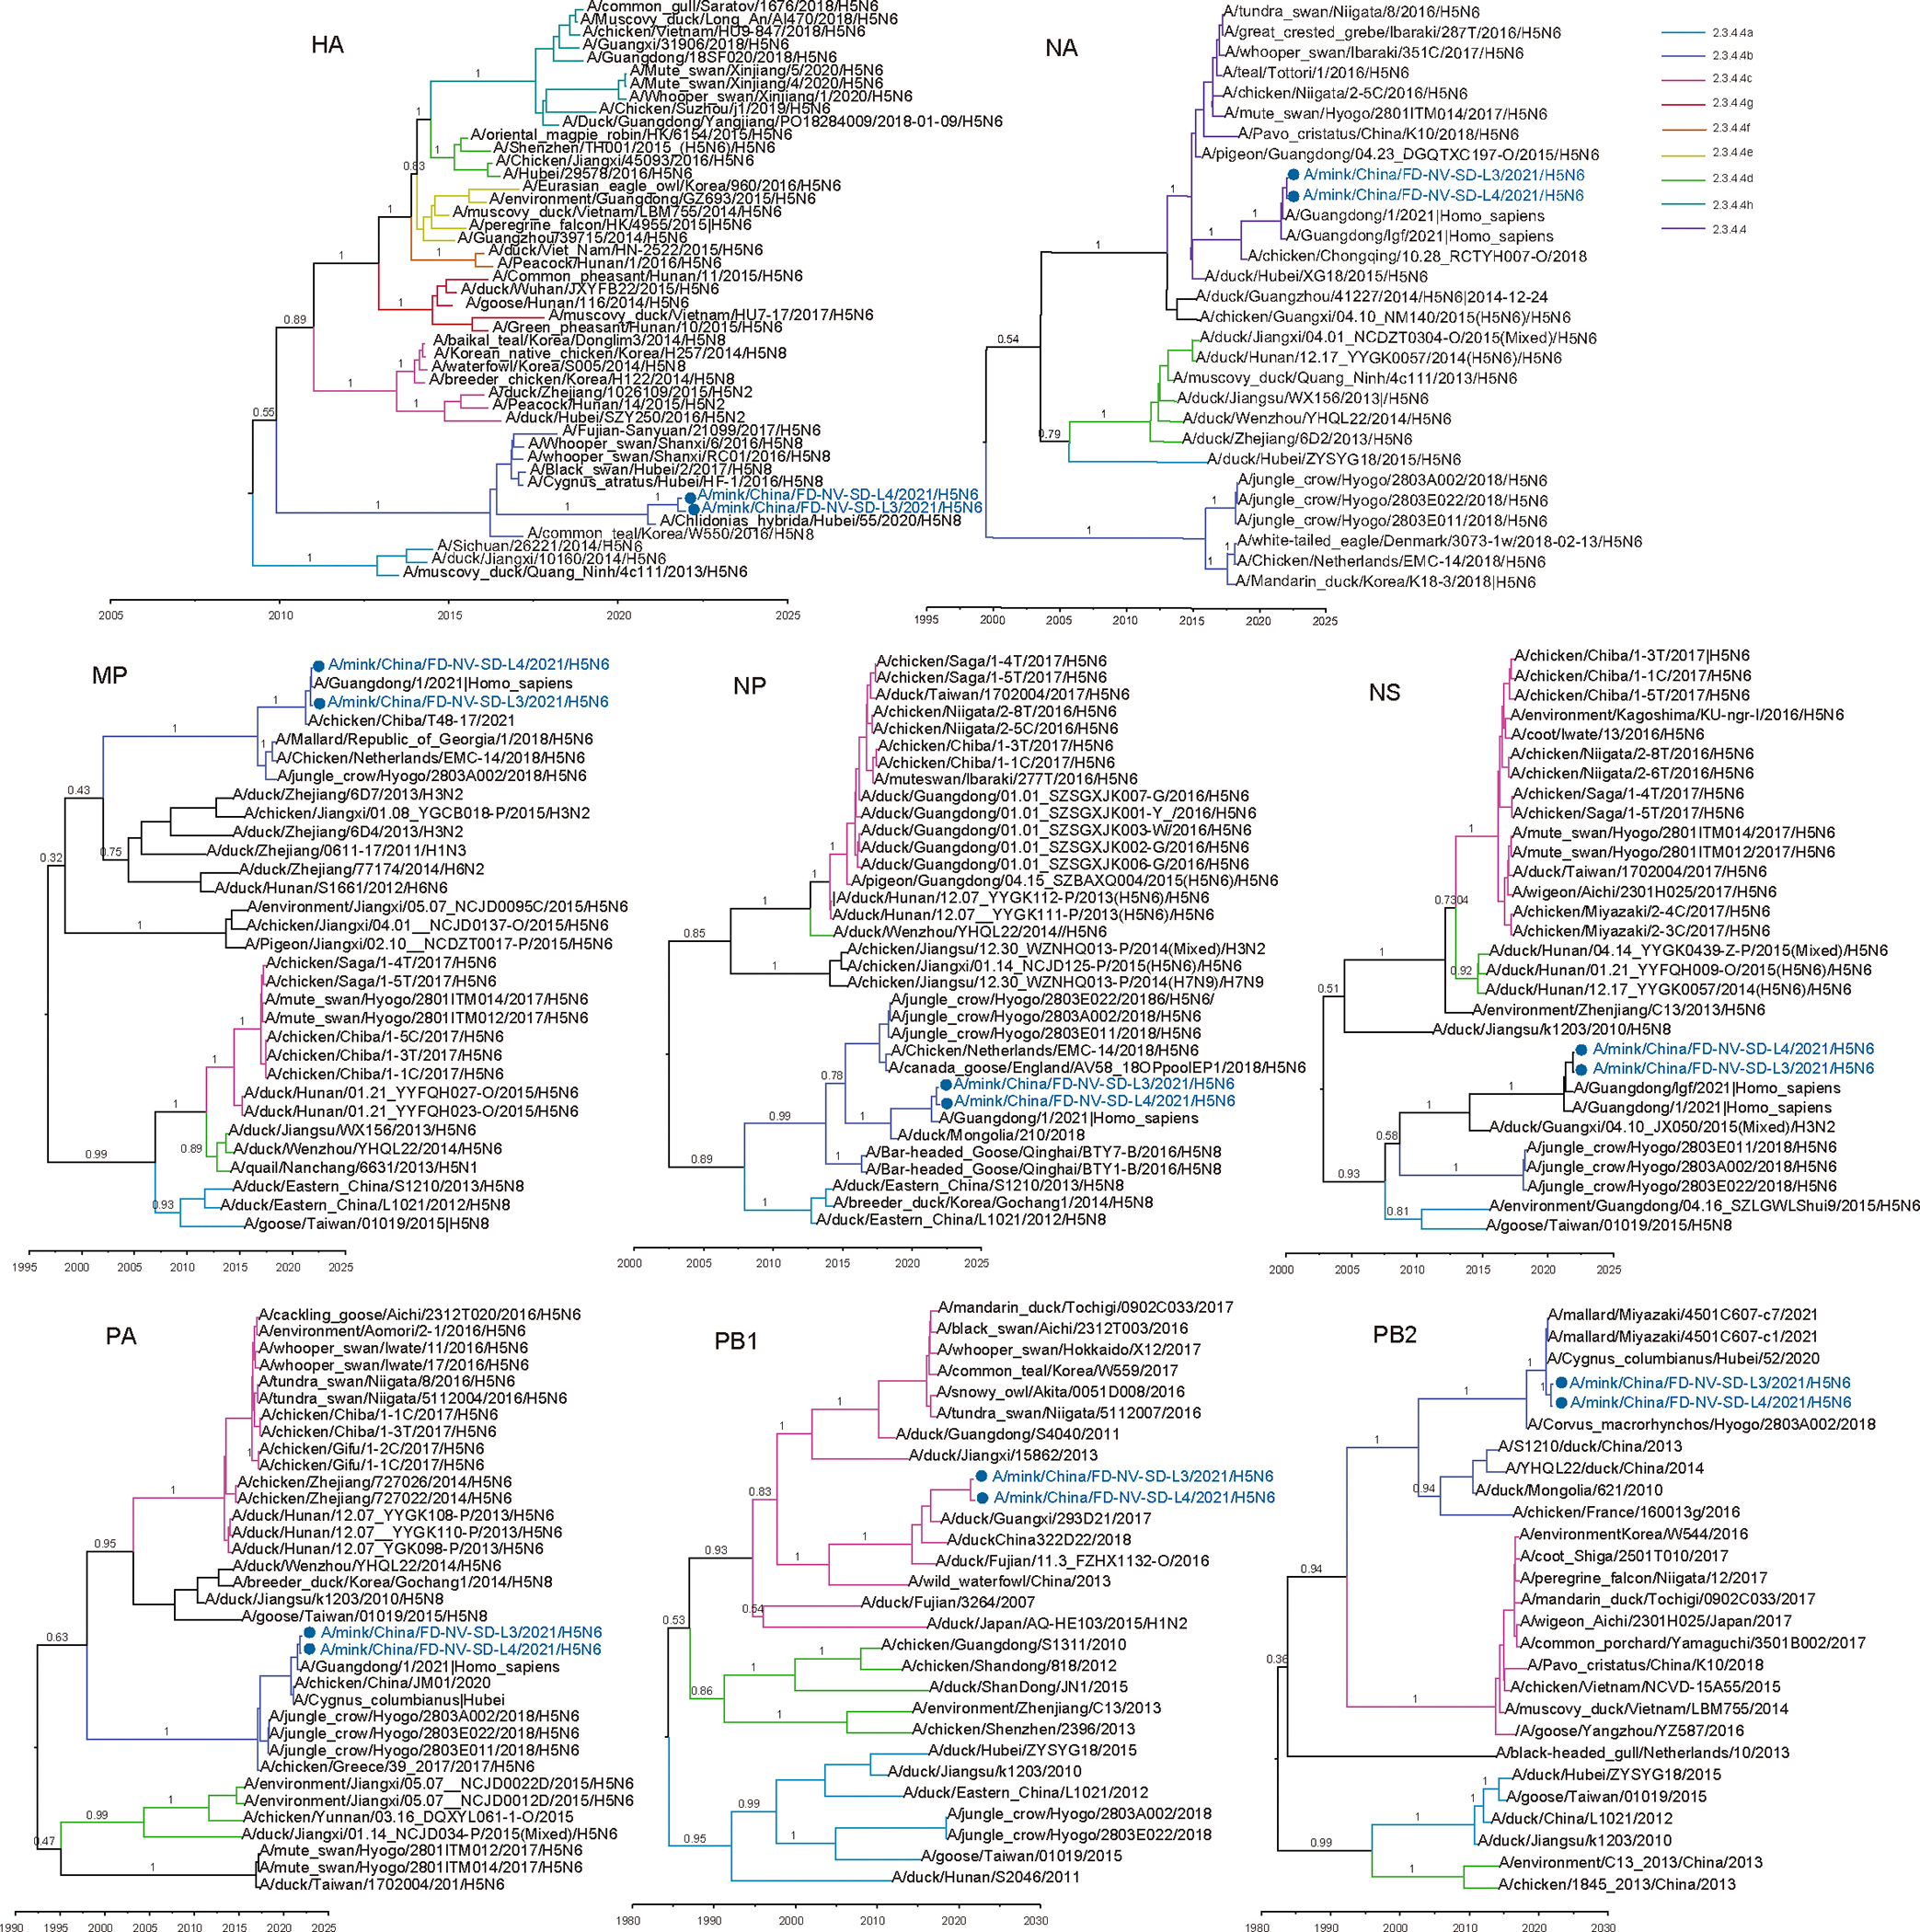
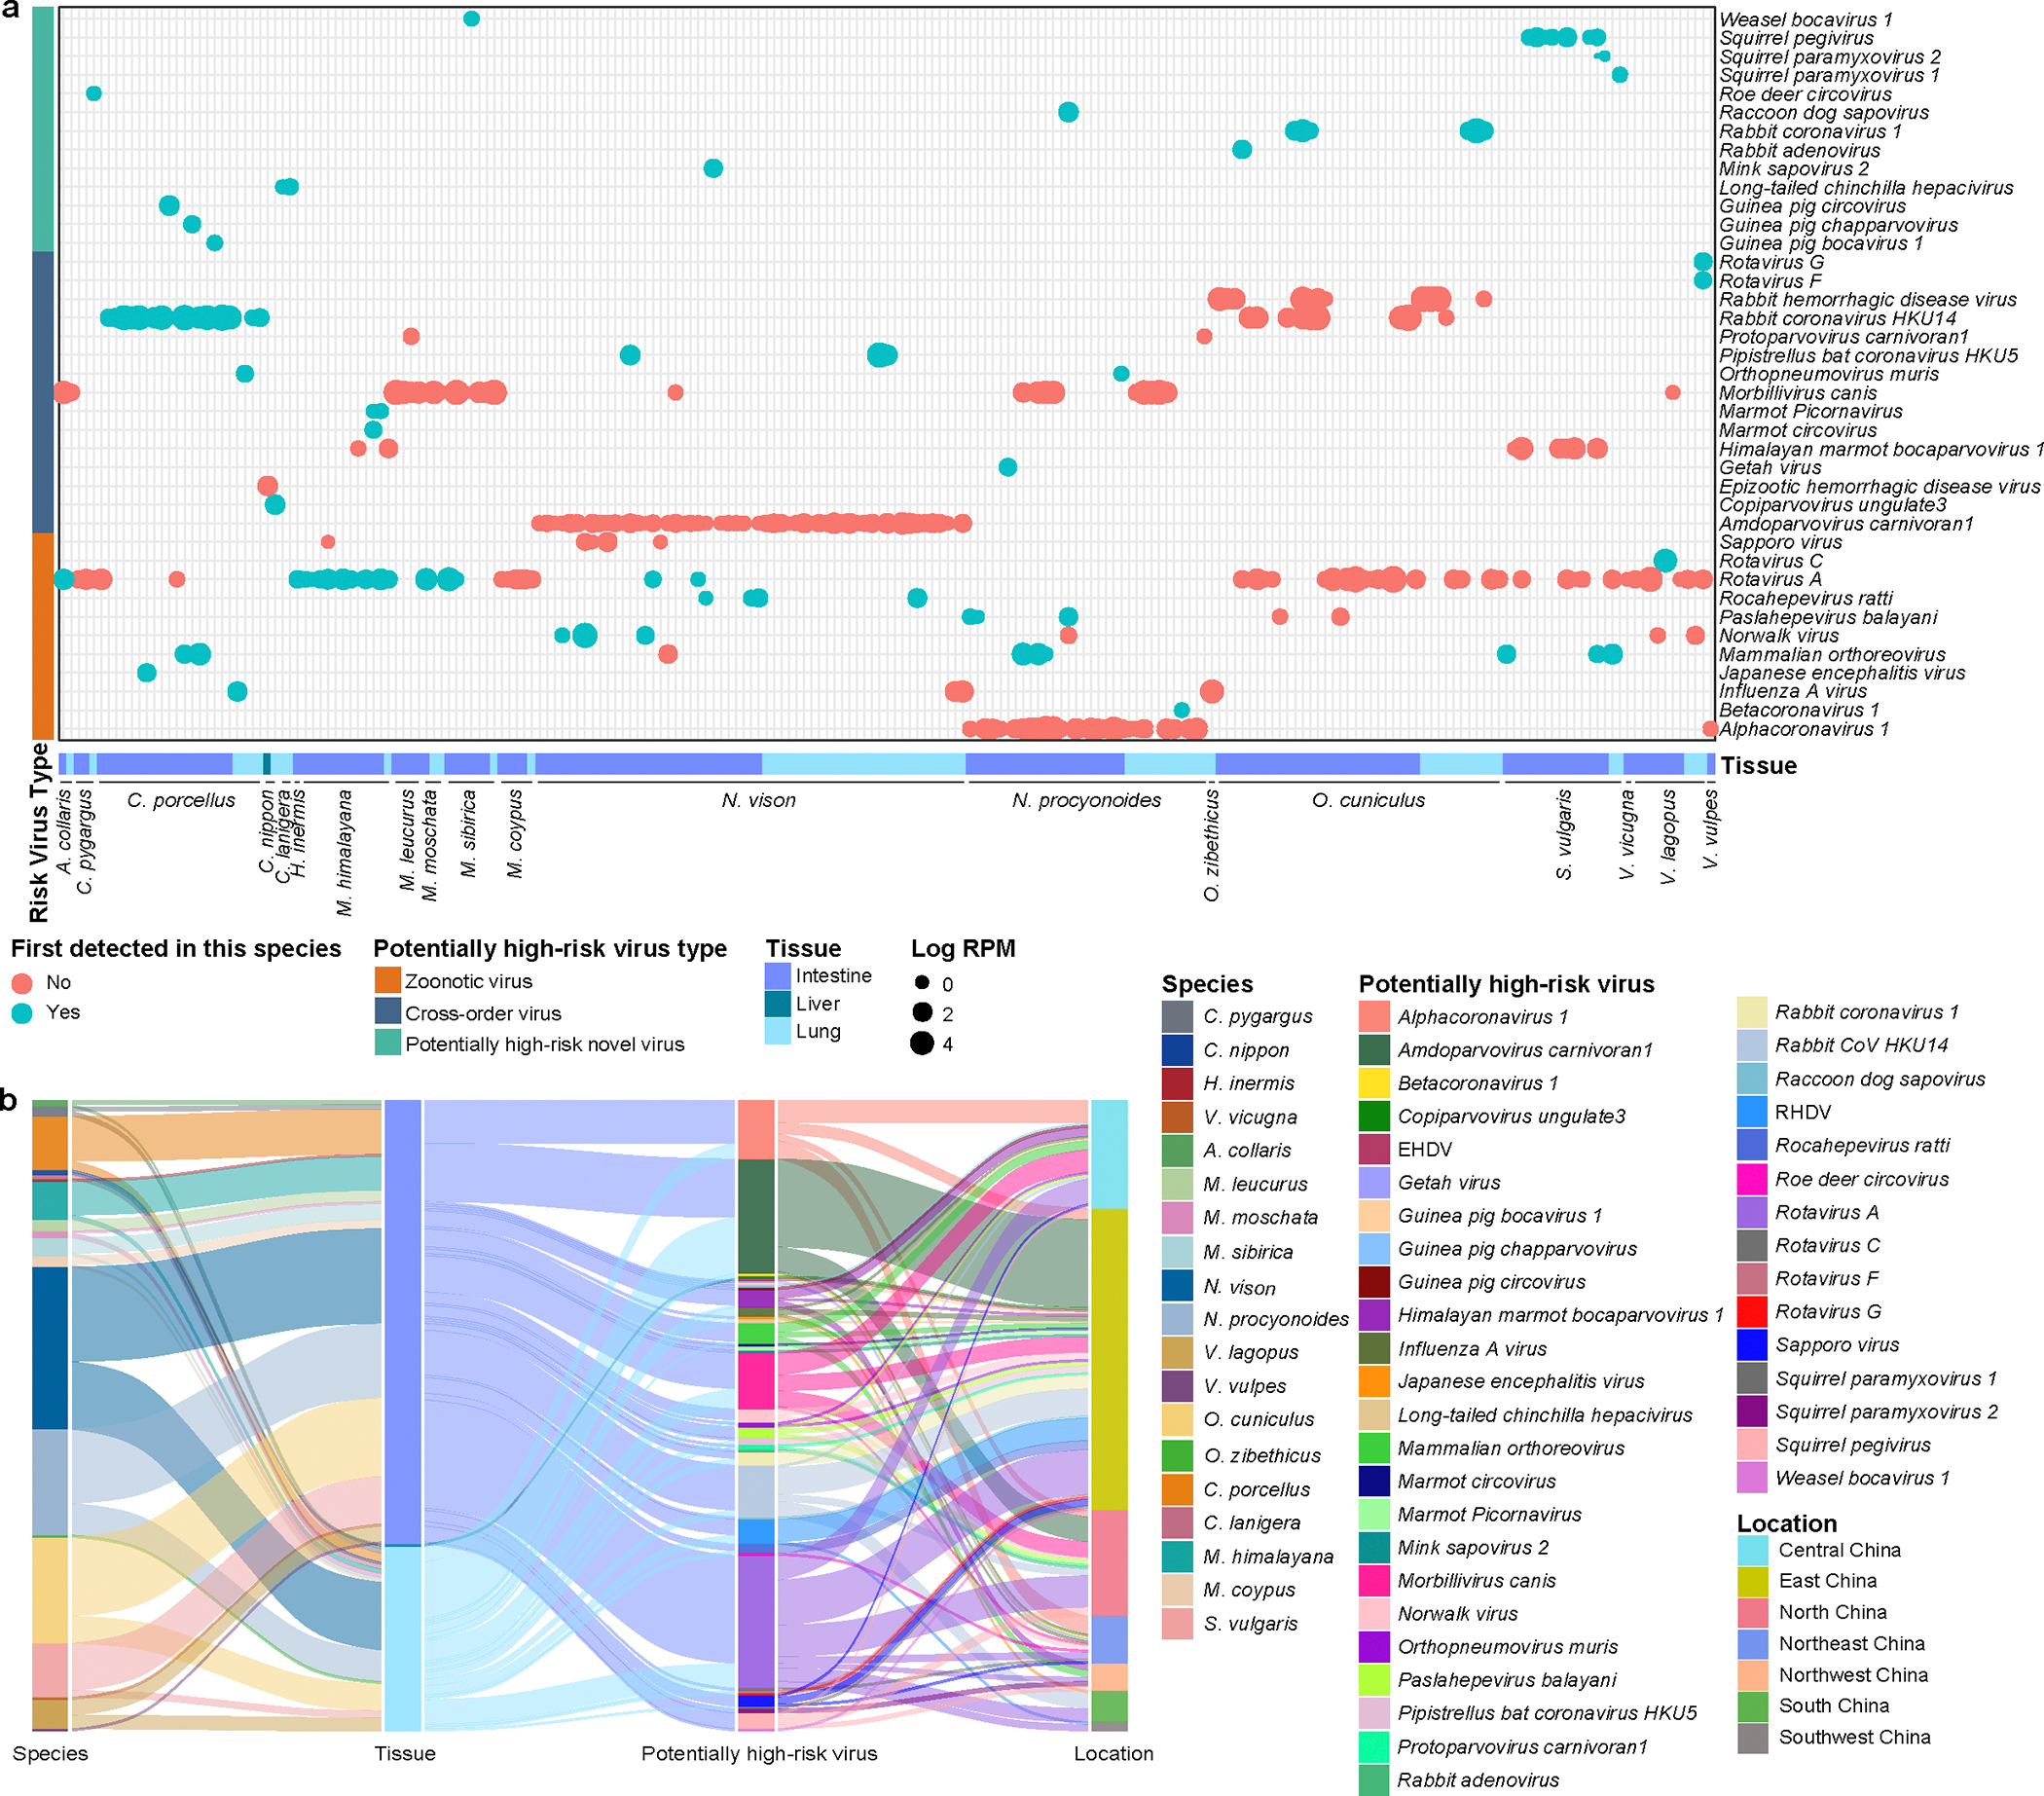
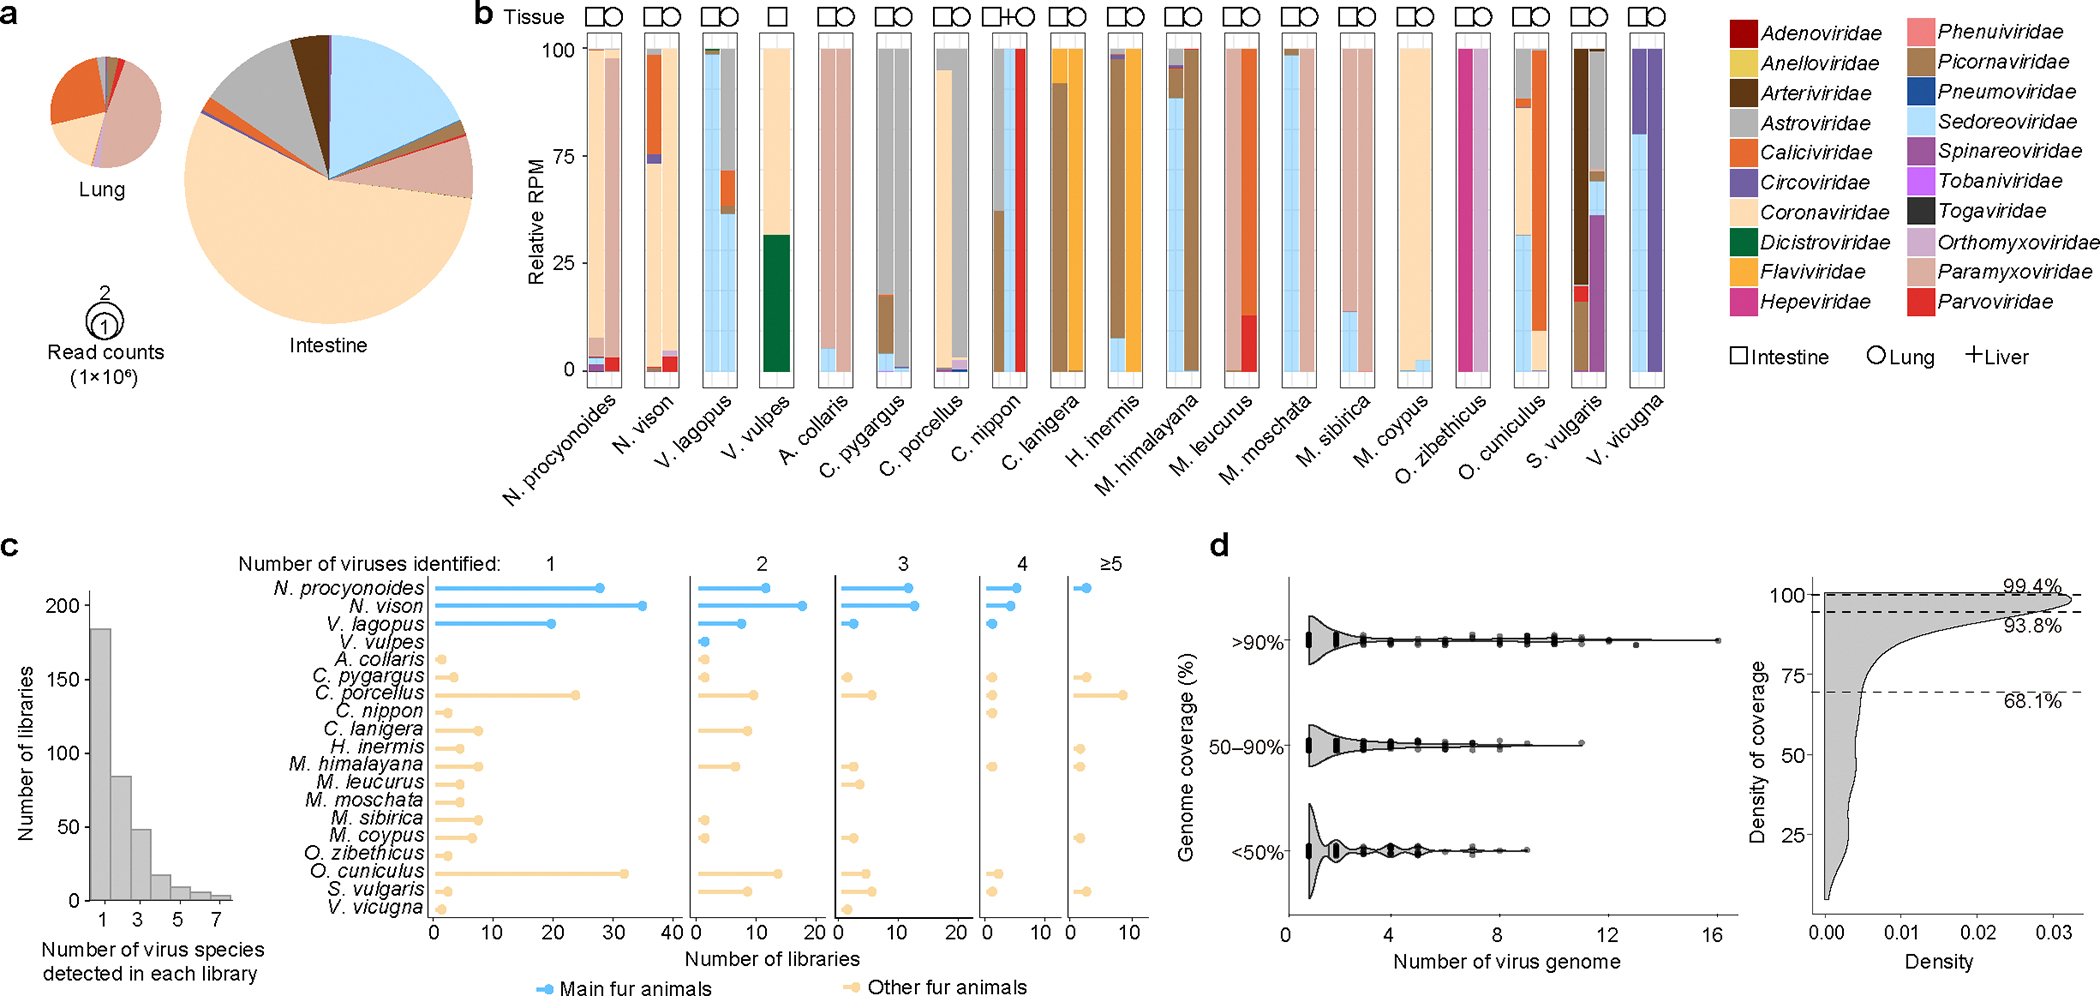
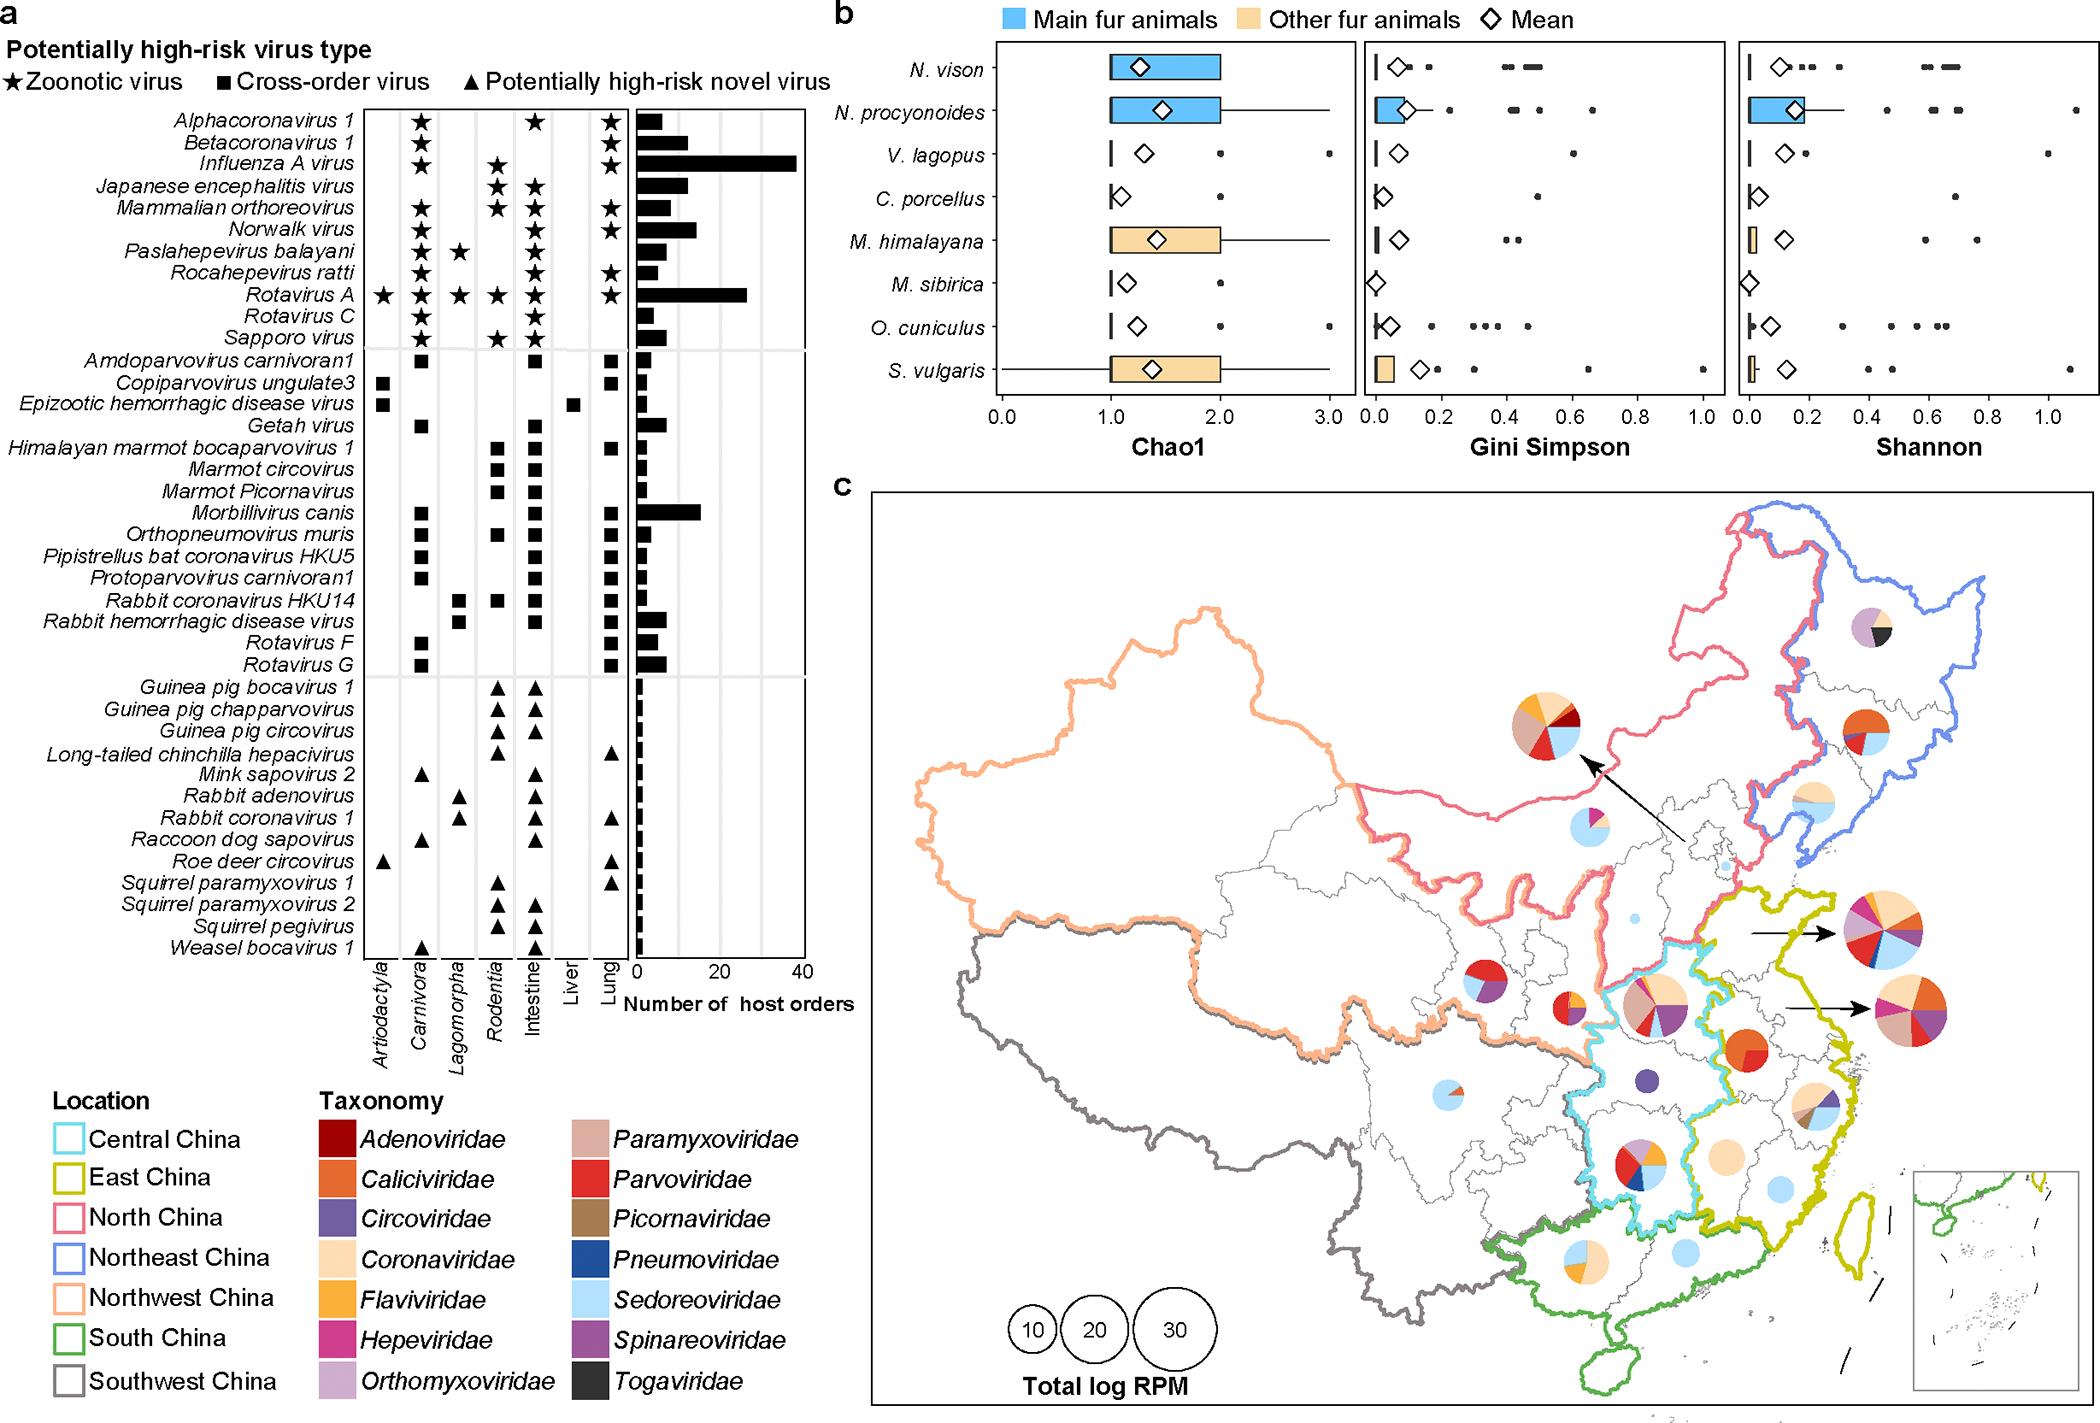
Animals such as raccoon dogs, mink and muskrats are farmed for fur and are sometimes used as food or medicinal products1,2, yet they are also potential reservoirs of emerging pathogens3. Here we performed single-sample metatranscriptomic sequencing of internal tissues from 461 individual fur animals that were found dead due to disease. We characterized 125 virus species, including 36 that were novel and 39 at potentially high risk of cross-species transmission, including zoonotic spillover. Notably, we identified seven species of coronaviruses, expanding their known host range, and documented the cross-species transmission of a novel canine respiratory coronavirus to raccoon dogs and of bat HKU5-like coronaviruses to mink, present at a high abundance in lung tissues. Three subtypes of influenza A virus-H1N2, H5N6 and H6N2-were detected in the lungs of guinea pig, mink and muskrat, respectively. Multiple known zoonotic viruses, such as Japanese encephalitis virus and mammalian orthoreovirus4,5, were detected in guinea pigs. Raccoon dogs and mink carried the highest number of potentially high-risk viruses, while viruses from the Coronaviridae, Paramyxoviridae and Sedoreoviridae families commonly infected multiple hosts. These data also reveal potential virus transmission between farmed animals and wild animals, and from humans to farmed animals, indicating that fur farming represents an important transmission hub for viral zoonoses.


Conflict of interest statement

Competing interests

The authors declare no competing interests.

Figures

Extended Data Figure 1.
Extended Data Figure 1.. Abundance of vertebrate-associated viruses in fur animals at the species level.
The abundance of each virus was calculated and normalized based on the number of mapped reads per million total reads (RPM) and presented on the Log-10 scale. Different colour blocks represent different types of viruses and source organs. Source data are provided in the Source Data file.
Extended Data Figure 2.
Extended Data Figure 2.. Newly discovered viruses, the infection spectrum of the animals studied and the extent of coinfection.
(a) The infection spectrum of the studied animals, with animals represented by images. Viruses are shown at the nodes, with the node colour specifying the viral family. The size of the nodes represents the number of animals infected by the virus, and the width of the edges indicates the number of libraries of the host infected by the connected virus. (b) The viral families newly identified in the specific host. Each segment of the pie chart corresponds to a distinct animal species, depicted with unique colour, and the donuts with similar lighter colour, signify the newly discovered viral families. (c) Virus co-infection. Viruses are shown at the nodes, with the node colour specifying the viral family. The size of the nodes represents the frequency of co-infections with any other virus, while edge width represents the frequency of co-infections between the two viruses.
Extended Data Figure 3.
Extended Data Figure 3.. Inter-specific phylogenetic trees of 12 major families of vertebrate-associated RNA viruses.
Phylogenetic trees were inferred for each family of RNA viruses based on amino acid sequences of the RNA-dependent RNA polymerase protein. All trees are midpoint-rooted for clarity and display bootstrap values for major branches. Coloured dots represent viruses with different host origins. The scale bar represents the number of amino acid substitutions per site.
Extended Data Figure 4.
Extended Data Figure 4.. Phylogenetic trees of vertebrate-associated RNA viruses from the Flaviviridae and Orthomyxoviridae in fur animals.
Phylogenetic trees of viruses in the (a) Flaviviridae and (b) Orthomyxoviridae were inferred from the amino acid sequences of the RNA-dependent RNA polymerase and hemagglutinin proteins (Orthomyxoviridae). All trees are midpoint-rooted for clarity and display bootstrap values for major branches. Different coloured dots represent viruses with different geographic origins. Colour shading represents different animal orders, and specific species are depicted with animal pictures. The scale bar represents the number of amino acid substitutions per site.
Extended Data Figure 5.
Extended Data Figure 5.. Phylogenetic tree of the Coronaviridae in farmed animals.
Phylogenetic tree of viruses in the Coronaviridae inferred from the amino acid sequences of the RNA-dependent RNA polymerase. The tree is midpoint-rooted for clarity and displays bootstrap values at the major branches. Different coloured dots represent viruses with different geographic origins. Colour shading represents different animal orders, and specific species are depicted with animal pictures. The scale bar represents the number of amino acid substitutions per site.
Extended Data Figure 6.
Extended Data Figure 6.. Inter-specific phylogenetic trees of four vertebrate-associated DNA virus families.
Phylogenetic trees were inferred for each DNA virus family based on the amino acid sequences of conserved viral proteins (DNA viruses = replication related protein, i.e., Anelloviridae: ORF1, Parvoviridae: NS1, Adenoviridae: DNA polymerase, and Circoviridae: Rep protein). All trees are midpoint-rooted for clarity and display bootstrap values for major branches. Coloured dots represent viruses with different host origins. The scale bar represents the number of amino acid substitutions per site.
Extended Data Figure 7.
Extended Data Figure 7.. Intra-specific phylogenetic diversity of multi-host infecting viruses identified in fur animals.
Phylogenetic trees were inferred for each virus species based on the nucleotide sequences of the key gene (i.e., Coronavirus: S1 gene, Paslahepevirus balayani: full genome, Japanese encephalitis virus: E gene, Mammalian orthoreovirus: S1 gene, Norwalk virus: VP1, Rotavirus A: VP7). All trees are midpoint-rooted for clarity and display bootstrap values for the major branches. Coloured dots represent different host sources.
Extended Data Figure 8.
Extended Data Figure 8.. Recombination and phylogenetic analysis of mink-derived Pipistrellus bat coronavirus HKU5.
(a) Maximum clade credibility (MCC) tree based on genome of mink-derived HKU5-like viruses. (b) Simplot was used to perform recombination scanning on the mink-derived HKU5-like sequences and related reference sequences. (c) Neighbor-Net reconstruction based on the complete genome sequences of mink HKU5 and Bat CoVs using Splitstree5, employing the HKY85 substitution model and 1000 bootstraps. (d) IQ-TREE (v2.1.4) was used to estimate maximum likelihood trees based on RdRp and S gene nucleotides, respectively.
Extended Data Figure 9.
Extended Data Figure 9.. Phylogenetic analysis of guinea pig-derived Influenza A virus H1N2.
Maximum clade credibility (MCC) trees based on the HA, MP, NA, NP, NS, PA, PB1, and PB2 gene sequences of H1N2 influenza virus. MCC trees were summarized from Bayesian phylodynamic inferences using BEAST (v1.10.5). Coloured lines and dots represent the host: human (red), rodent (green), and swine (light-blue).
Extended Data Figure 10.
Extended Data Figure 10.. Phylogenetic analysis of two mink-derived Influenza A virus H5N6.
Maximum clade credibility (MCC) trees based on the HA, MP, NA, NP, NS, PA, PB1, and PB2 gene sequences of H5N6. MCC trees were summarized from Bayesian phylodynamic inferences using BEAST (v1.10.5). Different virus clades are depicted in different colours. Blue dots denote the mink-derived H5N6 virus reported here.
Extended Data Figure 11.
Extended Data Figure 11.. Types and abundances of potentially high-risk viruses, along with their geographic and host origins
(a) The radius of the bubbles indicates the abundance of each potentially high-risk virus, with larger bubbles representing greater abundance. Green bubbles indicate that the virus was identified for the first time in the corresponding host species, while red bubbles indicate previous identification in that host. (b) The relationship between potentially high-risk viruses and their hosts, tissue types, and geographical regions. The line thickness represents the frequency.
Figure 1.
Figure 1.. Geographical distribution of animal sampling, fur animal composition, tissue type, library characteristics and viral read counts in this study.
(a) The geographical distribution of 461 deceased animals sampled from multiple Chinese provinces, as well as the main provinces engaged in fur animal husbandry. The fur animals sampled were divided into two categories: (i) the main farmed fur animals that are primarily used for fur production, including mink, foxes, and raccoon dogs; and (ii) the other multipurpose farmed animals, such as rabbits and nutria, that are used for fur production, food consumption, etc. The pie charts show the fur animals sampled. Each main fur animal was assigned a unique colour; the colour of the circle denotes the main or other farmed fur groups. The size of the pie represents the sampling quantity. (b) The distribution of fur animal samples by living condition (left) and sampling organ (right). This study involved dead animals from both captive breeding and wild environments. Sequencing libraries were derived from individual tissues, mostly either the lungs or the intestines, or both the lungs and intestines were used simultaneously. (c) The viral read counts in each library from different species. The box plot shows the median (grey centre line), quartiles (box limits), and the maximum and minimum values (whiskers).
Figure 2.
Figure 2.. The vertebrate-associated virome of fur animals.
(a) The composition of viruses is displayed at the family level in intestine and lung tissues on the basis of the number of reads with vertebrate-associated viruses. The area of the pie chart represents the total number of virus reads in the intestines or lungs; scale guides of 1 million and 2 million virus reads are shown. (b) The relative abundance of viruses in different tissues of various hosts at the family level. (c) The number of virus species identified in each library. Left, the number of libraries in which 1–7 virus species have been identified. Right, the five boxes list the number of libraries in different animal species in which 1, 2, 3, 4, and ≥5 virus species have been identified. (d) The genome coverage of viral sequences obtained in this study for each sample (left). The violin plot shows the genome coverage of viral sequences for each sample, with the area of each section representing the distribution probability. Right, density plot illustrating the distribution of assembly completeness. The black dashed lines indicate the quartiles and the median.
Figure 3.
Figure 3.. Potentially high-risk virus species and their epidemiological characteristics.
(a) The host range of the potentially high-risk viruses, sourced from NCBI GenBank (right). The stars, squares and triangles represent zoonotic viruses, cross-order viruses and potentially high-risk novel viruses, respectively, denoting identification in this study from the relevant tissue samples, along with the taxonomic order of the identified host. (b) The alpha diversity of potentially high-risk viruses from different species. The Chao1 index was used to determine the variation in viral diversity across diverse animal species, and the Gini-Simpson and Shannon indexes were used to demonstrate the disparities in viral abundance among different animals. The bold black vertical line represents the median, the hollow diamond represents the mean, and the box limits represent the quartiles. The solid black dots indicate values that exceed the lower threshold (25th percentile − 1.5× interquartile range) and upper threshold (75th percentile + 1.5× interquartile range). (c) The distribution of potentially high-risk viruses at the family level detected in various Chinese provinces and the total log-transformed RPM of potentially high-risk viruses belonging to the same family. Total log10 [RPM] represents the sum of the log10 [RPM] of all potentially high-risk viruses within the same province and the same family.

Similar articles

Cited by

References

    1. Lindh E et al. Highly pathogenic avian influenza A(H5N1) virus infection on multiple fur farms in the South and Central Ostrobothnia regions of Finland, July 2023. Euro surveillance : bulletin Europeen sur les maladies transmissibles = European communicable disease bulletin 28, doi:10.2807/1560-7917.Es.2023.28.31.2300400 (2023). - DOI - PMC - PubMed
    1. Enserink M Coronavirus rips through Dutch mink farms, triggering culls. Science (New York, N.Y.) 368, 1169, doi:10.1126/science.368.6496.1169 (2020). - DOI - PubMed
    1. Peacock TP & Barclay WS Mink farming poses risks for future viral pandemics. Proceedings of the National Academy of Sciences of the United States of America 120, e2303408120, doi:10.1073/pnas.2303408120 (2023). - DOI - PMC - PubMed
    1. Waller C et al. Japanese Encephalitis in Australia - A Sentinel Case. The New England journal of medicine 387, 661–662, doi:10.1056/NEJMc2207004 (2022). - DOI - PubMed
    1. Eledge MR, Zita MD & Boehme KW Reovirus: Friend and Foe. Current clinical microbiology reports 6, 132–138, doi:10.1007/s40588-019-00121-8 (2019). - DOI - PMC - PubMed

MeSH terms