. 2024 Oct;634(8035):961-969.
doi: 10.1038/s41586-024-07926-8. Epub 2024 Sep 4.

An aberrant immune-epithelial progenitor niche drives viral lung sequelae

Affiliations

An aberrant immune-epithelial progenitor niche drives viral lung sequelae

Harish Narasimhan et al. Nature. 2024 Oct.

Abstract

The long-term physiological consequences of respiratory viral infections, particularly in the aftermath of the COVID-19 pandemic-termed post-acute sequelae of SARS-CoV-2 (PASC)-are rapidly evolving into a major public health concern1-3. While the cellular and molecular aetiologies of these sequelae are poorly defined, increasing evidence implicates abnormal immune responses3-6 and/or impaired organ recovery7-9 after infection. However, the precise mechanisms that link these processes in the context of PASC remain unclear. Here, with insights from three cohorts of patients with respiratory PASC, we established a mouse model of post-viral lung disease and identified an aberrant immune-epithelial progenitor niche unique to fibroproliferation in respiratory PASC. Using spatial transcriptomics and imaging, we found a central role for lung-resident CD8+ T cell-macrophage interactions in impairing alveolar regeneration and driving fibrotic sequelae after acute viral pneumonia. Specifically, IFNγ and TNF derived from CD8+ T cells stimulated local macrophages to chronically release IL-1β, resulting in the long-term maintenance of dysplastic epithelial progenitors and lung fibrosis. Notably, therapeutic neutralization of IFNγ + TNF or IL-1β markedly improved alveolar regeneration and pulmonary function. In contrast to other approaches, which require early intervention10, we highlight therapeutic strategies to rescue fibrotic disease after the resolution of acute disease, addressing a current unmet need in the clinical management of PASC and post-viral disease.


Conflict of interest statement

Competing interests J. Sun receives support for research unrelated to this project from Icosavax. J.W. receives support for research unrelated to this project from Regeneron.

Figures

Extended Data Fig. 1 |
Extended Data Fig. 1 |. Spatial transcriptomics of human PASC-PF lungs reveal persistent defects in alveolar regeneration and chronic inflammation.
(a) Representative RNA-ISH images staining for SARS-CoV-2 Spike RNA in acute COVID-19 (n = 5) and PASC-PF lung (n = 18) sections. (b) Representative H&E images of human control and PASC-PF lungs. (Scale bar = 2 mm) (c) UMAP visualization of spatial transcriptomics data from human control (n = 2) and PASC-PF (n = 3) lungs. (d) Gene expression distribution across all identified clusters of spots. (e) GSEA analysis of signalling pathways differentially regulated between control (n = 2) and PASC-PF (n = 3) lungs. (f) Spatial gene expression maps of epithelial and immune cell markers in control (n = 2) and PASC-PF (n = 3) lungs. (g) Spatial gene expression maps of CD4 in control (n = 2) and PASC-PF (n = 3) lungs. (h) Heatmap of the physical distribution of alveolar epithelium, dysplastic progenitors, and CD8+ T cells. (i) Representative immunofluorescence images staining alveolar epithelial cell markers (AT1 – AGER; AT2 – proSP-C) in control and PASC-PF lung sections, and (j) staining CD8+ T cells (CD8α+) and epithelial progenitors (KRT5+, KRT17+, and KRThigh) in control and (k) PASC-PF lung sections. (l) Higher magnification inset of PASC-PF lungs showing independent channels (red arrows – KRT5+, yellow arrows – KRT17+KRT5, grey arrows – KRT8high). (m) Quantification of KRT5+ area in control and PASC-PF lung sections (n = 12 control, 8 PASC-PF) (***p = 0.0007). (n) Representative immunofluorescence images staining for myofibroblasts (αSMA) and aberrant epithelial progenitors (KRT5+, KRT17+KRT5, KRT8high) in human control, PASC-PF, and IPF lung sections. (o) Representative immunofluorescence images staining CD8+ T cells and epithelial progenitors in idiopathic pulmonary fibrosis (IPF) lung sections. (p) Quantification of CD8+ T cell number in control, PASC-PF, and IPF lung sections (n = 11 control, 13 IPF, 19 PASC-PF) (*p = 0.0343; ***p = 0.0001). (q) Representative Masson’s Trichome (MT) image (Scale bar = 2 mm) and (r) immunofluorescence images staining alveolar epithelial cell markers (AT1 – AGER; AT2 – proSP-C) in influenza-infected human lung sections. (s) Quantification of AT1 (AGER+) (*p = 0.0261) and AT2 (proSP-C+) (*p = 0.0272) cells, and (t) representative immunofluorescence images staining CD8+ T cells (CD8α+) and KRT8high transitional cells in influenza-infected human lungs (n = 3 control, 4 influenza). Statistical analyses were conducted using a two-tailed unpaired t-test (m,s) and one-way ANOVA (p). *p < 0.05; ***p < 0.001. Data are expressed as mean ± SEM; ns – not significant.
Extended Data Fig. 2 |
Extended Data Fig. 2 |. Characterization of immune-epithelial progenitor interactions in human PASC-PF, influenza, and IPF lungs.
(a) Representative immunofluorescence images staining CD8+ T cells and (b) quantification of CD8+ T cell distribution within KRT8−/low and KRT8high areas in PASC-PF lungs (5–7 random fields/lung; n = 10) (****p < 0.0001). (c) Representative immunofluorescence images staining CD8+ T cells and (d) quantification of CD8+ T cell distribution within KRT17KRT5 or KRT17+KRT5 areas in PASC-PF lungs (5–7 random fields/lung; n = 10) (****p < 0.0001). (e) Representative immunofluorescence images staining CD8+ T cells and (f) quantification of CD8+ T cell distribution within in KRT5 and KRT5+ areas in PASC lungs (5–7 random fields/lung; n = 10 lungs) (****p < 0.0001). (g) Unbiased analysis of CD8+ T cell distribution in an influenza-infected human lung section using QuPath. (h) Representative Masson’s Trichrome images of lungs from donors with prior influenza infection. (Scale bar – black = 500 μm; grey = 2 mm). (i) Simple linear regression of CD8+ T cell number and KRT8high area fraction in lungs with prior influenza infection (15 random fields/lung; n = 2 lungs). (j) Representative immunofluorescence images staining CD8+ T cells and (k) quantification of CD8+ T cells in KRT8−/low and KRT8high areas within IPF lungs. (n = 8) (l-m) Simple linear regression of CD8+ T cell number and (l) KRT8high area fraction in control lungs (n = 6–8 random fields; N = 7 lungs), (m) KRT5+ area fraction in PASC-PF (6–8 random fields/lung; n = 7) and (n) KRT+ area fraction in IPF (6–8 random fields/lung; n = 7) lung sections. Statistical analyses were conducted using a two-tailed unpaired t-test. ****p < 0.0001. Data are expressed as mean ± SEM; ns – not significant.
Extended Data Fig. 3 |
Extended Data Fig. 3 |. IAV but not SARS-CoV-2 infection induces chronic pulmonary pathology in aged mice.
(a) Percent change in bodyweight and survival (*p = 0.0291) of young and aged C57BL/6 following SARS-CoV-2 MA-10 infection (n = 10 per group). (b) Representative H&E images of young and aged C57BL/6 mice from acute (10 d.p.i.), and (c) H&E and MT at chronic (35 d.p.i.) phase post SARS-CoV-2 MA-10 infection. (d) Representative immunofluorescence images staining CD8+ T cells (CD8α) and epithelial progenitors (KRT5+ and KRT8high), and (e) quantification of CD8+ T cells in naïve and SARS-CoV-2 MA-10 infected (35 d.p.i.) aged C57BL/6 lungs. (n = 5 naïve, 4 MA-10) (**p = 0.0058). (f) Percent change in bodyweight and survival of aged BALB/c following SARS-CoV-2 MA-10 infection (n = 10 per group). (g) Representative H&E images of aged BALB/c mice from the acute (7 d.p.i.), and (h) H&E and MT chronic (35 d.p.i.) phase post SARS-CoV-2 MA-10 infection. (i) Representative immunofluorescence images staining CD8+ T cells (CD8α) and epithelial progenitors (KRT5+ and KRT8high), and (j) quantification of CD8+ T cells in naïve and SARS-CoV-2 MA-10 infected (35 d.p.i.) aged BALB/c lungs. (n = 4 naïve, 3 MA-10) (k) Percent change in bodyweight and survival data (*p = 0.0325) of aged K18-hACE2 mice following SARS-CoV-2 WA-1 virus infection (n = 3 PBS, n = 16 WA-1). (l) Representative H&E and MT images of aged K18-hACE2 lungs post SARS-CoV-2 WA-1 infection (35 d.p.i.) or PBS administration. (m) Representative immunofluorescence image staining CD8+ T cells (CD8α) and epithelial progenitors (KRT5+ and KRT8high), and (n) quantification of CD8+ T cells in naïve and SARS-CoV-2 WA-1 infected (35 d.p.i.) aged K18-hACE2 mice (n = 4 naïve, 4 WA-1). (o) Percent change in bodyweight and survival (*p = 0.0295) data of young and aged C57BL/6 following IAV virus infection (n = 10 per group). (p) Representative H&E and MT images of young and aged C57BL/6 lungs post IAV virus infection. (q) Representative image of young and aged IAV-infected mouse (35 d.p.i.) lung staining for CD8+ T cells and dysplastic progenitors (KRT8+ and KRT5+). Scale bar – black = 500 μm; grey = 2 mm. Data are representative of two (a-n) or three (o-p) independent experiments. Statistical analyses were conducted using a two-tailed unpaired t-test (e,j,n), two-way ANOVA (BW data – a,f,k,o), and log-rank test (survival data - a,f,k,o) *p < 0.05; **p < 0.01. Data are expressed as mean ± SEM; ns – not significant.
Extended Data Fig. 4 |
Extended Data Fig. 4 |. Chronic pathology and tissue sequelae after IAV infection mimics features of human PASC-PF.
(a) Representative immunofluorescence images staining CD8+ T cells (CD8α+) and epithelial progenitors (KRT5+ and KRT8high), and (b) quantification of KRT5+ area in young and aged lungs post IAV infection (n = 4–11 per time point) (*p = 0.0257). (c) Representative immunofluorescence images and (d) quantification of KRT8high transitional cells expressing PDLIM7 in young and aged C57BL/6 mouse lungs post-IAV infection (42 d.p.i.; n = 4) (*p = 0.0332). (e) Scatter plot comparing gene expression profiles of KRT8high transitional cells in young and aged mice following 14 days post-bleomycin injury from a previously published dataset (GSE157995). (f) Representative H&E and MT images (Scale bar – black = 500 μm; grey = 2 mm) and (g) evaluation of fibrotic disease (****p < 0.0001), and (h) evaluation of pathological lesions (**p = 0.0023, 0.0027; ****p < 0.0001) in aged naïve and IAV-infected C57BL/6 mice (250 d.p.i.) (n = 3 naïve, 8 infected). (i) Quantification of CD8+ T cells (*p = 0.0458), (j) KRT8high (*p = 0.0458), (k) KRT5+ areas (*p = 0.0327), (l) PDPN+ AT1 cells (*p = 0.0305) and (m) proSP-C+ AT2 cells in naïve and IAV-infected (250 d.p.i.) aged C57BL/6 mouse lungs (n = 3 naïve, 8 infected). Data are representative of two (d,g-m) or three (b) independent experiments. Statistical analyses were conducted using a two-tailed unpaired t-test (d,g,i-m), and two-way ANOVA (b,h). *p < 0.05; **p < 0.01; ***p < 0.001; ****p < 0.0001. Data are expressed as mean ± SEM; ns – not significant.
Extended Data Fig. 5 |
Extended Data Fig. 5 |. IAV infection of aged mice induces a sustained loss of alveolar epithelial cells unlike SARS-CoV-2.
(a) Representative immunofluorescence images of aged C57BL/6 and BALB/c mouse lungs infected with SARS-CoV-2 MA-10, staining alveolar epithelial cell markers (AT1- PDPN; AT2 – proSP-C). (b) Quantification of proSP-C+ AT2 (*p = 0.0141, 0.0168) and (c) PDPN+ AT1 area in aged C57BL/6 mice following SARS-CoV-2 MA-10 infection (n = 3–4 per time point). (d) Quantification of proSP-C+ AT2 (***p = 0.0005) and (e) PDPN+ AT1 area in aged BALB/c mice following SARS-CoV-2 MA-10 infection (n = 3–4 per time point). (f) Representative immunofluorescence images, and (g-i) quantification of proSP-C+ AT2 (Young - *p = 0.0333; **p = 0.0070. Aged - *p = 0.0391; **p = 0.0037; ***p = 0.0002) and PDPN+ AT1 (Young - **p = 0.0020, 0.0012; ***p = 0.0002. Aged - *p = 0.0441; **p = 0.0068) area in young and aged C57BL/6 mice following IAV infection (n = 3–4 per time point). (j) Representative immunofluorescence images of aged C57BL/6 mouse lungs infected with IAV or SARS-CoV-2 virus, staining for AT1 cells (PDPN) and viral nucleoprotein (NP). (k) Schematic of the FlexiVent system to evaluate pulmonary function in mice. The diagram was created using BioRender. (l) Evaluation of compliance of the respiratory system in young and aged mice post PBS administration or IAV infection (60 d.p.i.) (n = 3 per time point) (*p = 0.0135; **p = 0.0034). Data are representative of two (b-e,l) or three (g-h) independent experiments. Statistical analyses were conducted using a oneway ANOVA (b-e,h,i,l) and two-way ANOVA (g). *p < 0.05; **p < 0.01; ***p < 0.001. Data are expressed as mean ± SEM; ns – not significant.
Extended Data Fig. 6 |
Extended Data Fig. 6 |. Depletion of lung-resident CD8+ T cells improves fibrotic disease in aged but not young mice.
(a) Simple linear regression of CD8+ T cell number and KRT8high or (b) KRT5+ area fraction in aged IAV-infected mouse lungs at 30 d.p.i. (5–7 random fields/lung; n = 5) and (c) 60 d.p.i. (5–7 random fields/lung; n = 5). (d) Survival data of aged IAV-infected C57BL/6 mice following CD8+ T cell depletion prior to infection (n = 4 control IgG, 6 anti-CD8) (**p = 0.0046). (e) Representative H&E and MT images and (f) evaluation of fibrotic disease (n = 3 control IgG, 3 anti-CD8) (*p = 0.0207), and (g) pathological lesions in aged IAV-infected C57BL/6 mice (60 d.p.i.) following treatment with anti-CD8 or control IgG Ab. (n = 4 control IgG, 4 anti-CD8) (*p = 0.0125; **p = 0.0094; ***p = 0.0006). (h) Representative immunofluorescence images staining CD8+ T cells (CD8α+) and epithelial progenitors (KRT5+ and KRT8high), and (i) AT1 (PDPN+) and AT2 (proSP-C+) in aged C57BL/6 mouse lungs post IAV infection (60 d.p.i.), treated with anti-CD8 or control IgG Ab. (j) Representative H&E images (k) and immunofluorescence images of young C57BL/6 lungs post IAV infection (60 d.p.i.) treated with anti-CD8 or control IgG Ab. (l) Quantification of KRT8high, KRT5+ (*p = 0.0255), (m) AT1, and AT2 cells in young IAV-infected mouse lungs, treated with anti-CD8 Ab or control IgG Ab. (n = 5–6 IgG, 5–6 anti-CD8). (n) Representative immunofluorescence images of aged and young C57BL/6 lungs post-IAV infection (42 d.p.i.) following receipt of lung CD8+ T cells from young or aged infection-matched donors at 21 d.p.i. (o) Quantification of KRT8high area, (p) AT1 and (q) AT2 cells (**p = 0.0035) in aged or young C57BL/6 lungs post-IAV infection (42 d.p.i.) following receipt of lung CD8+ T cells from young or aged infection-matched donors at 21 d.p.i. (n = 3–6 per group). (r) Quantification of KRT8high (**p = 0.0021) and KRT5+ area (*p = 0.0454) in aged IAV-infected mouse lungs (60 d.p.i.), treated with control IgG Ab, low dose anti-CD8 or high dose anti-CD8 (n = 6–11 per group). Scale bar – black = 500 μm; grey = 2 mm. Data are representative of two (d,f,g,o) or three (l,m,r) independent experiments. Statistical analyses were conducted using a two-tailed unpaired t-test (f,l,m), two-way ANOVA (g), and an ordinary one-way ANOVA (o-r). *p < 0.05; **p < 0.01; ***p < 0.001. Data are expressed as mean ± SEM; ns – not significant.
Extended Data Fig. 7 |
Extended Data Fig. 7 |. CD8+ T cell depletion induces widespread changes in immune and epithelial cells gene expression when evaluated by spatial transcriptomics.
(a) Representative H&E images of aged IAV-infected mice (60 d.p.i.) treated with IgG Ab (n = 2) or anti-CD8 (n = 2) that were mounted on the 10X Visium slide. (b) UMAP visualization of spatial transcriptomics data from aged IAV-infected mice (60 d.p.i.), treated with IgG Ab or anti-CD8. (c) Heatmap of gene expression across all identified clusters of spots. (d) Evaluation of top DEGs enriched in human PASC-PF lungs within dysplastic (Krt) or healthy (AE) areas of aged IAV-infected mice. (e) Evaluation of top DEGs enriched in pathological areas of human PASC-PF lungs within dysplastic (Krt) or healthy (AE) areas of aged IAV-infected mice. (f) Evaluation of top signalling enriched in human PASC-PF lungs within dysplastic (Krt) or healthy (AE) areas of aged IAV-infected mice. (g) Evaluation of top DEGs enriched in human PASC-PF lungs within aged IAV-infected mice treated with IgG Ab or anti-CD8. (h) Evaluation of top DEGs enriched in pathological areas of human PASC-PF lungs (n = 3) within aged IAV-infected mice treated with IgG Ab or anti-CD8. (i) Evaluation of top signalling pathways enriched in human PASC-PF lungs (n = 3) within aged IAV-infected mice treated with IgG Ab or anti-CD8 (n = 2 each). (j) GSEA analysis of signalling pathways enriched in diseased (Krt5+ and Krt8hirich) areas compared to healthy alveolar epithelium. (k) Boxplots comparing gene expression signature of ADI/DATP/PATS and aberrant basaloid cells in diseased areas and healthy alveolar epithelium using spatial transcriptomics (n = 2 IgG). (l) Spatial map of the expression of dysplastic epithelial progenitors (Krt8, Krt5, Trp63), (m) alveolar epithelial (Sftpc1, Ager, Sftpa1), (n) CD8+ T cell (CD8a, CD8b1, Itgae), (o) monocyte-derived macrophages (Cx3cr1, Cd14, S100a6), and (p) alveolar macrophage (Flt1, Car4, Fabp5) marker genes in aged IAV-infected mice (60 d.p.i.), treated with IgG or anti-CD8. (q) Spatial map of the expression of genes associated with lung fibrosis in aged IAV-infected mice (60 d.p.i.), treated with IgG Ab or anti-CD8. Statistical analyses were conducted using a one-sided Wilcoxon rank sum test without any adjustment (d-I,k). Centerline, bounds of box, top line, and bottom line of the boxplots represent the median, 25th to 75th percentile range, 25th percentile − 1.5 × interquartile range (IQR), and 75th percentile + 1.5 × IQR, respectively.
Extended Data Fig. 8 |
Extended Data Fig. 8 |. Monocyte-derived macrophages but not alveolar macrophages are enriched in areas of dysplastic repair within human and mouse post-viral lungs.
(a) Representative immunofluorescence image of aged IAV-infected C57BL/6 mouse lungs staining for CXC3CR1+ macrophages and dysplastic progenitors (KRT5 and KRT8). (b) Representative immunofluorescence images of aged IAV-infected (60 d.p.i.) lungs treated with control IgG Ab or anti-CD8, staining monocyte-derived macrophages (CX3CR1) and dysplastic epithelial progenitors (KRT5 and KRT8). (c) Evaluation of CCL2 levels in bronchoalveolar lavage fluid from naïve or aged IAV-infected mice treated with control IgG Ab or anti-CD8 (n = 4 per group) (***p = 0.0002). (d) Quantification of Ccl2 (**p = 0.0020), Ccl3 (**p = 0.0052), and Cx3cl1 gene expression in lungs of aged IAV-infected mice treated with control IgG Ab or anti-CD8 (n = 3 IgG, 3 αCD8). (e) Quantification of the proportion of spots expressing the gene signature of monocyte-derived macrophages in human control and PASC-PF lungs. (f) Heatmap of the physical distribution of monocyte-derived macrophages (MDM), alveolar macrophages (AM), healthy alveolar epithelium (AE), and dysplastic areas (Krt) within human PASC-PF lungs. (g) Quantification of the proportion of spots expressing gene signatures characterizing monocyte-derived macrophages and alveolar macrophages in AGERhi and KRT17hi areas of human PASC-PF (n = 3) lungs. (h) Spatial gene expression maps of monocyte-derived macrophages, Krt-rich dysplastic areas, alveolar macrophages and healthy alveolar epithelium in human control (n = 2) and PASC-PF (n = 3) lungs. (i) Representative immunofluorescence image of human PASC-PF lungs staining for CD68+ macrophages and dysplastic progenitors (KRT5 and KRT8). (k) Quantification of CD68+ macrophages in human control and PASC-PF lungs (n = 12 control; 7 PASC-PF) (****p < 0.0001). Data are representative of two (c,d) independent experiments. Statistical analyses were conducted using a two-tailed unpaired t-test (d,k), and an ordinary one-way ANOVA (c). **p < 0.01; ***p < 0.001; ****p < 0.0001. Data are expressed as mean ± SEM; ns – not significant.
Extended Data Fig. 9 |
Extended Data Fig. 9 |. Areas of dysplastic repair are enriched with IL-1R signalling and inflammasome signatures in human PASC-PF and aged IAV-infected mouse lungs.
(a) Proportions of spots expressing gene signatures of IL-1R signalling and inflammasome activity in AGERhi and KRT17hi areas of human PASC-PF lungs. (b) Spatial gene expression maps of IL-1R signalling and inflammasome activity in aged IAV-infected mouse lungs (60 d.p.i.). (c) Gating strategy to identify proIL-1β+ cells IAV-infected mouse lungs by flow cytometry. (d) Histograms of caspase-1 levels in lungs of aged IAV-infected mice treated with IgG or Anti-CD8. (e) Gating strategy to identify FLICA+ cells in IAV-infected mice. (f) Spatial gene expression maps of inflammasome components in aged IAV-infected mice (60 d.p.i.) treated with IgG Ab or anti-CD8. (g) Representative immunofluorescence images staining for CD8+ T cells (CD8α) and TNF, and (h) IFN-γ in human control and PASC-PF lungs. (i) Quantification of TNF+ (*p = 0.0266) and IFN-γ+ (*p = 0.0378) lung-resident CD8+ T cells in naïve and IAV-infected (60 d.p.i.) aged mouse lungs (n = 5 naïve, 6 infected). (j) Proportions of spots expressing gene signatures of IFN-γ + TNF signalling in healthy (AGERhi) and diseased areas (KRT8hi or KRT17+) within human PASC-PF (n = 3) lungs. (k) Quantification of IL-1β gene expression (n = 3–4 wells/condition pooled from 4 mice) (*p = 0.0174; ***p = 0.0001), and (l) evaluation of IL-1β release following coculture of macrophages and CD8+ T cells from naïve aged C57BL/6 mice (n = 3 wells/condition pooled from 4 mice) (**p = 0.0037, 0.0089). (m) Gene expression of AT1 cell markers 3 days post AT2 cell culture and exposure to conditioned media (CM) (n = 2–3 wells/condition pooled from 5 mice) (*p = 0.0119, 0.0395; ****p < 0.0001). Data are representative of two (i,k,l,m) independent experiments. Statistical analyses were conducted using a two-tailed unpaired t-test (i), an ordinary one-way ANOVA (k,l), and a two-way ANOVA (m). *p < 0.05; **p < 0.01; *** p < 0.001; ****p < 0.0001. Data are expressed as mean ± SEM; ns – not significant.
Extended Data Fig. 10 |
Extended Data Fig. 10 |. Neutralization of IFN-γ and TNF or IL-1β activity in the post-acute phase of infection improves outcomes in aged IAV-infected mice.
(a) Representative H&E and MT images, (b) evaluation of fibrotic (n = 4 per group) (***p = 0.0003), (c) representative immunofluorescence images staining AT1 (PDPN+), AT2 (proSP-C+) and epithelial progenitors (KRT5+ and KRT8high), and (d) quantification of tissue damping (G) (*p = 0.0210) and elastance of the respiratory system (Ers) (*p = 0.0391) in aged IAV infected C57BL/6 mice (42 d.p.i.) treated with IgG Ab (n = 8) or anti-IFN-γ + anti-TNF neutralizing Ab (n = 9). (e) Experimental design for in vivo IL-1β blockade post IAV infection. The diagram was created using BioRender. (f) Representative H&E and MT images, (g) evaluation of fibrotic disease (n = 4 per group) (*p = 0.0400), (h) representative immunofluorescence images staining AT1 (PDPN+) and AT2 (proSP-C+) cells, and (i) quantification of tissue damping (G) (***p = 0.0008) and elastance of the respiratory system (Ers) (***p = 0.0001) in aged IAV infected C57BL/6 mice (42 d.p.i.) treated with control IgG Ab (n = 8) or anti-IL-1β neutralizing Ab (n = 9). (j) Evaluation of IL-1β levels in the BAL fluid of young and aged IAV-infected mice (42 d.p.i.; n = 6 young, 4 aged) (**p = 0.0024). (k) Representative H&E and MT images of young C57BL/6 lungs post IAV infection (42 d.p.i.) treated with anti-IL-1β neutralizing Ab or control IgG Ab. (l) Experimental design for in vivo IL-6 neutralization post IAV infection. The diagram was created using BioRender. (m) Representative H&E and MT images, and (n) evaluation of fibrotic disease in aged IAV-infected (42 d.p.i.) mice treated with anti-IL-6 neutralizing Ab or control IgG Ab (n = 3 per group), and (o) representative immunofluorescence images staining AT1 (PDPN+), AT2 (proSP-C+) and epithelial progenitors (KRT5+ and KRT8high), (p) quantification of KRT8high and KRT5+ area and (q) AT1 (PDPN+) and AT2 (proSP-C+) cells (n = 6 per group), and (r) evaluation of static compliance (Cst), resistance of the respiratory system (Rrs), and tissue elastance (H) in aged IAV-infected mice (42 d.p.i.) treated with IgG Ab (n = 5) or anti-IL-6 neutralizing Ab (n = 6). (s) An aberrant immune-epithelial progenitor nice drives post-viral lung sequelae. The diagram was created using BioRender. Scale bar – black = 500 μm; grey = 2 mm. Data are representative of two (b,g,j,n,p,r) or three (d,i) independent experiments. Statistical analyses were conducted using a two-tailed unpaired t-test. *p < 0.05; **p < 0.01; ***p < 0.001. Data are expressed as mean ± SEM; ns – not significant.
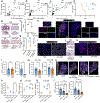
Fig. 1 |
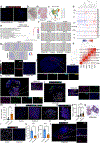
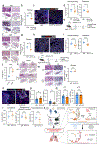
Fig. 1 |. An aberrant immune–epithelial progenitor niche is a hallmark of post-viral lung disease.
a, Representative Masson’s trichrome (MT) images of control and PASC-PF lung sections. Scale bar, 2 mm. b, Quantification of the proportion of spots expressing genes characterizing various immune and epithelial populations in control (n = 2) and PASC-PF (n = 3) lungs. c, Visualization of CD8+ T cells, areas enriched for KRT5+, KRT8high and KRT17+ cells and healthy alveolar epithelium based on gene expression signatures in human control (n = 2) and PASC-PF (n = 3) lungs. d, Quantification of AT1 (AGER+) and AT2 (proSP-C+) (***P = 0.0001) cells in control (n = 5) and PASC-PF (n = 12) lung sections. e,f,h, Quantification of KRT8high transitional (e), KRT17+KRT5 aberrant basaloid (f) and CD8+ T cells (h) in control (n = 15) and PASC-PF (n = 21) lung sections. g,j, Quantification of KRT8high (*P = 0.0247) (g) and CD8+ T cells (**P = 0.0038) (j) in control (n = 3) and influenza-infected (n = 4) human lung sections. i, Unbiased analysis of the CD8+ T cell distribution in a PASC-PF lung section using QuPath. km, Simple linear regression of the CD8+ T cell number and KRT8high area fraction in human PASC-PF lungs (k; 5–7 random fields per lung, n = 21 lungs), human lungs after influenza infection (l; 8 random fields per lung, n = 4 lungs) and IPF lung sections (m; 5–7 random fields per lung, n = 13 lungs). Statistical analysis was performed using two-tailed unpaired t-tests (d, eh and j); *P < 0.05, **P < 0.01, ***P < 0.001, ****P < 0.0001; NS, not significant. Data are mean ± s.e.m.
Fig. 2 |
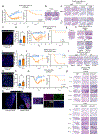
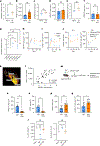
Fig. 2 |. Persistent CD8+ T cell activity impairs alveolar regeneration in a mouse model of post-viral fibrosis.
a,b, Evaluation of fibrotic disease (a; n = 5 (naive) and n = 5 (MA-10)) and KRT8high area (b; n = 5 (naive) and 12 (MA-10)) in aged C57BL/6 mice at 35 d.p.i. after infection with MA-10. c,d, Evaluation of fibrotic disease (c; n = 4 (naive) and n = 3 (MA-10)) and KRT8high area (d; n = 5 (naive) and n = 7 (MA-10)) in aged BALB/c mice at 35 d.p.i. after infection with MA-10. e,f, Evaluation of fibrotic disease (e; n = 3 (naive) and n = 4 (WA-1)) and KRT8high area (f; n = 4 (naive), n = 4 (WA-1)) in aged K18-hACE2 mice at 35 d.p.i. after infection with WA-1. g, Evaluation of fibrotic disease in young (Y) and aged (A) C57BL/6 mice after infection with influenza H1N1 A/PR8/34. n = 3–5 per timepoint. *P = 0.0378 (left) and 0.0412 (right), ***P = 0.0004. h,i, KRT8high transitional (h; *P = 0.0112 (left) and 0.0251 (right)) and CD8+ T cells (i; *P = 0.0190 (left), ***P = 0.0006 (right)) in young and aged lungs after IAV infection. n = 4–11 per timepoint. j, Quantification of AT1 (PDPN+) and AT2 (proSP-C+) cells after SARS-CoV-2 MA-10 and IAV infection in aged C57BL/6 mice. n = 3–4 per timepoint. k, Unbiased analysis of the CD8+ T cell distribution in an aged IAV-infected lung at 60 d.p.i. by QuPath. l, Linear regression of CD8+ T cells and KRT8high area in aged IAV-infected lungs at 60 d.p.i. 5–7 random fields per lung; n = 4. m, The experimental design for CD8+ T cell depletion. The diagram was created using BioRender. nr, Quantification of KRT8high (n; **P = 0.0069) and KRT5+ (o; **P = 0.0085) area (n = 14–19 (control IgG), n = 7 (anti-CD8)); AT1 (PDPN+) area (p; ***P = 0.0009) and AT2 (proSP-C+) cells per mm2 (q; P = 0.0136) (n = 19 (control IgG) and n = 15 (anti-CD8)); and evaluation of lung function (r; compliance (Cst); *P = 0.0172 (left) and 0.0338 (right); resistance of the respiratory system (Rrs); *P = 0.0183 (left) and 0.0147 (right)) in aged IAV-infected mice (60 d.p.i.) treated with anti-CD8 or IgG antibody (n = 3–6 per timepoint). Data are representative of two (al) or three (mr) independent experiments. Statistical analysis was performed using two-tailed unpaired t-tests (af and n–q), ordinary one-way analysis of variance (ANOVA) (g and r) and two-way ANOVA (h and i). Data are mean ± s.e.m.
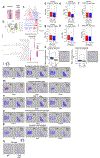
Fig. 3 |
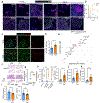
Fig. 3 |. Spatial transcriptomics reveals a CD8+ T cell–macrophage–epithelial progenitor niche that drives dysplastic lung repair.
a,b, Visualization (a) and quantification (b) of various immune and epithelial cell subsets as well as signalling pathways in areas enriched for KRT5+ and KRT8high cells and healthy alveolar epithelium. c, The physical distribution of monocyte-derived macrophages (MDM), alveolar macrophages (AM), KRT5+ and KRT8high areas (Krt) and healthy alveolar epithelium (AE) in aged IAV-infected (60 d.p.i.) mouse lungs. d, Unbiased analysis of the CX3CR1+ macrophage distribution in aged IAV-infected (60 d.p.i.) lungs. e, Quantification of the CX3CR1+ macrophage distribution within KRT8−/low (healthy) and KRT8high (diseased) fields in aged IAV-infected (60 d.p.i.) lungs. 3–5 random fields per lung; n = 4. *P = 0.0429. f, Quantification of CX3CR1+ macrophages in aged IAV-infected (60 d.p.i.) lungs that were treated with control IgG antibody or anti-CD8. n = 4. *P = 0.0380. g, Unbiased analysis of the distribution of CD68+ macrophages in a human PASC-PF lung using QuPath. h, Quantification of CD68+ macrophages within KRT8−/low (healthy) and KRT8high (diseased) fields in human PASC-PF lungs. 5–7 random fields per lung; n = 5. Statistical analysis was performed using two-tailed unpaired t-tests (e, f and h). Data are mean ± s.e.m.
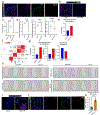
Fig. 4 |
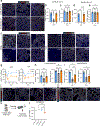
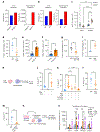
Fig. 4 |. CD8+ T cells promote macrophage-mediated IL-1β release through IFNγ and TNF.
a,b, Gene expression signatures passing the cutoff (ON spots, %) for IL-1R signalling and inflammasome activity in AGERhigh (healthy) and KRT8high (diseased) areas within human PASC-PF lungs (a; n = 3) and AE (alveolar epithelium-rich; healthy) and Krt (KRT8high and KRT5+-rich; diseased) in aged IAV-infected (60 d.p.i.) mouse lungs (b; n = 2). c, Flow cytometry quantification of proIL-1β+ cells in aged naive (n = 5) and IAV-infected (42 d.p.i.; n = 9) mice. ***P = 0.0009 (left) and 0.0004 (right). d, Caspase-1 activity (FLICA) in aged IAV-infected (42 d.p.i.) lungs after control IgG antibody (n = 3) or anti-CD8 (n = 3) treatment. *P = 0.0431. e,f, Quantification of TNF+ (e; ***P = 0.0005) and IFNγ+ (f; *P = 0.0179) CD8+ T cells in human control and PASC-PF lungs. n = 5–6 per group. g, Caspase-1 activity in the lungs of aged IAV-infected mice (42 d.p.i.) after control IgG antibody (n = 5) or anti-IFNγ + anti-TNF (n = 6) treatment. **P = 0.0063. h, Schematic of the ex vivo macrophage (mac.) and CD8+ T cell coculture system. i, Caspase-1 activity. n = 4–5 wells per condition pooled from 2 mice. **P = 0.0017. j,k, Evaluation of IL-1β release by ELISA without ( j; n = 4–10 wells per condition pooled from 4 mice; **P = 0.0075, ***P = 0.0008) or with (k; n = 8 wells per condition pooled from 5 mice; *P = 0.0206, **P = 0.0030) in vitro antibody blockade in the coculture. l,m, Evaluation of IL-1β levels in the BAL fluid of aged IAV-infected mice (42 d.p.i.) after IgG antibody (n = 6) or anti-CD8 (n = 9) treatment (*P = 0.0265) (l), or IgG antibody (n = 5) or anti-IFNγ + anti-TNF neutralizing antibody (n = 6) treatment (m; **P = 0.0090). n, The experimental design for the 2D AT2 culture system. o, Transitional cell marker gene expression after exposure to conditioned medium (CM). n = 2–3 wells per condition pooled from 4 mice. ***P = 0.0007. Data are representative of two (cg, i and o) or three (j, k and m) independent experiments. Statistical analyses were performed using two-tailed unpaired t-tests (dg and i,l,m), ordinary one-way ANOVA (j, k), and two-way ANOVA (c,o). Data are mean ± s.e.m. The diagrams in h and n were created using BioRender.
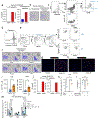
Fig. 5 |
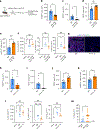
Fig. 5 |. Therapeutic neutralization of IFNγ and TNF or IL-1β activity promotes alveolar regeneration and restores lung function.
a, The experimental design for in vivo IFNγ + TNF neutralization after IAV infection. The diagram was created using BioRender. be, Quantification of the KRT8high area (b; **P = 0.0017), KRT5+ cell area (c; *P = 0.0404), AT1 (PDPN+) area (d; **P = 0.0073) and AT2 (proSP-C+) cells per mm2 (e; **P = 0.0046) in aged IAV-infected mice treated with anti-IFNγ + anti-TNF neutralizing antibody (n = 8) or control IgG antibody (n = 6). f, Evaluation of static compliance (*P = 0.0232 (left) and 0.0217 (right)), resistance of the respiratory system (*P = 0.0142 (left) and 0.0282 (right)) and tissue elastance (H; *P = 0.0417 (left) and 0.0355 (right)) in aged naive (n = 3) and IAV-infected mice treated with anti-IFNγ + anti-TNF neutralizing antibody (n = 9) or control IgG antibody (n = 8). gk, Representative immunofluorescence images (g) and quantification of KRT8high cell area (h; *P = 0.0118), KRT5+ cell area (i; **P = 0.0014), AT1 (PDPN+) cell area (j; **P = 0.0011) and AT2 (proSP-C+) cells per mm2 (k; ***P = 0.0009) in aged IAV-infected lung sections treated with anti-IL-1β (n = 10) or control IgG (n = 9) antibody. l, Evaluation of static compliance (*P = 0.0361 (left) and 0.0468 (right)), resistance of the respiratory system and tissue elastance (*P = 0.0244, **P = 0.0019) in aged naive (n = 3) or IAV-infected mice treated with anti-IL-1β (n = 9) or control IgG (n = 8) antibody. m, Evaluation of the IL-1β levels in the plasma of convalescent individuals recovering from COVID-19 with or without abnormal lung function (n = 25 (normal) and n = 33 (abnormal); *P = 0.0182). LOD, limit of detection; PFT, pulmonary function test. Data are representative of three (bf and hl) independent experiments. Statistical analysis was performed using two-tailed unpaired t-tests (be, hk and m) and one-way ANOVA (f and l). Data are mean ± s.e.m.

Update of

References

    1. Nalbandian A et al. Post-acute COVID-19 syndrome. Nat. Med 27, 601–615 (2021). - PMC - PubMed
    1. Choutka J, Jansari V, Hornig M & Iwasaki A Unexplained post-acute infection syndromes. Nat. Med 28, 911–923 (2022). - PubMed
    1. Narasimhan H, Wu Y, Goplen NP & Sun J Immune determinants of chronic sequelae after respiratory viral infection. Sci. Immunol 7, eabm7996 (2022). - PubMed
    1. Cheon IS et al. Immune signatures underlying post-acute COVID-19 lung sequelae. Sci. Immunol 6, eabk1741 (2021). - PMC - PubMed
    1. Vijayakumar B et al. Immuno-proteomic profiling reveals aberrant immune cell regulation in the airways of individuals with ongoing post-COVID-19 respiratory disease. Immunity 55, 542–556 (2022). - PMC - PubMed

MeSH terms