. 2024 Sep;633(8030):548-553.
doi: 10.1038/s41586-024-07914-y. Epub 2024 Sep 4.

Signatures of magnetism control by flow of angular momentum

Affiliations

Signatures of magnetism control by flow of angular momentum

L Chen et al. Nature. 2024 Sep.

Abstract

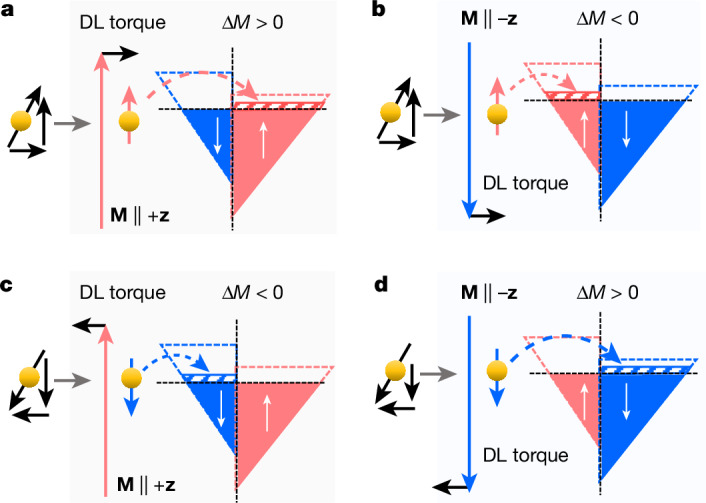
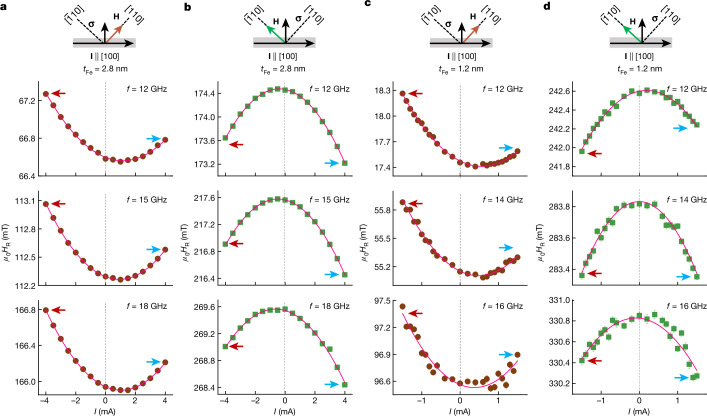
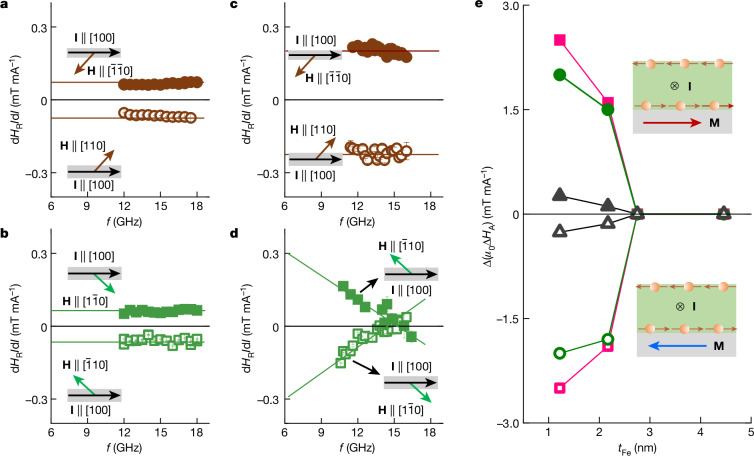
Exploring new strategies to manipulate the order parameter of magnetic materials by electrical means is of great importance not only for advancing our understanding of fundamental magnetism but also for unlocking potential applications. A well-established concept uses gate voltages to control magnetic properties by modulating the carrier population in a capacitor structure1-5. Here we show that, in Pt/Al/Fe/GaAs(001) multilayers, the application of an in-plane charge current in Pt leads to a shift in the ferromagnetic resonance field depending on the microwave frequency when the Fe film is sufficiently thin. The experimental observation is interpreted as a current-induced modification of the magnetocrystalline anisotropy ΔHA of Fe. We show that (1) ΔHA decreases with increasing Fe film thickness and is connected to the damping-like torque; and (2) ΔHA depends not only on the polarity of charge current but also on the magnetization direction, that is, ΔHA has an opposite sign when the magnetization direction is reversed. The symmetry of the modification is consistent with a current-induced spin6-8 and/or orbit9-13 accumulation, which, respectively, act on the spin and/or orbit component of the magnetization. In this study, as Pt is regarded as a typical spin current source6,14, the spin current can play a dominant part. The control of magnetism by a spin current results from the modified exchange splitting of the majority and minority spin bands, providing functionality that was previously unknown and could be useful in advanced spintronic devices.


Conflict of interest statement

The authors declare no competing interests.

Figures

Fig. 1
Fig. 1. Schematic of the microscopic mechanism of manipulation of magnetism by a spin current.
a, The electron spins transmitted into the FM contain both transverse and longitudinal components with respect to M. Owing to exchange coupling, the transverse component dephases and is absorbed by M, which gives rise to the damping-like (DL) SOT and is responsible for changing the direction of M. The longitudinal component of the spin current is on average aligned with M, leading to additional filling of the majority band when M is oriented along the +direction, and an enhancement of the magnitude M as well as an increase in magnetic anisotropies are expected because of the enhanced exchange splitting of the majority and minority spin energy bands. b, When M is aligned along the –direction, the spin-polarized electron enters the minority band, which can lead to a decrease in M as well as a decrease in the magnetic anisotropies because of the reduction in the exchange splitting of the majority and minority spin energy bands. c,d, The same as a and b but the polarization of the spin current is reversed, which is expected to reduce M for M +z (c) and enhance M for M −z (d).
Fig. 2
Fig. 2. Measurement set-up, device and modification of linewidth by charge current.
a, Schematic of the device for the detection of ferromagnetic resonance by time-resolved magneto-optical Kerr microscopy. b, Schematic of the Pt/Al/Fe/GaAs(001) structure. c, Diagram of crystallographic axes with EA and HA along the ⟨110⟩ and 1¯10 orientations. d, FMR spectra for different d.c. currents I measured at f = 12 GHz and φIH = 90o, where φIH is the angle between the magnetic field and the current direction as shown in the inset. The solid lines are the fits. e, FMR linewidth as a function of d.c. current for φIH = ±90o; solid lines are the linear fits from which the modulation amplitude d(ΔH)/dI is obtained. Error bars represent the standard error of the least squares fit of the VKerr(H) traces in df, φIH dependence of d(ΔH)/dI. Error bars represent the standard error of the least squares fit of the I–ΔH traces in e. The solid line is the calculated result when taking into account the in-plane magnetic anisotropies of Fe (see Methods). Source Data
Fig. 3
Fig. 3. Modification of resonance field.
a, I dependence of HR measured at selected frequencies for H along [110] for tFe = 2.8 nm. b, The same as a but for H along [1¯10]. c,d, The same plots as a and b but for tFe = 1.2 nm. Error bars represent the standard error of the least squares fit of the VKerr(H) traces. The red and blue arrows in each panel are marked to show the relative amplitude of HR(−I) and HR(+I). As shown in the top panels, for all the devices, the charge currents are applied along the [100] orientation, and the direction of the spin accumulation σ is along the [010] direction with equal projections onto the [110] and [1¯10] orientations. This experimental trick allows an accurate comparison of the current-induced modification for the [110] and [1¯10] orientations in the same device. Source Data
Fig. 4
Fig. 4. Modification of magnetic anisotropies.
a, The f dependence of dHR/dI for H along the EA ([110] and [1¯1¯0] orientations). b, The f dependence of dHR/dI for H along the HA ([1¯10] and [11¯0] orientations). The results in a and b are obtained for tFe = 2.8 nm. c,d, Same plots as in a and b but for tFe = 1.2 nm. Error bars in each figure (most of them are smaller than the symbol size) represent the standard error of the least squares fit of the IHR traces in Fig. 3. The insets show the relative orientations between the current (I [100], black arrows) and the magnetic field (or magnetization), in which the EA are represented by brown arrows and the HA are represented by green arrows. e, Summary of tFe dependence of ΔHAHA = ΔHK, ΔHU, ΔHB) for opposite magnetization M directions, in which the solid symbols represent the M direction and the open symbols represent the −M direction. The inset shows the relative orientations between the charge current I and M. Source Data
Extended Data Fig. 1
Extended Data Fig. 1. Schematic of the coordinate system used for the analysis.
θH and φH represent the polar and azimuthal angles of external magnetic-field H, and θ and φ are the polar and azimuthal angles of magnetization M. The Fe/GaAs thin films show competing in-plane magnetic anisotropies along <100>, <110> and 1¯10-orientations.
Extended Data Fig. 2
Extended Data Fig. 2. Magnetic anisotropies of Fe/GaAs(001).
a, φH-dependence of the resonance field HR measured for tFe = 1.2 nm at f = 13 GHz. b, HR-dependence of f measured along the hard axis (HA) and easy axis (EA). In a and b, the symbols are the experimental data, and the solid lines are the fits by Eq. (5). c, Inverse Fe thickness tFe1 dependence of HK (circles) as well as M (squares), HU, and HB for Pt/Al/Fe/GaAs (solid circles) and AlOx/Fe/GaAs (open circles). The solids lines are the linear fits.
Extended Data Fig. 3
Extended Data Fig. 3. Damping and mixing conductance of Fe/GaAs(001).
a, φH-dependence of ΔH for tFe = 1.2 nm measured at f = 13 GHz. The solid line is fitted using a damping value of 0.0078. b, f-dependence of ΔH measured along the EA and HA. The solid lines are the fits by a damping value of 0.0063. c, tFe1-dependence of α for Pt/Al/Fe/GaAs samples (solid circles) as well as AlOx/Fe/GaAs samples (open circles). The solid lines are the fits according to spin pumping.
Extended Data Fig. 4
Extended Data Fig. 4. Calculation of the linewidth modulation by LLG equation with conventional SOT term.
a, Time-resolved dynamic magnetization calculated by Eq. (13) for μ0H = 101 mT. By fitting the damped oscillation of the dynamic magnetization (solid line) by Eq. (15), the magnetization relaxation time is obtained. b, Calculated φH-dependence of ΔH by Eq. (7) and Eq. (16) using α = 0.0063. Both methods show identical results. c, Calculated I-dependence of ΔH; the solid line is the linear fit from which dH)/dI is obtained. d, Comparison of the φH-dependence of dH)/dI calculated with in-plane anisotropy (open circles) and without in-plane anisotropies (solid squares).
Extended Data Fig. 5
Extended Data Fig. 5. Angular dependence of linewidth modification and free energy.
a, φH-dependence of the calculated modulation of linewidth dH)/dI. b, φH-dependence of free energy F. Around the HA (shaded areas), the energy barrier vanishes and all the static torques acting on M cancel. In this case, the magnetization has a larger precessional cone angle, leading to an enhanced dH)/dI values.
Extended Data Fig. 6
Extended Data Fig. 6. Frequency dependence of linewidth modification.
a, Frequency dependence of dH)/dI for H along the easy axis ([110]- and [1¯1¯0]-orientations). b, Frequency dependence of dH)/dI for H along the hard axis ([1¯10]- and [11¯0]-orientations). The results in a and b are obtained for tFe = 2.8 nm. c and d are the same results as a and b but for tFe = 1.2 nm. The inset of each figures shows the respective orientation of the charge current and magnetic-field (magnetization). The solid lines in each panel are calculated by Eq. (14) using ξ = 0.06.
Extended Data Fig. 7
Extended Data Fig. 7. dependence of damping-like SOT.
tFe1 tFe1 dependence of |s| extracted from Extended Data Fig. 6, where s=d[d(H)/dI]df. The linear dependence indicates that the damping-like SOT is an interfacial behavior.
Extended Data Fig. 8
Extended Data Fig. 8. Shift of resonance field by magnetic anisotropies.
a, HR-dependence of f calculated for μ0HK = 1350 mT (blue) and μ0HK + μ0ΔHK = 1400 mT (red) along the hard axis. b, Shift of the resonance field ΔHR as a function of frequency, where ΔHR = HR(HK) − HR (HK + ΔHK). c and d are the same results as those in a and b but for the calculation along the easy axis. e-h for ΔHU. i-l for ΔHB. In the calculation, a change of magnetic anisotropy fields of 50 mT is assumed for each case to exaggerate the shift of HR.
Extended Data Fig. 9
Extended Data Fig. 9. Shift of resonance field along easy and hard axes for tFe = 1.2 nm.
a, Shift of the resonance field ΔHR for I = 1 mA for H // M // [110] (easy axis) and H // M // [11¯0] (hard axis). b, Shift of the resonance field for I = 1 mA for H // M // [1¯1¯0] (easy axis) and H // M // [1¯10] (hard axis) for the same sample. The inset in each figure shows the orientation of H with respect to the current. The upper panel of each figure shows the net magnetization, which is parallel to I for a and anti-parallel to I for b.
Extended Data Fig. 10
Extended Data Fig. 10. Shift of resonance field along easy and hard axes for tFe = 2.2 nm.
a, Shift of the resonance field ΔHR for I = 1 mA for H // M // [110] (easy axis) and H // M // [11¯0] (hard axis). b, Shift of the resonance field for I = 1 mA for H // M // [1¯1¯0] (easy axis) and H // M // [1¯10] (hard axis) for the same sample. The inset in each figure shows the orientation of H with respect to the current. The upper panel of each figure shows the net magnetization, which is parallel to I for a and anti-parallel to I for b.

Similar articles

References

    1. Ohno, H. et al. Electric-field control of ferromagnetism. Nature408, 944–946 (2000). - PubMed
    1. Chiba, D. et al. Magnetization vector manipulation by electric fields. Nature455, 515–518 (2008). - PubMed
    1. Weisheit, M. et al. Electric field-induced modification of magnetism in thin-film ferromagnets. Science315, 349–351 (2007). - PubMed
    1. Chen, L., Matsukura, F. & Ohno, H. Electric-field modulation of damping constant in a ferromagnetic semiconductor (Ga,Mn)As. Phys. Rev. Lett.115, 057204 (2015). - PubMed
    1. Matsukura, F., Tokura, Y. & Ohno, H. Control of magnetism by electric fields. Nat. Nanotechnol.10, 209–220 (2015). - PubMed

LinkOut - more resources