. 2024 Oct;25(10):4311-4336.
doi: 10.1038/s44319-024-00236-0. Epub 2024 Sep 4.

An hepatitis B and D virus infection model using human pluripotent stem cell-derived hepatocytes

Affiliations

An hepatitis B and D virus infection model using human pluripotent stem cell-derived hepatocytes

Huanting Chi et al. EMBO Rep. 2024 Oct.

Abstract

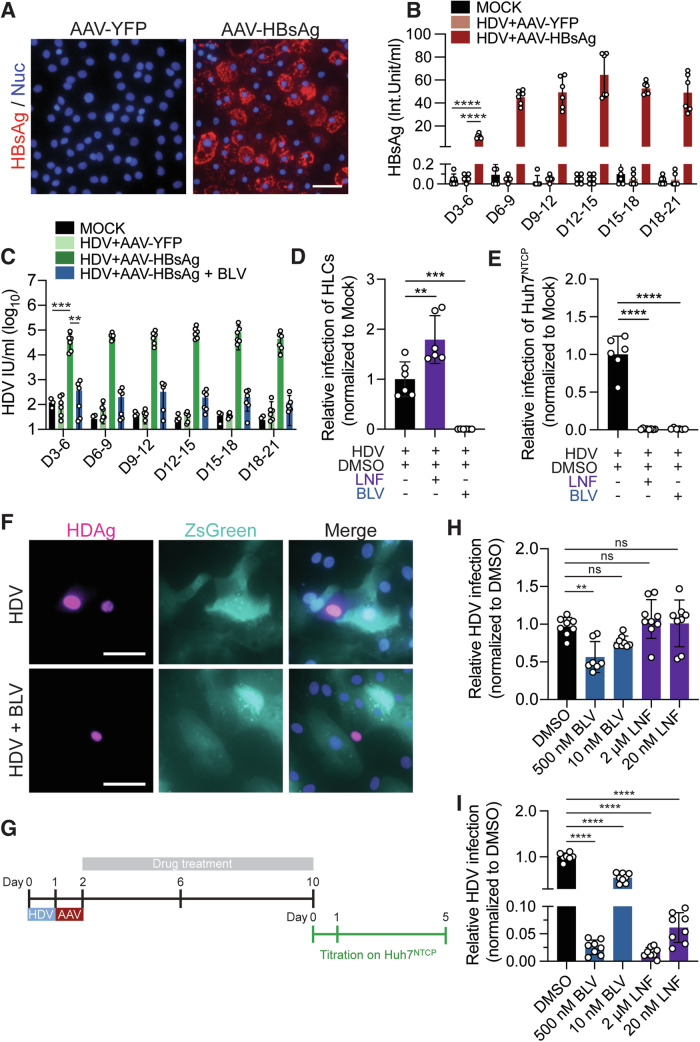
Current culture systems available for studying hepatitis D virus (HDV) are suboptimal. In this study, we demonstrate that hepatocyte-like cells (HLCs) derived from human pluripotent stem cells (hPSCs) are fully permissive to HDV infection across various tested genotypes. When co-infected with the helper hepatitis B virus (HBV) or transduced to express the HBV envelope protein HBsAg, HLCs effectively release infectious progeny virions. We also show that HBsAg-expressing HLCs support the extracellular spread of HDV, thus providing a valuable platform for testing available anti-HDV regimens. By challenging the cells along the differentiation with HDV infection, we have identified CD63 as a potential HDV co-entry factor that was rate-limiting for HDV infection in immature hepatocytes. Given their renewable source and the potential to derive hPSCs from individual patients, we propose HLCs as a promising model for investigating HDV biology. Our findings offer new insights into HDV infection and expand the repertoire of research tools available for the development of therapeutic interventions.

Keywords: Antiviral Treatment; Hepatitis B Virus; Hepatitis D Virus; Hepatocyte-like Cells; Human Pluripotent Stem Cells.


Conflict of interest statement

Stephan Urban is a co-inventor and applicant on patents protecting HBV pre-S1-derived lipopeptides (Myrcludex B/Bulevirtide/Hepcludex). The remaining authors declare no competing interests.

Figures

Figure 1
Figure 1. Hepatocyte-like cells (HLCs) are susceptible to HDV infection in an NTCP-dependent manner.
(A) HDV infection (MOI = 5 Int. Units/cell) of HLCs incubated with or without 500 nM entry inhibitor bulevirtide (BLV) was assessed by immunofluorescence staining (IF) against the HDV antigen (HDAg, green) 5 days post-infection (p.i.). GT: genotype. Scale bar = 200 μm. Images are representative of three independent HLC differentiations. (B, C) HLCs, differentiated (d)HepaRG, and Huh7NTCP cells were infected with HDV (MOI = 5 Int. Units/cell) with or without 500 nM BLV. HDV infection was analyzed by (B) counting HDAg-positive cells using CellProfiler or by (C) quantifying HDV genome copies by RT-qPCR. IU infectious unit. Dashed line: limit of quantification (LOQ). N = 5 biological replicates from two independent experiments. (D, E) HLCs were transduced with or without AAV6 (MOI = 104 viral genomes, vg/cell) encoding for YFP or NTCP two days before HDV infection. (D) NTCP was stained with Atto-MyrB-565 (magenta) two days post transduction. Scale bar = 50 μm. (E) [3H]-taurocholate uptake was determined 2 days post transduction in HLCs ( + YFP or NTCP) or HepG2 cells ( + NTCP) treated or not with 1 μM BLV. CPM[3H]: Tritium scintillation counts per minute. n.a: not assessed. N = 6 biological replicates from two independent HLC differentiations, N = 4 biological replicates (HepG2) from two independent experiments. (F, G) Two days post transduction, mature HLCsYFP/NTCP were infected with HDV (MOI = 5) and analyzed by (F) counting HDAg-positive cells or (G) quantifying HDV genome copies 5 days p.i. N = 6 biological replicates from two independent HLC differentiations. (H) HLCs were infected with the indicated HDV genotype (MOI = 15 Int. Units/cell for GTs 1 T, 1E, 4, 6, 7, 8; MOI = 30 Int. Units/cell for GTs 3 & 5) and 5 days p.i., HDV genome copies were quantified using RT-qPCR. MOIs used were based on different infectious titers of the genotypes obtained on Huh7NTCP cells to reach similar infection efficiency of HLCs. N = 3 biological replicates. (IK) HDV infection (MOI = 5) of HLCs incubated with or without 500 nM BLV was analyzed over time by quantifying (I) HDV genome copies (N = 4 biological replicates from two independent HLC differentiations). (J) HDV genomic RNA (gRNA) and antigenomic RNA (agRNA) (N = 6 biological replicates from two independent HLC differentiations), as well as (K) large (L-HDAg) and small (S-HDAg) HDV antigen expression by Western blot. n.d.: not detected. Data information: In (B, C, EJ) data are presented as mean ± SD. (B, C) Statistical analysis was performed by multiple comparisons of ordinary one-way ANOVA. Statistical significance in (B) was tested between HDV-infected DMSO-treated HLC and dHepaRG (P = 0.1384); between HDV-infected DMSO-treated HLC and Huh7NTCP (P < 0.0001) and between HDV-infected DMSO-treated dHepaRG and Huh7NTCP (P < 0.0001). Statistical significance in (C) was tested between HDV-infected DMSO-treated HLC and dHepaRG (P = 0.9402); between HDV-infected DMSO-treated HLC and Huh7NTCP (P = 0.0022) and between HDV-infected DMSO-treated dHepaRG and Huh7NTCP (P = 0.0037). Statistical significance in (E) was tested between DMSO-treated HLC and HLCYFP (P > 0.9999), between DMSO-treated HLC and HLCNTCP (P = 0.0003), between DMSO-treated HLCYFP and HLCNTCP (P = 0.0002) and between DMSO-treated HepG2 and HepG2NTCP (P < 0.0001) by multiple comparisons of two-way ANOVA. (F, G) Statistical analysis was performed by multiple comparisons of ordinary one-way ANOVA. Statistical significance in (F) was tested between HDV-infected HLCMock and HLCYFP (P = 0.977) and between HDV-infected HLCmock and HLCNTCP (P = 0.0015). Statistical significance in (G) was tested between HDV-infected HLCmock and HLCYFP (P = 0.9713) and between HDV-infected HLCMock and HLCNTCP (P < 0.0001). Statistical significance in (H) was tested among the HLC infected with different HDV genotypes (P < 0.0001) by ordinary one-way ANOVA. Statistical significance in (I) was tested between day 1- and day 3-harvested HDV-infected HLC (P = 0.0464) by an unpaired two-tailed t test. Statistical significance in (J) was tested between day 1- and day 3-harvested HDV-infected HLC (P = 0.0129) by an unpaired two-tailed t test. ****P < 0.0001; ***P < 0.001; **P < 0.01; *P < 0.05, n.s. non-significant. Source data are available online for this figure.
Figure 2
Figure 2. Co-infection of with HBV enables HDV to complete its life cycle in HLCs.
(A) HLCs were co-infected with HBV (MOI = 450 genome copies/cell) and HDV (MOI = 5 Int. Units/cell). Cells were stained against HBV core (HBc, magenta), HDAg (green), and nuclei (DAPI, blue) ten days p.i. Scale bar = 200 μm, scale bar of insets = 40 μm. Images are representative of three independent HLC differentiations. (B) The number of HBc-, HDAg- and double-positive cells were counted using ZEN imaging software to quantify HBV single (pink column), HDV single (green column) and co-infection events (white column) on 10 days p.i. N = 5 biological replicates from two independent HLC differentiations. (C–F) HLCs were infected with either HBV, HDV, or co-infected with HBV and HDV with or without 500 nm BLV and analyzed for (C) HBV cccDNA and (D) HBV total RNA in infected HLC lysates as well as for (E) HBsAg and (F) HBeAg secreted in the supernatant of infected HLCs (IU international units). n.d.: not detected. N = 8 biological replicates from two independent HLC differentiations. (G) The supernatant from HBV/HDV co- or HDV mono-infected HLCs collected on day ten p.i. was diluted 1:5 to infect Huh7NTCP cells with or without 500 nM BLV. (H) Infected Huh7NTCP cells were fixed, stained for HDAg, and analyzed using CellProfiler. N = 4 biological replicates from two independent experiments. Data information: In (BF, H), data are presented as mean ± SD and statistical analysis was performed by multiple comparisons of ordinary one-way ANOVA. Statistical significance in (B) was tested between HBV mono- and HBV/HDV co-infected HLC (P = 0.0493) and between HDV mono- and HBV/HDV co-infected HLC (P = 0.5276). Statistical significance in (C) was tested between HBV mono- and BLV-treated HBV/HDV co-infected HLC (P < 0.0001) and between HBV/HDV co- and BLV-treated HBV/HDV co-infected HLC (P = 0.0002). Statistical significance in (D) was tested between HBV mono- and BLV-treated HBV/HDV co-infected HLC (P < 0.0001) and between HBV/HDV co- and BLV-treated HBV/HDV co-infected HLC (P < 0.0001). Statistical significance in (E) was tested between HBV mono- and BLV-treated HBV/HDV co-infected HLC (P < 0.0001) and between HBV/HDV co- and BLV-treated HBV/HDV co-infected HLC (P < 0.0001). Statistical significance in (F) was tested between HBV mono- and BLV-treated HBV/HDV co-infected HLC (P < 0.0001) and between HBV/HDV co- and BLV-treated HBV/HDV co-infected HLC (P < 0.0001). Statistical significance in (H) was tested between HBV/HDV co- and BLV-treated HBV/HDV co-infected HLC (P = 0.0007), between HBV/HDV co- and HDV mono-infected HLC (P = 0.0009) and between BLV-treated HBV/HDV co- and HDV mono-infected HLC (P = 0.9975). ****P < 0.0001; ***P < 0.001; *P < 0.05, n.s. non-significant. Source data are available online for this figure.
Figure 3
Figure 3. AAV transduction of HLCs with HBV surface antigens enables HDV extracellular spread and drug evaluation studies.
(A) HLCs were infected with HDV (MOI = 5 Int. Units/cell) and the next day transduced with AAV6-YFP or AAV6-HBsAg. SN: supernatant. Nine days post transduction, HLCs were stained for HBsAg (red) and nuclei (blue). Images are representative of two independent differentiations. Scale bars = 50 μm. (B) HBsAg was quantified in the supernatant by ELISA collected at the end of indicated time periods. Int. Unit international unit. N = 6 biological replicates from two independent HLC differentiations. (C) Progeny HDV from HLCs harvested at the indicated time points was diluted 1:5 and used to infect Huh7NTCP cells with or without 500 nM BLV. Infected Huh7NTCP cells were fixed and stained for HDAg to quantify HDV infections. IU infectious unit. N = 6 biological replicates from 2 independent experiments. (D) HLCs were infected with HDV (MOI = 5 Int. Units/cell), transduced with AAV6-HBsAg and incubated with or without 500 nM BLV (between D0-D1 p.i.) or 2 μM Lonafarnib (LNF; between D0-D5 p.i.). HDV infection was quantified by counting HDAg-positive HLCs five days p.i. N = 6 biological replicates from two independent HLC differentiations. (E) The supernatant from these HLCs was diluted 1:5 to infect Huh7NTCP cells which were analyzed for HDV infection by HDAg staining five days p.i. N = biological replicates. N = 6 biological replicates from two independent HLC differentiations. (F) Wild-type HLCs were infected with HDV (MOI = 5 Int. Units/cell) and the next day transduced with AAV6-HBsAg. Two days post-infection, they were dissociated and co-cultured with ZsGreen expressing HLCs in the presence or absence of BLV. Eight days later, cells were fixed, stained, and imaged for HDAg (magenta), ZsGreen (cyan) and nuclei (DAPI, blue). Scale bar = 50 μm. (G) Experimental setup. HLCs were infected with HDV (MOI = 5 Int. Units/cell) and the next day transduced with AAV6-HBsAg. After removal of the inoculum on day 2 p.i., HLCs were incubated with drugs, which were replenished every four days. Ten days p.i., HLCs were fixed to analyze HDV infections and their culture supernatant was harvested for titration of HDV progenies on Huh7NTCP cells. (H) Relative HDV infection events normalized to vehicle DMSO-treated cells were quantified by counting HDAg-positive HLCs 10 days p.i. N = 8 biological replicates from three independent HLC differentiations. (I) The supernatant from HLCs was diluted 1:5 to infect Huh7NTCP cells, which were then analyzed for HDV infection by HDAg staining 5 days p.i. N = biological replicates. N = 8 biological replicates from three independent HLC differentiations. Data information: In (BE, H, I) data are presented as mean ± SD and statistical analysis was performed by multiple comparisons of ordinary one-way ANOVA. Statistical significance in (B) was tested between HLCMock and HLCHBsAg (days 3–6; P < 0.0001) and between HLCYFP and HLCHBsAg (days 3–6; P < 0.0001). Statistical significance in (C) was tested between HLCYFP and HLCHBsAg (days 3–6; P = 0.0010) and between HLCHBsAg and BLV-treated HLCHBsAg (days 3–6; P = 0.0010). Statistical significance in (D) was tested between DMSO- and LNF-treated HDV-infected HLC (P = 0.0021) and between DMSO- and BLV-treated HDV-infected HLC (P = 0.0003). Statistical significance in (E) was tested between DMSO- and LNF-treated HDV-infected HLC (P < 0.0001) and between DMSO- and BLV-treated HDV-infected HLC (P < 0.0001). Statistical significance in (H) was tested between DMSO- and 500 nM BLV-treated HDV-infected HLC (P = 0.0071), between DMSO- and 10 nM BLV-treated HDV-infected HLC (P = 0.3508), between DMSO- and 2 μM LNF-treated HDV-infected HLC (P = 0.8643) and between DMSO- and 20 nM LNF-treated HDV-infected HLC (P = 0.9944). Statistical significance in (I) was tested between DMSO- and 500 nM BLV-treated HDV-infected HLC (P < 0.0001), between DMSO- and 10 nM BLV-treated HDV-infected HLC (P < 0.0001), between DMSO- and 2 μM LNF-treated HDV-infected HLC (P < 0.0001) and between DMSO- and 20 nM LNF-treated HDV-infected HLC (P < 0.0001). ****P < 0.0001; ***P < 0.001; **P < 0.01, n.s. non-significant. Source data are available online for this figure.
Figure 4
Figure 4. HDV susceptibility along stem cell differentiation to hepatocyte-like cells.
(A) Immunofluorescent images of cells stained against the nuclei (DAPI, blue) and with antibodies against alphafetoprotein (AFP, red), albumin (ALB, red) or Atto-MyrB488 (NTCP, green) at the following stages during HLC differentiation: hPSCs, definitive endoderm, hepatic specification, immature, and mature hepatocyte-like cells. Images are representative of two independent HLC differentiations. Scale bar = 100 μm. (B) Cells were harvested for analyzing ALB, AFP, NTCP expression using RT-qPCR at the indicated day of the differentiation protocol. Results represent the mean ± SD of N = 3 biological replicates. (C, D) Cells were infected with HDV at the indicated day of the differentiation protocol and harvested five days p.i. HDV infection was analyzed by quantifying (C) HDV genome copies and (D) HDAg-positive cells using CellProfiler. Dashed line: LOQ. N = 6 biological replicates from two independent HLC differentiations. Data information: In (BD), data are presented as mean ± SD and statistical analysis was performed by multiple comparisons of ordinary one-way ANOVA. Statistical significance in (B) was tested between day 17- and day 19-harvested hepatocytes (ALB; P < 0.0001). Statistical significance in (C) was tested between day 9- and day 11- HDV-infected hepatocytes (P = 0.9995) and between day 17- and day 19- HDV-infected hepatocytes (P = 0.006). Statistical significance in (D) was tested between day 9- and day 11- HDV-infected hepatocytes (P = 0.4229) and between day 17- and day 19- HDV-infected hepatocytes (P < 0.0001). ****P < 0.0001; **P < 0.01; n.s. non-significant. Source data are available online for this figure.
Figure 5
Figure 5. siRNA screen reveals CD63 to be a potential co-factor of HDV cell entry which could be rate-limiting for infection of immature hepatocytes.
(A) An siRNA screen of potential HDV host factors. Huh7NTCP cells were transfected with 50 nM on-target pool siRNAs directed against indicated genes and 72 h later infected with HDV (MOI = 1 Int. Units/cell). Relative HDV infection was normalized to non-target (nt) siRNA transfection and quantified by counting HDAg-positive cells five days p.i. N = 4 biological replicates from two independent experiments. (B, C) Four genes were selected and confirmed by separate siRNA transfection into Huh7NTCP cells and analyzed for (B) HDV infection after siRNA transfection and (C) cell toxicity. N = 6 biological replicates from two independent experiments. (D) Huh7NTCP cells were infected with HDV (MOI = 1 Int. Units/cell) and 24 h later transfected with nt- and CD63-siRNAs. HDV infections were quantified by counting HDAg-positive cells five days p.i. N = 6 biological replicates from three independent HLC differentiations. (E) HLCs were harvested for analyzing CD63 expression using RT-qPCR at the indicated day of the differentiation protocol. N = 3 biological replicates. (F) Western blot analysis of Huh7NTCP cells as control and HLC cell lysates harvested at indicated day of the differentiation protocol, for CD63 and β-actin (act) expression using respective antibodies. (G) Mature HLCs were infected with HDV, fixed 5 days post-infection, and stained for CD63 (magenta), HDAg (green), and the nucleus (blue). Images were taken on the Airyscan confocal microscope. Shown are ×40 tile image stacks of maximum projections with the two HLC populations. Scale bar = 50 μm. (H) Cells at indicated day of the differentiation protocol were transduced with AAV6-YFP or AAV6-CD63 and two days later, infected with HDV. Relative HDV infections were quantified by counting HDAg-positive cells five days p.i. N = 9 biological replicates from three independent HLC differentiations. Data information: In (AE, H) data are presented as mean ± SD. In (AC, E) statistical analysis was performed by multiple comparisons of ordinary one-way ANOVA. Statistical significance in (A) was tested by comparing each sample against the non-target knockdown control (PHDAg< 0.0001; PPVR < 0.0001; PNTCP = 0.0007; PITGB1 = 0.0008; PCD63 = 0.0036; PITGA2 = 0.0042). Statistical significance in (B) was tested by comparing each sample against the non-target knockdown control (PCD63 < 0.0001; PITGA2 < 0.0001; PPVR < 0.0001; PITGB1 < 0.0001). Statistical significance in (C) was tested by comparing each sample against the non-target knockdown control (PCD63 = 0.9908; PITGA2 < 0.0001; PPVR < 0.0001; PITGB1 = 0.9908). Statistical significance in (D) was tested between HDV-infected non-target and CD63 knockdown Huh7NTCP (P = 0.0657) by unpaired two-tailed t test. Statistical significance in (E) was tested between day 17- and day 19-harvested hepatocytes (P = 0.0303). Statistical significance in (H) was tested between HDV-infected hepatocyteYFP and hepatocyteCD63 at different time points, respectively, by multiple comparisons of two-way ANOVA (Pday10 = 0.9962; Pday15 = 0.0008; Pday19 = 0.1345). ****P < 0.0001; **P < 0.01; n.s. non-significant. Source data are available online for this figure.
Figure EV1
Figure EV1. HLCs are susceptible for HDV infection.
(A, B) HLCs were infected with HDV at different MOIs (0.5, 1, 2.5, or 5 Int. Units/cell) and HDV antigen levels were analyzed (HDAg, red) 5 days p.i. Scale bar = 100 μm. HDAg-positive cells were counted using CellProfiler. N = 6 biological replicates from two independent HLC differentiations. (C) HLCs, differentiated HepaRG, and Huh7NTCP cells were infected with HDV (MOI = 5 Int. Units/cell). HDAg-positive cells were counted using CellProfiler. HDV infection efficiency is shown either by infectious unit per mL (IU/mL) or HDV infection percentage N = 5 biological replicates from two independent experiments. (D) HLCs were transduced with or without AAV6-YFP or AAV6-NTCP. Two days post transduction, cell lysates were harvested and analyzed by Western blot analysis. (E) HLCs were infected with the indicated HDV genotype and 5 days p.i., cells were harvested for HDAg staining. Scale bar = 100 μm. (F) HLCs were infected with HDV (MOI = 5 Int. Units/cell) and harvested on indicated days p.i. HDV replication was analyzed by quantifying HDV genome copies in infected HLC lysates using RT-qPCR. Dashed line = LOQ. N = 4 biological replicates. (G) Huh7NTCP cells were infected with HDV (MOI = 5 Units/cell). RNA lysates were harvested on day 1, 3, 5, 7, 9 p.i. HDV copy numbers of genomes and antigenomes were determined by strand-specific qRT-PCR, respectively. N = 7 biological replicates from two independent experiments. (H) HLCs, Huh7NTCP, and differentiated HepaRG cells were uninfected or infected with HDV (MOI = 1 5 Units/cell).) or treated with BLV (500 nM). Cellular protein lysates were collected on day 1, 3, 5, 10, 15 p.i. and levels of L- and S-HDAg were analyzed by Western blot. Data information: In (B, C, F and G) data are presented as mean ± SD. Statistical significance in (B) was tested among HDV-infected HLC at different MOIs (P < 0.0001) by ordinary one-way ANOVA. Statistical significance in (C) was tested between HDV-infected HLC and dHepaRG (PIU/mL = 0.1384; P% = 0.0875) and between HDV-infected HLC and Huh7NTCP (PIU/mL < 0.0001; P% < 0.0001) by multiple comparisons of ordinary one-way ANOVA. Statistical significance in (F) was tested between day 10- and day 15- harvested HDV-infected HLC (P < 0.0001) by multiple comparisons of ordinary one-way ANOVA. Statistical significance in (G) was tested between day 1- and day 3-harvested HDV-infected Huh7NTCP (PgRNA< 0.0001; PagRNA < 0.0001) by an unpaired two-tailed t test. ****P < 0.0001, n.s.: non-significant.
Figure EV2
Figure EV2. HDV susceptibility along D17 to D19 of the HLC differentiation protocol.
(A) Undifferentiated WA09 cells were transfected with or without pJC126. Cells were harvested and assessed by immunofluorescence staining against the HDAg (magenta) and L-HDAg (green) 8 days post transfection. Scale bar = 50 μm. (B, C) HLCs were infected with HDV (MOI = 5) at the indicated day of the differentiation protocol and harvested for analyzing HDV infection efficiency by quantifying HDV-positive cells through CellProfiler (B) or detecting HDV total RNA copies through RT-qPCR (C) on 5 days p.i. N = 4 biological replicates from two independent HLC differentiations. Data information: In (B, C) data are presented as mean ± SD and statistical analysis was performed by multiple comparisons of ordinary one-way ANOVA. Statistical significance in (B) was tested between day 17- and day 18-harvested HDV-infected HLC (P = 0.0004). Statistical significance in (C) was tested between day 17- and day 18-harvested HDV-infected HLC (P = 0.002). ***P < 0.001; **P < 0.01.
Figure EV3
Figure EV3. Gene expression along HLC differentiation.
Total RNA was extracted from HLCs at either day 17 or 18 during the differentiation protocol and subjected to whole-transcriptome expression profiling and gene ontology (GO) term enrichment analysis. (A) GO term enrichment analysis of biological pathways for up- and downregulated genes between HLCs at day 17 and 18. Differentially expressed genes (P value < 0.05) were significantly enriched in this GO term. Statistical analysis was performed using the Kolmogorov–Smirnov test. (BD) Heatmap of Z score-normalized counts per million (CPM) values for (B) hepatocyte markers, and (C) virus entry factors. N = 2 biological replicates. (D) Cellular protein lysates of mature HLCs were collected and expression levels of previously described HBV/HDV entry factors and cofactors were analyzed by western blot.
Figure EV4
Figure EV4. Knockdown of CD63 does not alter membranous NTCP expression.
(A) Four siRNAs targeting CD63, ITGA2, PVR, and ITGB1 were delivered into Huh7NTCP cells and downregulation was confirmed by Western blot analysis on cell lysates harvested 3 days post transfection. Untransfected (wt) and non-target (nt) siRNAs were used as controls. (B) Huh7NTCP cells were transfected with 50 nM siRNA targeting CD63. 3 days later, NTCP protein stained with Atto-MyrB-488 (green), CD63 and EGFR stained with specific antibody were imaged by confocal microscopy. Scale bar = 50 μm. (C) Left: Mature HLCs were infected with HDV, fixed 5 days p.i., and stained for CD63 (magenta), HDAg (green), and the nucleus (blue). Images were taken on the Airyscan confocal microscope. Left: Shown is a 40x tile image with the two HLC populations (reused from Fig. 5G, merge). Scale bar = 50 μm. Middle & Right: Zoom in image of the region of interest. Single z-slice and orthogonal xz and yz views of less (middle) and high (right) confluent HLCs. Scale bar = 5 μm. (D) Endogenous and ectopic CD63 expression at the different hepatocyte differentiation stages. Cells were transduced with AAV6s two days before harvesting them at indicated day of the differentiation protocol. Lysates were analyzed by Western blot using specific anti-CD63 and β-actin antibodies.
Figure EV5
Figure EV5. Transcriptional and protein levels of host factors in high and less confluent HLC populations.
(A) Cellular lysates were harvested from high and less confluent HLC populations. Differentiation factor ALB, entry factors (NTCP, EGFR, SDC2, GPC5, LAMP1, SCARB1), HDV genome replication factor (POLR2A, ADAR1, MOV10) and other virus–host interaction factors (CD63) were analyzed using RT-qPCR. N = 6 biological replicates from two independent HLC differentiations. (B) Selected factors in (A) were immunostained in HLCs (shown in red). Images were taken on the Airyscan confocal microscope. Shown are 40× tile image with the two HLC populations. Scale bar = 50 μm. Highly confluent HLCs are indicated by the white dashed line. Data information: In (A) data are presented as mean ± SD and statistical analysis was performed by unpaired two-tailed t test. Statistical significance was tested between high and less confluent HLC (PALB < 0.0001; PNTCP < 0.0001; PEGFR = 0.0950; PSDC2 < 0.0001; PGPC5 = 0.0012; PLAMP1 = 0.0738; PSCARB1 < 0.0001; PPOLR2a = 0.0018; PADAR1 = 0.08617; PMOV10 = 0.6186; PALB = 0.0117). ****P < 0.0001; **P < 0.01; *P < 0.05; n.s.: non-significant.

References

    1. Alexa A, Rahnenfuhrer J (2016) topGO: enrichment analysis for Gene Ontology. R Packag. version 2.26.0. R Package version 2260
    1. Alfaiate D, Dény P, Durantel D (2015) Hepatitis delta virus: from biological and medical aspects to current and investigational therapeutic options. Antivir Res 122:112–129 - PubMed
    1. Allweiss L, Testoni B, Yu M, Lucifora J, Ko C, Qu B, Lütgehetmann M, Guo H, Urban S, Fletcher SP (2023) Quantification of the hepatitis B virus cccDNA: evidence-based guidelines for monitoring the key obstacle of HBV cure. Gut 72:972–983 - PMC - PubMed
    1. Appelman MD, Wettengel JM, Protzer U, Oude Elferink RPJ, van de Graaf SFJ (2021) Molecular regulation of the hepatic bile acid uptake transporter and HBV entry receptor NTCP. Biochimica et Biophysica Acta - Mol Cell Biol Lipids 1866:158960 - PubMed
    1. Börner K, Kienle E, Huang LY, Weinmann J, Sacher A, Bayer P, Stüllein C, Fakhiri J, Zimmermann L, Westhaus A et al (2020) Pre-arrayed Pan-AAV peptide display libraries for rapid single-round screening. Mol Ther 28:1016–1032 - PMC - PubMed

MeSH terms

Substances