. 2024 Oct 3;31(10):1447-1464.e6.
doi: 10.1016/j.stem.2024.08.006. Epub 2024 Sep 3.

Inflammation-induced epigenetic imprinting regulates intestinal stem cells

Affiliations

Inflammation-induced epigenetic imprinting regulates intestinal stem cells

Dongchang Zhao et al. Cell Stem Cell. .

Abstract

It remains unknown whether and how intestinal stem cells (ISCs) adapt to inflammatory exposure and whether the adaptation leaves scars that will affect their subsequent regeneration. We investigated the consequences of inflammation on Lgr5+ ISCs in well-defined clinically relevant models of acute gastrointestinal graft-versus-host disease (GI GVHD). Utilizing single-cell transcriptomics, as well as organoid, metabolic, epigenomic, and in vivo models, we found that Lgr5+ ISCs undergo metabolic changes that lead to the accumulation of succinate, which reprograms their epigenome. These changes reduced the ability of ISCs to differentiate and regenerate ex vivo in serial organoid cultures and also in vivo following serial transplantation. Furthermore, ISCs demonstrated a reduced capacity for in vivo regeneration despite resolution of the initial inflammatory exposure, demonstrating the persistence of the maladaptive impact induced by the inflammatory encounter. Thus, inflammation imprints the epigenome of ISCs in a manner that persists and affects their sensitivity to adapt to future stress or challenges.

Keywords: allogeneic hematopoietic stem cell transplantation; epigenetics; epithelial cell memory; graft-versus-host disease; intestinal stem cells; intestine organoids; metabolism; oxidative phosphorylation.


Conflict of interest statement

Declaration of interests The authors declare no competing interests.

Figures

Figure 1.
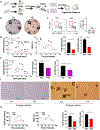
Figure 1.. Single cell transcriptomics of Lgr5+ISC metabolic on GI GVHD.
(A) UMAP plots of distinct clusters with scRNA-seq in experimental conditions; (B) UMAP plots of Igr5 gene expression in clustered cells; (C) Violin plots of Igr5 gene expression in CBC; (D) Heatmap of top differential genes from Lgr5+ISCs cluster; (E) Gene ontology enrichment analysis of cellular metabolic process in Lgr5+ISCs cluster; (F-Q) Representative differentially expressed genes in Lgr5+ISCs cluster. n = 2 independent biological samples each group. *, p<0.05; **, p<0.01. See also Figure S1.
Figure 2.
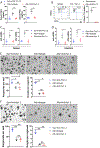
Figure 2.. Lgr5+ISC-derived organoids from allo-HCT recipients demonstrate reduced OXPHOS.
(A) Schematic of intestinal organoids culture and Seahorse Assay design. (B) Representative organoid images with 50 crypts per well, Scale bar, 500 μm; (C) Donor T cells expression in dissociated single cells from primary organoids in (B); (D) OCR, Percentage change of OCR from basal conditions, Basal OCR, and OCR/ECAR ratio on organoids with 50 crypts per well. n = 4-6 Syn (B6→B6), 4-6 Allo (BALB/c→B6) mice. (E) OCR, Basal OCR, and OCR/ECAR ratio on organoids with 50 crypts per well, n = 4 Syn (B6→B6), 4 Allo (C3H.SW→B6) mice. (F) Representative organoid images with 1000 Lgr5+ISCs per well, Scale bar, 200 μm; (G) OCR, Percentage change of OCR from basal conditions, Basal OCR, and OCR/ECAR ratio on organoids from sorted Lgr5+ISCs culture. *, p<0.05; **, p<0.01; NS, not significant. See also Figures S1G and S2.
Figure 3.
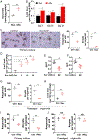
Figure 3.. Lgr5+ISCs show SDHA deficiency in GI GVHD.
(A, B) SDHA protein quantification in Lgr5+ISCs or ISCs in small intestinal crypts from Allo (BALB/c→B6-GFP-Lgr5) and Syn (B6→B6-GFP-Lgr5) after BMT, n = 4 mice each group, black line represents Syn, red line represents Allo, filed gray as negative control. (C, D) SDHA protein quantification in Lgr5+ISCs or ISCs in small intestinal crypts from SdhaΔ/ISC mice treated with tamoxifen (KO) or diluent (WT). n = 3 diluent, 4 tamoxifen treated mice, black line represents WT, red line represents KO, filed gray as negative control. (E-I) SdhaΔ/ISC mice treated with tamoxifen (KO) or diluent (WT) and received BMT from either syngeneic B6 or allogeneic BALB/c donors. (E) Survival, n = 5 WT-Syn, 8 WT-Allo, 5 KO-Syn, and 8 KO-Allo mice; (F) Lgr5+ISCs quantification in small intestine crypts from Allo-WT or Allo-KO seven days after BMT, n = 5 mice each group; (G) Representative organoid images with 100 crypts per well, Scale bar, 200 μm; (H) quantification of organoids formation; (I) OCR, Percentage change of OCR from basal conditions on organoids, n = 4 mice each group. *, p<0.05; **, p<0.01; NS, not significant. See also Figures S3.
Figure 4.
Figure 4.. Succinate accumulation regulates ISC function and DNA methylation.
(A) Quantification of succinate level in organoids from Allo (BALB/c→B6) and Syn (B6→B6) in Figure 2B. n = 4 mice, each group. (B) Quantification of global DNA methylation (5-mC) in organoids from Allo (BALB/c→B6) and Syn (B6→B6) on day 7, 10, and 21 after BMT. n=3-4 mice each group. See also Figure S2A,C,D. (C) Representative organoid images and quantification of organoids formation with or without dimethyl succinate treatment. n=3-4 mice each group. Scale bar, 200 μm, Ctrl, diluent control; Suc, 20mM of dimethyl succinate; (D) Quantification of 5-mC in organoids; (E and F) Gene expression in organoids. (G) Quantification of passaged organoids formation from (C) without succinate treatment, and (H) Quantification of 5-mC in organoids. (I) Quantification of organoids formation with recombinant mouse interferon gamma (IFNγ) or diluent and (J) their passaged organoids formation without IFNγ treatment. *, p<0.05; **, p<0.01; NS, not significant. See also Figures S4.
Figure 5.
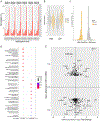
Figure 5.. ISCs methylation is altered in context of GI GVHD.
(A) Plots of percentage of global methylation in intestine organoids from Allo (BALB/c→B6) and Syn (B6→B6) in Figure 2B, n= 3 biological independent samples each group; (B) Violin plots of differentially methylated regions (DMRs) associated genes; (C) Plots of gene counts in DMRs associated regions; (D) Top ten of cellular functional pathways in hypermethylated- or hypomethylated-region associated genes with gene ontology (GO) enrichment analysis; (E) Integrated analysis of DMRs associated genes and mRNA expression in Lgr5+ISCs. See also Figures 1 and S1.
Figure 6.
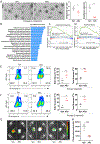
Figure 6.. Inflammatory effects are persistent ex vivo and in vivo.
(A) Representative organoid images and quantification of passage 2 organoid formation from primary organoid serial culture from Allo (BALB/c→B6) and Syn (B6→B6) in Figure 2B, Scale bar, 200 μm, n = 4 mice each group. (B) Lgr5+ISCs pathway enrichment analysis for genes with high fold changes of chromatin accessibility peaks via Genomic Regions Enrichment of Annotations Tool (GREAT) in Allo (BALB/c→B6) compared with Syn (B6→B6) after BMT. (C) inflammation response and (D) G2-M checkpoint gene-set analysis in Lgr5+ISCs from Allo (BALB/c→B6) vs Syn (B6→B6) BMT. (E) Quantification of EdU and Annexin V expression from primary organoids, n = 3 mice each group; (F) Quantification of EdU and Annexin V expression from passage 2 organoids, n = 3 mice each group. (G, H) Quantification of primary organoids growth in naïve secondary recipients with bioluminescence image. n = 3 independent biological samples of organoids from syngeneic or allogeneic recipients. *, p<0.05; **, p<0.01. See also Figures 2, S1, S5, and S6.
Figure 7.
Figure 7.. GVHD-induced inflammation reduces ISC dependent repair from subsequent acute in vivo insults.
(A-E) Mitigation of GVHD with anti-Thy1.2. Twenty-eight days post anti-Thy1.2 antibody or control antibody treatment, Allo (BALB/c→B6) or Syn (B6→B6) mice were euthanized and analyzed for serum level of TNFα and IFNγ (A), allogeneic donor T cells in spleen (B), mRNA level of TNFα and IFNγ in spleen (C) or small intestine tissues (D), and intestine organoids formation (E), n = 3 mice each group, Scale bar, 750 μm. (F) Representative organoid images and quantification of intestine organoid formation from above Allo or Syn mice treated with anti-Thy1.2 and following secondary irradiation, n = 3 mice each group, Scale bar, 750 μm. *, p<0.05; **, p<0.01; NS, not significant. See also Figure S7.

References

    1. Naik S, Larsen SB, Gomez NC, Alaverdyan K, Sendoel A, Yuan S, Polak L, Kulukian A, Chai S, and Fuchs E (2017). Inflammatory memory sensitizes skin epithelial stem cells to tissue damage. Nature 550, 475–480. 10.1038/nature24271. - DOI - PMC - PubMed
    1. Gonzales KAU, Polak L, Matos I, Tierney MT, Gola A, Wong E, Infarinato NR, Nikolova M, Luo S, Liu S, et al. (2021). Stem cells expand potency and alter tissue fitness by accumulating diverse epigenetic memories. Science 374, eabh2444. 10.1126/science.abh2444. - DOI - PMC - PubMed
    1. Lim AI, McFadden T, Link VM, Han SJ, Karlsson RM, Stacy A, Farley TK, Lima-Junior DS, Harrison OJ, Desai JV, et al. (2021). Prenatal maternal infection promotes tissue-specific immunity and inflammation in offspring. Science 373. 10.1126/science.abf3002. - DOI - PubMed
    1. Ordovas-Montanes J, Dwyer DF, Nyquist SK, Buchheit KM, Vukovic M, Deb C, Wadsworth MH 2nd, Hughes TK, Kazer SW, Yoshimoto E, et al. (2018). Allergic inflammatory memory in human respiratory epithelial progenitor cells. Nature 560, 649–654. 10.1038/s41586-018-0449-8. - DOI - PMC - PubMed
    1. Clevers H. (2013). The intestinal crypt, a prototype stem cell compartment. Cell 154, 274–284. 10.1016/j.cell.2013.07.004. - DOI - PubMed

Substances