. 2024 Sep 4;24(1):829.
doi: 10.1186/s12870-024-05548-w.

Identification and functional characterization of bidirectional gene pairs and their intergenic regions in cotton

Affiliations

Identification and functional characterization of bidirectional gene pairs and their intergenic regions in cotton

Jiangtao Yang et al. BMC Plant Biol. .

Abstract

Background: In research to improve the quality of transgenic crops, it is often necessary to introduce multiple functionally related genes into recipient plants simultaneously to improve crop genetic traits effectively. Compared with unidirectional promoters, bidirectional promoters simultaneously regulate the expression of multiple genes and improve the efficiency of biotechnology. Therefore, in this study, bidirectional gene pairs were systematically analyzed in Gossypium hirsutum TM-1, and the structure, function and evolutionary relationships of the bidirectional genes were analyzed. The endogenous bidirectional promoters of cotton were mined, and their specific regulatory elements and biological functions were explored to provide useful promoter resources and a theoretical basis for cultivating new cotton germplasms with excellent fiber quality.

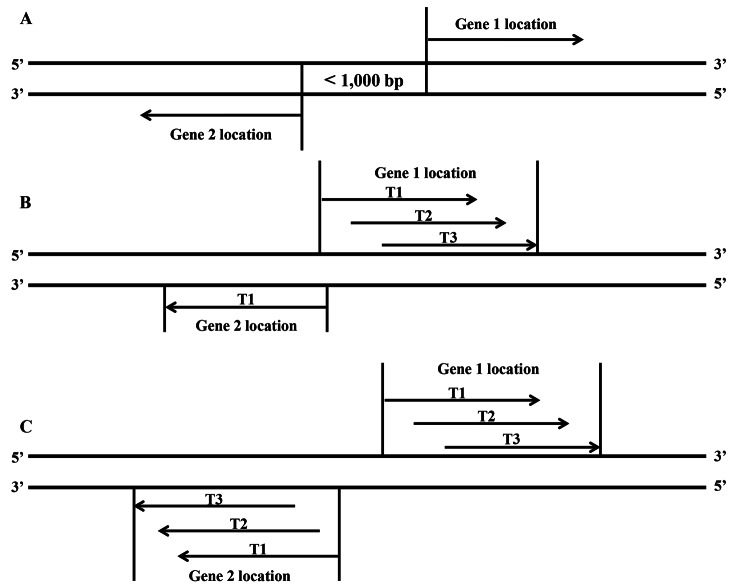
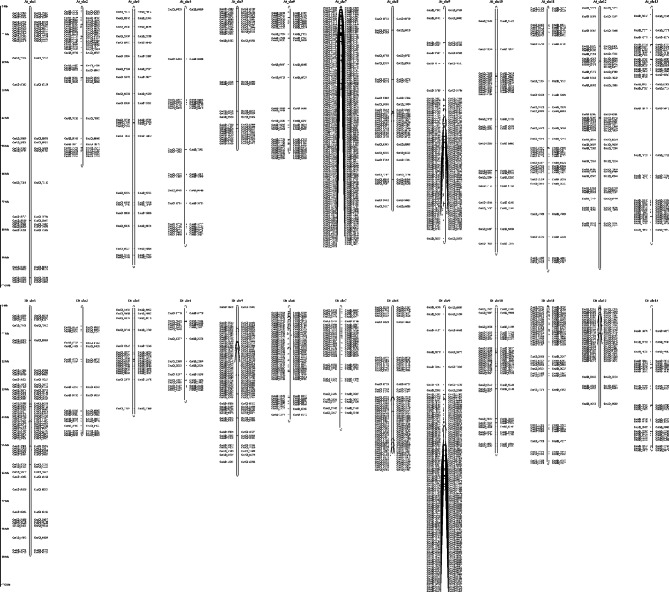
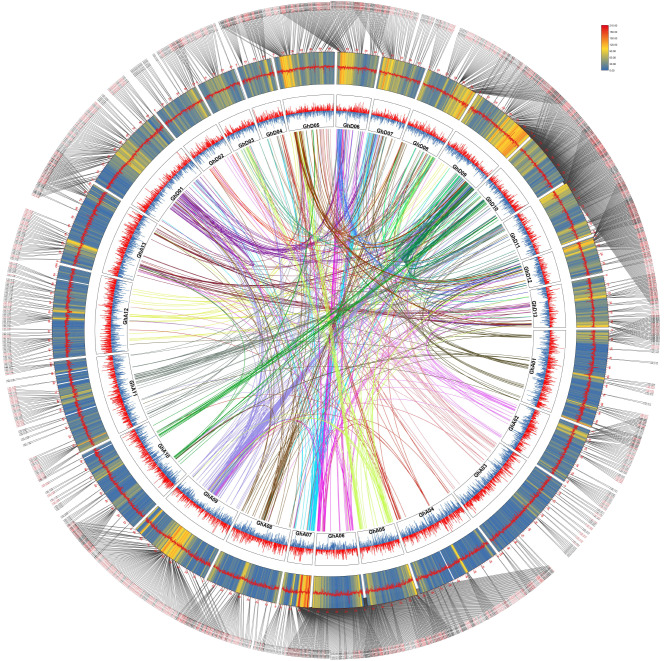
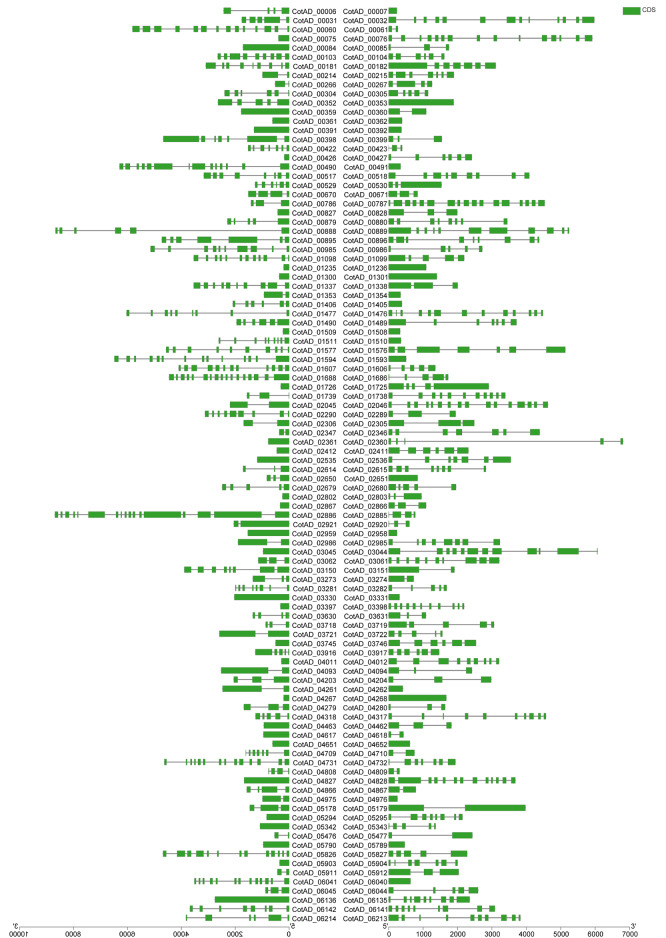
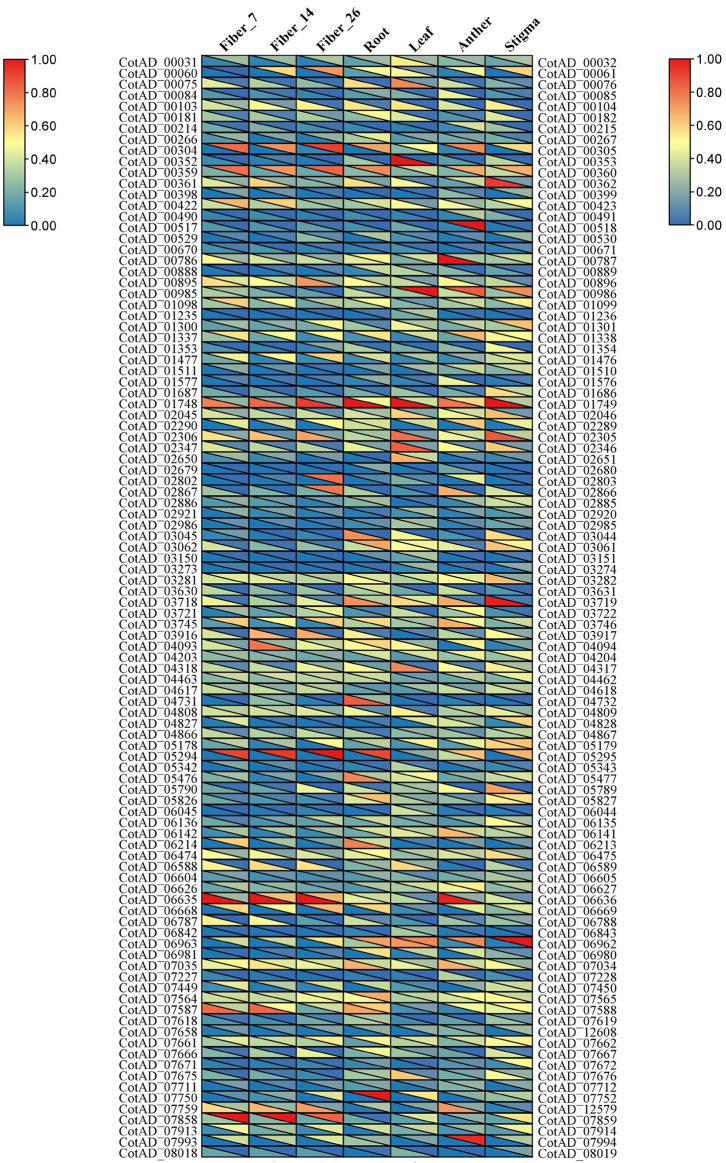
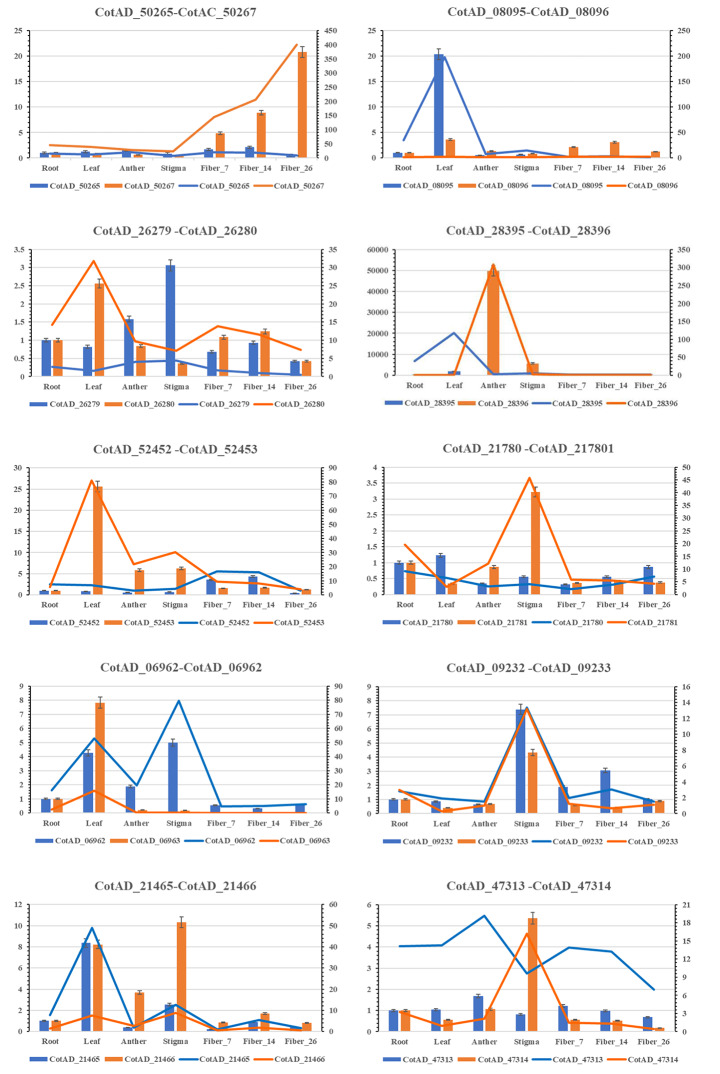
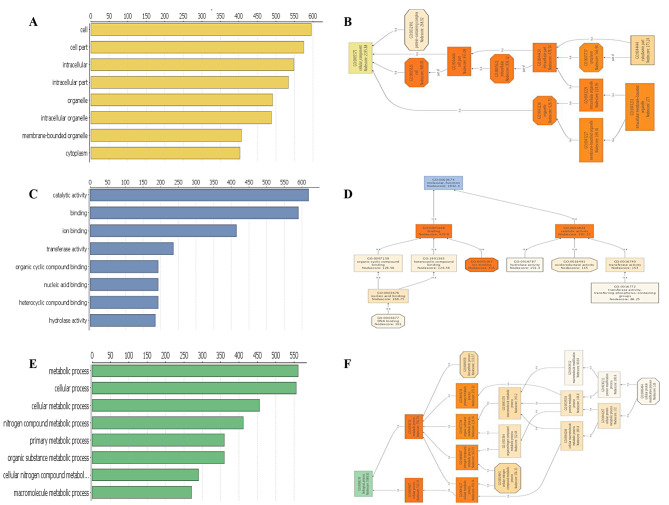
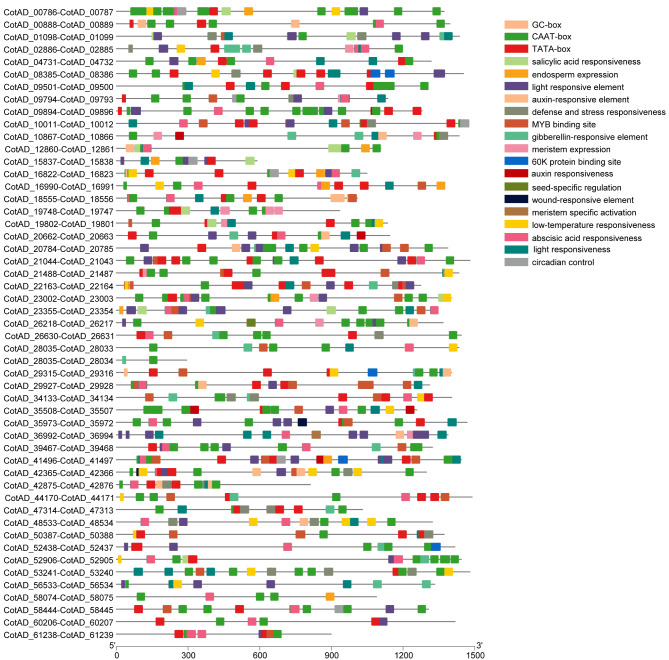
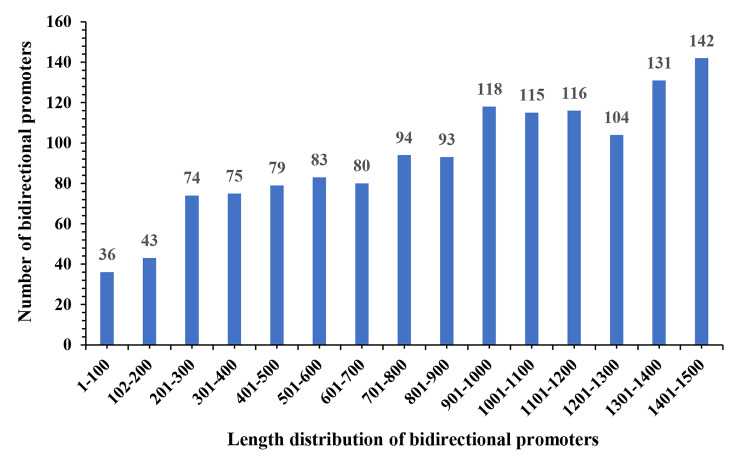
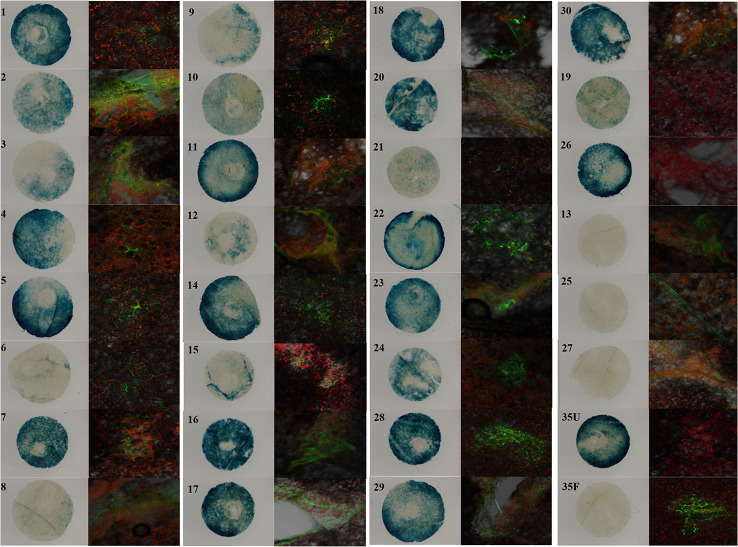
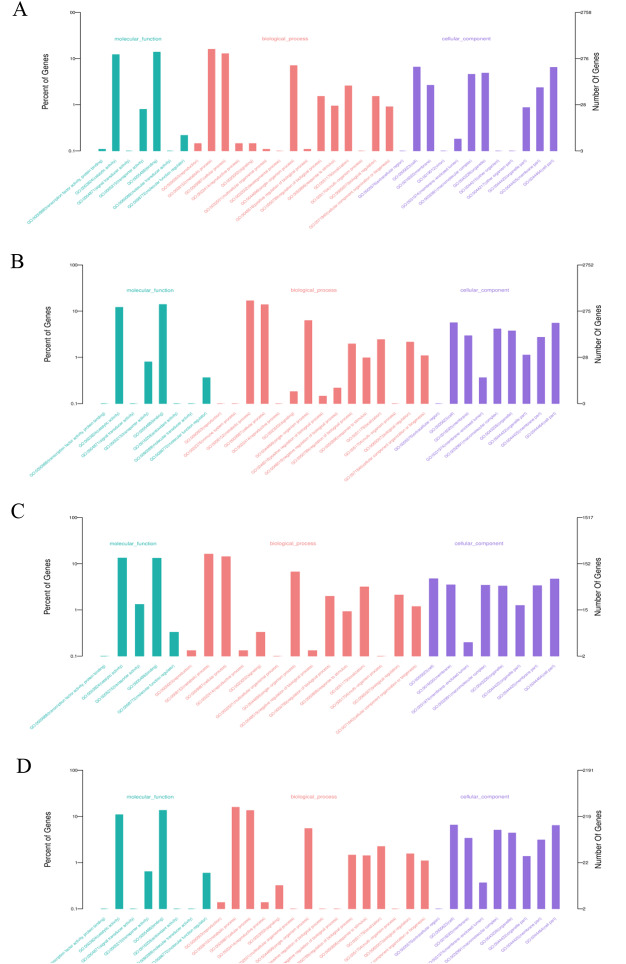
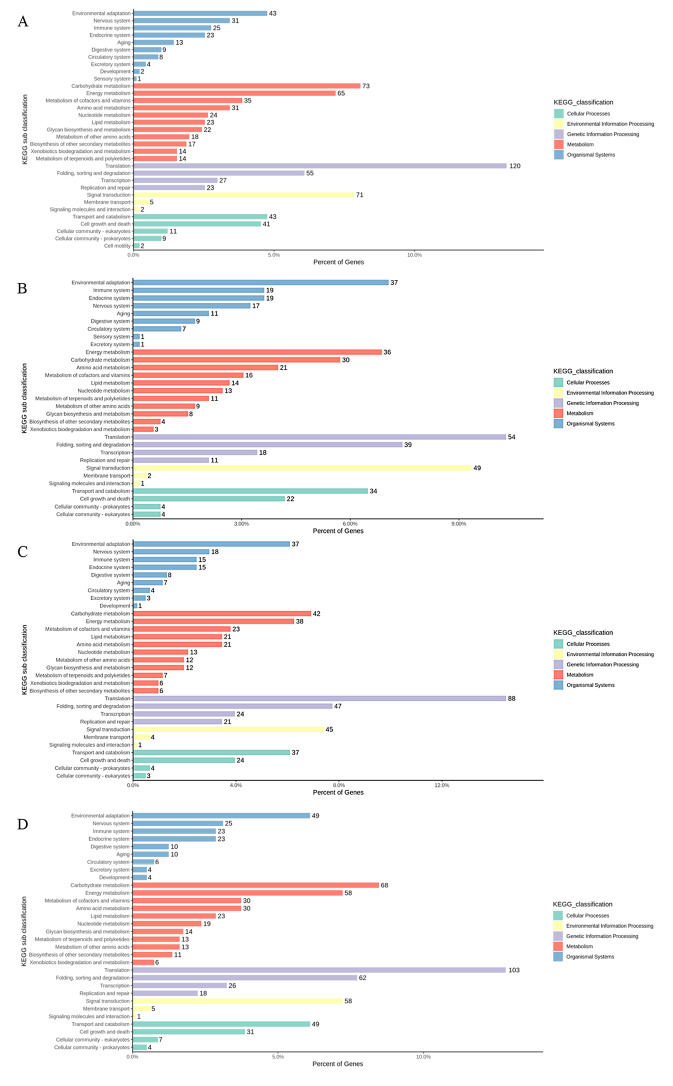
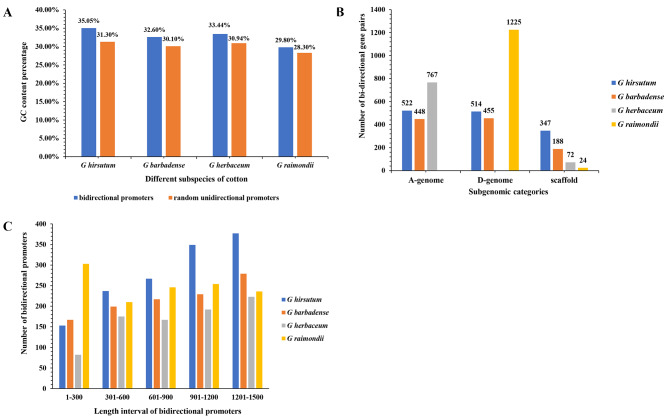
Results: Using an improved search model, a total of 1,383 bidirectional transcript pairs were identified in the Gossypium hirsutum TM-1 genome, and their gene structure and functional annotations were systematically analyzed. Thirty bidirectional intergenic sequences were randomly screened for promoter activity analysis via a transient expression system, and 25 intergenic sequences were found to have bidirectional promoter activity. Comparative analysis of the bidirectional gene profiles of the four cotton subspecies revealed that these subspecies presented abundant bidirectional gene pairs with high homology and that the bidirectional genes in the cotton subspecies were more similar in terms of their molecular functions, cellular components and biological processes. In addition, parallel analysis of bidirectional genes in dicotyledons and monocotyledons revealed that abundant bidirectional gene pairs exist in different species. Although the total number of orthologous bidirectional genes was similar, there was a significant difference in the number of orthologous bidirectional gene pairs between dicotyledons and monocotyledons. This evolutionary analysis of the function and structure of homologous bidirectional gene pairs in different varieties and different subspecies of the same species revealed potential pathways by which these gene pairs originated, which may be necessary for the evolution of a new species.

Conclusion: In this study, many bidirectional gene pairs in Gossypium hirsutum TM-1 were identified using computer programming, and systematic analysis was conducted to explore their functions and evolutionary relationships. In addition, the promoter activity of the bidirectional intergenic sequences was verified. The combination of computer programming screening, experimental validation and other methods is expected to provide preferred bidirectional promoters for transgenic breeding work via multigene cotransformation methods, and this information is valuable for genetic engineering research and applications.

Keywords: Gossypium hirsutum; Bidirectional gene pairs; Bidirectional promoter; Gene function; Genome-wide.


Conflict of interest statement

The authors declare no competing interests.

Figures

Fig. 1
Fig. 1
Model of bidirectional gene pair screening in the whole genome. A: Bidirectional gene pair search pattern created by Trinklein. The gene location coordinates do not specify the location coordinates of different transcripts. B: The bidirectional transcript pair search model established by Liu. The search model uses the location coordinates of transcripts rather than unique gene location coordinates. For example, gene 1 has three transcripts, and the intergenic region between the three transcripts (T1, T2, T3) and the transcript of gene 2 can be considered a bidirectional promoter. The bidirectional promoter between T2-gene2 and T3-gene2 was not detected via Trinklein’s search model because the transcriptional start site of the first transcript (T1) of gene 1 was considered the 5’ end boundary of gene 1 overlapping with gene 2. C: The bidirectional transcript pair search model established in this study. The search model of this study is based on the Liu model, which involves adding the location coordinates of multiple transcripts of gene 2. For example, genes 1 and 2 have three transcripts, and the intergenic region between the three transcripts of gene 1 (T1, T2, T3) and the three transcripts of gene 2 (T1, T2, T3) can be considered a bidirectional promoter, making the search range more comprehensive
Fig. 2
Fig. 2
Positional distribution of bidirectional gene pairs on the Gossypium hirsutum TM-1 chromosome. The left ruler is the chromosome length ruler, and the genes on the left and right sides of the chromosome at the same position represent a pair of bidirectional genes. The number of bidirectional gene pairs is not positively correlated with chromosome length, and the amount of gene pairs distributed on the chromosome is not related to the chromosome length
Fig. 3
Fig. 3
Association analysis of bidirectional gene pairs in the cotton genome. In the circle, lines of the same color connect two genes with an association relationship. The inner circle is the GC skew of the chromosome sequence. The red polyline indicates the leading strand, which is a positive value; the blue polyline indicates the lagging strand, which is a negative value. The heatmap of the outer circle indicates the distribution of gene density. The number of genes per 100 Mb, with blue‒yellow–red indicating that the number of genes increased. The broken line represents the GC content per 10 Mb of sequence length. The outermost gene is the distribution position of the gene in the bidirectional gene pair in the chromosome, the gene in red is the gene with an association in the genome, and the gene in black is the gene without an association in the genome
Fig. 4
Fig. 4
Gene structure analysis of bidirectional gene pairs. The green column represents the exons, and the black solid line represents the introns. The length of each gene in the bidirectional gene pairs was not related, and the number of introns and exons in the bidirectional genes was not related
Fig. 5
Fig. 5
Analysis of the tissue expression profiles of bidirectional gene pairs. The bottom left triangle represents the expression of the left genes in the bidirectional gene pairs, and the top right triangle represents the expression of the right gene in the bidirectional gene pairs. Fiber_7: 7 DPA fiber, Fiber_14: 14 DPA fiber, Fiber_26: 26 DPA fiber
Fig. 6
Fig. 6
qRT‒PCR and RNA‒seq analysis results of bidirectional gene pairs. The bars represent the qRT‒PCR results, and the lines represent the RNA‒seq results. The left vertical coordinate indicates the relative expression level, and the right vertical coordinate represents the FPKM value
Fig. 7
Fig. 7
GO enrichment analysis of the bidirectional transcript pairs of Gossypium hirsutum. A and B, C and D, E and F: Histogram charts and directed acyclic graphs of cellular components, molecular functions, and biological processes. A combo chart was generated by filtering annotation sequences together with a node sequence filter (more than 10% of the total number of sequences) and a score filter (> 100). The parental nodes that had more annotated sequences compared with their children were omitted from the diagram. A multilevel pie chart was derived from a combination chart that shows only the lowest GO item for each branch. Nodes colored by score values highlight the areas with the most concentrated annotations. The color shading indicates the enrichment level of the bidirectional genes in the GO term. The darker the color is, the more significant the enrichment. Red represents the most significant enrichment, followed by yellow, and no color indicates nonsignificant enrichment. The first line inside the box represents the number of GO terms
Fig. 8
Fig. 8
Analysis of the distribution characteristics of cis-acting elements in partial bidirectional promoters. With the use of PlantCARE (http://bioinformatics.psb.ugent.be/webtools/plantcare/html/) online analysis software, the types, quantities, locations and other information of the cis-acting elements of the bidirectional promoter sequences were predicted. TBtools software was used to construct the graphs, and each square represents a cis-acting element. Different cis-acting elements are distinguished by different colors. The important cis-acting elements are listed in the graph so that the distribution of cis-acting elements in the promoter can be clearly seen
Fig. 9
Fig. 9
Analysis of the length distribution of bidirectional promoter sequences. The number of bidirectional promoters within the range of 100 bp was counted. The abscissa shows the length distribution of the bidirectional promoters, and the ordinate shows the number of bidirectional promoters. The general trend was that the number of bidirectional promoters increased with increasing length
Fig. 10
Fig. 10
Functional identification of bidirectional cotton promoters with dominant expression in cotton leaves. Gossypium hirsutum plants with 3–5 true leaves were selected. Agrobacterium was injected into the lower surfaces of the leaves, and the plants were cultivated for 48 h. Holes were punched in the infection site, and the diameter of the holes was 1.0 cm. Histochemical staining and green fluorescence were observed. The visible green fluorescence scale bar is 100 μm. The results revealed that the promoter activities of 19 and 26 could only be detected in the GUS direction; the promoter activities of 13, 25, and 27 could only be detected in the GFP direction; and the other genes presented promoter activity in both directions. 35U: 35 S-gus; 35 F: 35 S-gfp
Fig. 11
Fig. 11
GO cluster analysis of bidirectional genes in different cotton subspecies. All the bidirectional genes in each cotton subspecies were analyzed for GO functional clustering. The functions of the bidirectional genes were studied at the following three levels: molecular function, biological process and cellular component. A: Gossypium hirsutum; B: Gossypium barbadense; C: Gossypium herbaceum; D: Gossypium raimondii
Fig. 12
Fig. 12
Cluster analysis of the KEGG metabolic pathways of bidirectional genes in different cotton subspecies. All bidirectional genes in each cotton subspecies were analyzed for KEGG metabolic pathways to elucidate the functions of bidirectional genes from different metabolic pathways in cotton. A: Gossypium hirsutum, B: Gossypium barbadense, C: Gossypium herbaceum, D: Gossypium raimondii
Fig. 13
Fig. 13
Sequence characteristics of bidirectional promoters in cotton subspecies. A: Statistical analysis of the GC contents of bidirectional promoter sequences in four cotton subspecies. The blue column represents the average GC content of bidirectional promoter sequences, and the red line represents the average GC content of random promoter sequences. B: The distributions of bidirectional gene pairs in the A-genome and D-genome were statistically analyzed separately. C: Statistical analysis of bidirectional promoter sequence length in four cotton subspecies. The number of bidirectional promoters distributed in different length intervals exhibited different distribution trends, and the distribution trends of Gossypium hirsutum, Gossypium barbadense and Gossypium herbaceum were consistent, with the highest percentage occurring in the interval of 1,201-1,500 bp. The distribution trends of Gossypium raimondii had the greatest percentage in the range of 1–300 bp

Similar articles

Cited by

References

    1. Sun Y, Shang L, Zhu QH, Fan L, Guo L. Twenty years of plant genome sequencing: achievements and challenges. Trends Plant Sci. 2022;27(4):391–401. 10.1016/j.tplants.2021.10.006 - DOI - PubMed
    1. Zainal-Abidin RA, Harun S, Vengatharajuloo V, Tamizi AA, Samsulrizal NH. Gene Co-Expression Network Tools and Databases for Crop Improvement. Plants (Basel) 2022;11(13). - PMC - PubMed
    1. Jones DM, Vandepoele K. Identification and evolution of gene regulatory networks: insights from comparative studies in plants. Curr Opin Plant Biol. 2020;54:42–8. 10.1016/j.pbi.2019.12.008 - DOI - PubMed
    1. Zhang H, Lang Z, Zhu JK. Dynamics and function of DNA methylation in plants. Nat Rev Mol Cell Biol. 2018;19(8):489–506. 10.1038/s41580-018-0016-z - DOI - PubMed
    1. Nimeth BA, Riegler S, Kalyna M. Alternative splicing and DNA damage response in plants. Front Plant Sci. 2020;11:91. 10.3389/fpls.2020.00091 - DOI - PMC - PubMed

Substances

LinkOut - more resources