

Greater exposure to PM2.5 and PM10 was associated with lower corneal nerve measures: the Maastricht study - a cross-sectional study
- PMID: 39232744
- PMCID: PMC11375839
- DOI: 10.1186/s12940-024-01110-1
Greater exposure to PM2.5 and PM10 was associated with lower corneal nerve measures: the Maastricht study - a cross-sectional study
Abstract
Background: Epidemiological and toxicological studies indicate that increased exposure to air pollutants can lead to neurodegenerative diseases. To further confirm this relationship, we evaluated the association between exposure to ambient air pollutants and corneal nerve measures as a surrogate for neurodegeneration, using corneal confocal microscopy.
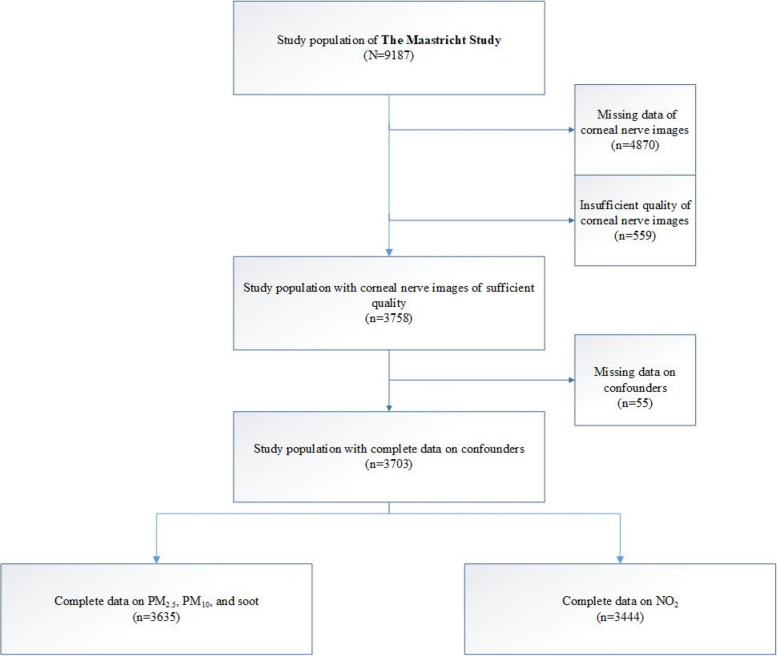
Methods: We used population-based observational cross-sectional data from The Maastricht Study including N = 3635 participants (mean age 59.3 years, 51.6% were women, and 19.9% had type 2 diabetes) living in the Maastricht area. Using the Geoscience and hEalth Cohort COnsortium (GECCO) data we linked the yearly average exposure levels of ambient air pollutants at home address-level [particulate matter with diameters of ≤ 2.5 µm (PM2.5), and ≤ 10.0 µm (PM10), nitrogen dioxide (NO2), and elemental carbon (EC)]. We used linear regression analysis to study the associations between Z-score for ambient air pollutants concentrations (PM2.5, PM10, NO2, and EC) and Z-score for individual corneal nerve measures (corneal nerve bifurcation density, corneal nerve density, corneal nerve length, and fractal dimension).
Results: After adjustment for potential confounders (age, sex, level of education, glucose metabolism status, corneal confocal microscopy lag time, inclusion year of participants, smoking status, and alcohol consumption), higher Z-scores for PM2.5 and PM10 were associated with lower Z-scores for corneal nerve bifurcation density, nerve density, nerve length, and nerve fractal dimension [stβ (95% CI): PM2.5 -0.10 (-0.14; -0.05), -0.04 (-0.09; 0.01), -0.11 (-0.16; -0.06), -0.20 (-0.24; -0.15); and PM10 -0.08 (-0.13; -0.03), -0.04 (-0.09; 0.01), -0.08 (-0.13; -0.04), -0.17 (-0.21; -0.12)], respectively. No associations were found between NO2 and EC and corneal nerve measures.
Conclusions: Our population-based study demonstrated that exposure to higher levels of PM2.5 and PM10 are associated with higher levels of corneal neurodegeneration, estimated from lower corneal nerve measures. Our results suggest that air pollution may be a determinant for neurodegeneration assessed in the cornea and may impact the ocular surface health as well.
Keywords: Air pollution; Corneal nerves; Elemental carbon; NO2; Neurodegeneration; Particulate matter.
© 2024. The Author(s).
Conflict of interest statement
The authors declare no competing interests.
Figures


References
-
- Taylor L. WHO cuts air pollution limits to save millions of lives. BMJ. 2021;374:n2349. - PubMed
Publication types
MeSH terms
Substances
Grants and funding
- 31O.041/OP-Zuid, the Province of Limburg, the Dutch Ministry of Economic Affairs
- 31O.041/OP-Zuid, the Province of Limburg, the Dutch Ministry of Economic Affairs
- 31O.041/OP-Zuid, the Province of Limburg, the Dutch Ministry of Economic Affairs
- 31O.041/OP-Zuid, the Province of Limburg, the Dutch Ministry of Economic Affairs
- 31O.041/OP-Zuid, the Province of Limburg, the Dutch Ministry of Economic Affairs
- 31O.041/OP-Zuid, the Province of Limburg, the Dutch Ministry of Economic Affairs
- 31O.041/OP-Zuid, the Province of Limburg, the Dutch Ministry of Economic Affairs
- 31O.041/OP-Zuid, the Province of Limburg, the Dutch Ministry of Economic Affairs
- 31O.041/OP-Zuid, the Province of Limburg, the Dutch Ministry of Economic Affairs
- 31O.041/OP-Zuid, the Province of Limburg, the Dutch Ministry of Economic Affairs
- 31O.041/OP-Zuid, the Province of Limburg, the Dutch Ministry of Economic Affairs
- 31O.041/OP-Zuid, the Province of Limburg, the Dutch Ministry of Economic Affairs
- 31O.041/OP-Zuid, the Province of Limburg, the Dutch Ministry of Economic Affairs
- 31O.041/OP-Zuid, the Province of Limburg, the Dutch Ministry of Economic Affairs
LinkOut - more resources
Full Text Sources
