QIGTD: identifying critical genes in the evolution of lung adenocarcinoma with tensor decomposition
- PMID: 39232802
- PMCID: PMC11376055
- DOI: 10.1186/s13040-024-00386-w
QIGTD: identifying critical genes in the evolution of lung adenocarcinoma with tensor decomposition
Abstract
Background: Identifying critical genes is important for understanding the pathogenesis of complex diseases. Traditional studies typically comparing the change of biomecules between normal and disease samples or detecting important vertices from a single static biomolecular network, which often overlook the dynamic changes that occur between different disease stages. However, investigating temporal changes in biomolecular networks and identifying critical genes is critical for understanding the occurrence and development of diseases.
Methods: A novel method called Quantifying Importance of Genes with Tensor Decomposition (QIGTD) was proposed in this study. It first constructs a time series network by integrating both the intra and inter temporal network information, which preserving connections between networks at adjacent stages according to the local similarities. A tensor is employed to describe the connections of this time series network, and a 3-order tensor decomposition method was proposed to capture both the topological information of each network snapshot and the time series characteristics of the whole network. QIGTD is also a learning-free and efficient method that can be applied to datasets with a small number of samples.
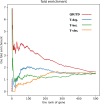
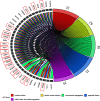
Results: The effectiveness of QIGTD was evaluated using lung adenocarcinoma (LUAD) datasets and three state-of-the-art methods: T-degree, T-closeness, and T-betweenness were employed as benchmark methods. Numerical experimental results demonstrate that QIGTD outperforms these methods in terms of the indices of both precision and mAP. Notably, out of the top 50 genes, 29 have been verified to be highly related to LUAD according to the DisGeNET Database, and 36 are significantly enriched in LUAD related Gene Ontology (GO) terms, including nuclear division, mitotic nuclear division, chromosome segregation, organelle fission, and mitotic sister chromatid segregation.
Conclusion: In conclusion, QIGTD effectively captures the temporal changes in gene networks and identifies critical genes. It provides a valuable tool for studying temporal dynamics in biological networks and can aid in understanding the underlying mechanisms of diseases such as LUAD.
Keywords: Critical genes; Evolution; LUAD; Temporal network; Tensor decomposition.
© 2024. The Author(s).
Conflict of interest statement
The authors declare no competing interests.
Figures


Similar articles
-
Support Vector Machine for Lung Adenocarcinoma Staging Through Variant Pathways.G3 (Bethesda). 2020 Jul 7;10(7):2423-2434. doi: 10.1534/g3.120.401207. G3 (Bethesda). 2020. PMID: 32444360 Free PMC article.
-
Identification of molecular subtypes in lung adenocarcinoma based on DNA methylation and gene expression profiling-a bioinformatic analysis.Ann Transl Med. 2022 Aug;10(16):882. doi: 10.21037/atm-22-3340. Ann Transl Med. 2022. PMID: 36111050 Free PMC article.
-
Exploring the mechanism of 6-Methoxydihydrosanguinarine in the treatment of lung adenocarcinoma based on network pharmacology, molecular docking and experimental investigation.BMC Complement Med Ther. 2024 May 23;24(1):202. doi: 10.1186/s12906-024-04497-z. BMC Complement Med Ther. 2024. PMID: 38783288 Free PMC article.
-
Chromatin Separation Regulators Predict the Prognosis and Immune Microenvironment Estimation in Lung Adenocarcinoma.Front Genet. 2022 Jul 8;13:917150. doi: 10.3389/fgene.2022.917150. eCollection 2022. Front Genet. 2022. PMID: 35873497 Free PMC article.
-
A Tensor Decomposition-Based Approach for Detecting Dynamic Network States From EEG.IEEE Trans Biomed Eng. 2017 Jan;64(1):225-237. doi: 10.1109/TBME.2016.2553960. Epub 2016 Apr 13. IEEE Trans Biomed Eng. 2017. PMID: 27093314
References
-
- Lü L, Chen D, Ren XL, Zhang QM, Zhang YC, Zhou T. Vital nodes identification in complex networks. Phys Rep. 2016;650:1–63. 10.1016/j.physrep.2016.06.007 - DOI
Grants and funding
LinkOut - more resources
Full Text Sources

