. 2025 Jan;37(2):e2403756.
doi: 10.1002/adma.202403756. Epub 2024 Sep 5.

Tumor-Homing Phage Nanofibers for Nanozyme-Enhanced Targeted Breast Cancer Therapy

Affiliations

Tumor-Homing Phage Nanofibers for Nanozyme-Enhanced Targeted Breast Cancer Therapy

Tao Yang et al. Adv Mater. 2025 Jan.

Abstract

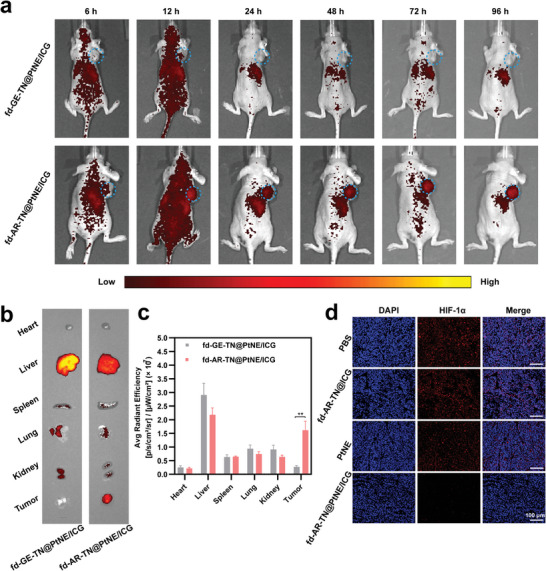
Photodynamic therapy (PDT) eliminates cancer cells by converting endogenous oxygen into reactive oxygen species (ROS). However, its efficacy is significantly hindered by hypoxia in solid tumors. Hence, to engineer filamentous fd phage, a human-friendly bacteria-specific virus is proposed, into a nanozyme-nucleating photosensitizer-loaded tumor-homing nanofiber for enhanced production of ROS in a hypoxic tumor. Specifically, Pt-binding and tumor-homing peptides are genetically displayed on the sidewall and tip of the fd phage, respectively. The Pt-binding peptides induced nucleation and orientation of Pt nanozymes (PtNEs) on the sidewall of the phage. The resultant PtNE-coated tumor-homing phage exhibits significantly enhanced sustained catalytic conversion of hydrogen peroxide in hypoxic tumors into O2 for producing ROS needed for PDT, compared to non-phage-templated PtNE. Density functional theory (DFT) calculations verify the catalytic mechanism of the phage-templated PtNE. After intravenous injection of the PtNE-coated indocyanine green (ICG)-loaded tumor-homing phages into breast tumor-bearing mice, the nanofibers home to the tumors and effectively inhibit tumor growth by the PtNE-enhanced PDT. The nanofibers can also serve as a tumor-homing imaging probe due to the fluorescence of ICG. This work demonstrates that filamentous phage, engineered to become tumor-homing nanozyme-nucleating tumor-hypoxia-relieving nanofibers, can act as cancer-targeting nanozymes with improved catalytic performance for effective targeted PDT.

Keywords: hydrogen peroxide decomposition; hypoxic tumor; phage nanofibers; photodynamic therapy; platinum nanozyme.


Conflict of interest statement

The authors declare no conflict of interest.

Figures

Figure 1
Figure 1
Schematic illustration of the synthesis of nanozyme (PtNE)‐coated tumor‐homing fd phage nanofibers using dual‐peptide‐displayed Pt‐binding tumor‐homing phage as a template and their use in nanozyme‐enhanced targeted breast cancer therapy. a) Genetic engineering of the fd phage nanofiber (≈1300 nm long, ≈7 nm wide). The Pt‐binding peptide TN was first fused to pVIII on the sidewall to form the pVIII‐displayed phage (fd‐TN). Then, the MCF‐7 tumor‐homing peptide AR was fused to pIII on the tip, generating the double‐displayed phage (fd‐AR‐TN). b) Phage‐templated nucleation of PtNEs on the sidewall. The Pt‐binding peptides displayed on pVIII facilitate the nucleation and oriented assembly of PtNEs on the sidewall of fd‐AR‐TN phage from a Pt precursor solution and the resultant PtNE‐coated tumor‐targeting phage is termed fd‐AR‐TN@PtNE. c) The conjugation of ICG photosensitizers onto the PtNE‐coated tumor‐targeting phage nanofibers. The ICG‐NHS ester molecules were covalently conjugated with the available −NH2 groups of the pVIII on the capsid of fd‐AR‐TN phages, forming ICG‐loaded PtNE‐coated tumor‐homing phage (fd‐AR‐TN@PtNE/ICG). d) The fd‐AR‐TN@PtNE/ICG phage nanofibers were intravenously injected into MCF‐7 tumor‐bearing mice to perform tumor therapy. e) The nanofibers could target the MCF‐7 tumor through the guidance of the AR peptide displayed on phage pIII. f) PtNEs on the sidewall of the nanofiber could catalyze H2O2 to decompose and generate O2 continuously. Consequently, the production of ROS was increased under the irradiation of NIR light for enhanced PDT of breast cancer by fd‐AR‐TN@PtNE/ICG.
Figure 2
Figure 2
Verification of peptide‐mediated Pt nanozyme nucleation on the sidewall of double‐displayed fd phage. a) TEM images showing the morphology of the fd‐AR‐TN@PtNE nanofibers. b) High‐resolution transmission electron microscopy (HRTEM) lattice image of a straight region on the fd‐AR‐TN@PtNE nanofiber, indicating the close‐packed Pt nanocrystal morphology. Four typical areas (yellow rectangles) were selected to perform the Fast Fourier transformation (FFT). c) FFT of the selected nanocrystals in the HRTEM lattice image. The numbers (c‐1, c‐2, c‐3, c‐4) correspond to the rectangles (1, 2, 3, 4) in (b) one by one. d) High‐angle annular dark field scanning TEM (HAADF‐STEM) images of fd‐AR‐TN@PtNE nanofiber and e) the corresponding energy‐dispersive X‐ray (EDX) mapping of Pt element.
Figure 3
Figure 3
Structure and catalase‐like activities of fd‐AR‐TN@PtNE. a) Powder XRD pattern of fd‐AR‐TN@PtNE nanofiber. The nanofiber displays a typical face‐centered cubic phase of Pt (JCPDS PDF# 04–0802). b) Pt 4f XPS spectrum of fd‐AR‐TN@PtNE magnified from Figure S5 (Supporting Information). c) The enzymatic activity of PtNE and fd‐AR‐TN@PtNE to generate O2. The H2O2 solution was set as a control. d) Decomposition curve of H2O2 in the presence of PtNE or fd‐AR‐TN@PtNE. e,f) The cyclic catalytic activity of PtNE (e) and fd‐AR‐TN@PtNE (f) with repetitive supplement of H2O2 every 120 min. g,h) Side and top views of the possible adsorption sites (determined by DFT simulation), including the top, bridge, and hollow of Pt atoms, for chemisorption of O* on Pt‐{111} (g) and Pt‐{100} (h). Red spheres are the oxygen atoms, and gray spheres are the Pt atoms.
Figure 4
Figure 4
Morphology, absorption spectra, and property characterizations of ICG‐conjugated PtNE‐coated phage nanofibers (fd‐AR‐TN@PtNE/ICG). a) Schematic illustration of ICG conjugation onto the fd‐AR‐TN@PtNE nanofiber. The ICG‐NHS ester molecules were covalently conjugated with the available −NH2 groups of the pVIII on the capsid of fd‐AR‐TN phages, forming ICG‐loaded PtNE‐coated tumor‐homing phage (fd‐AR‐TN@PtNE/ICG). b) Representative TEM image of fd‐AR‐TN@PtNE/ICG nanofibers. c) Absorption and d) FTIR spectra of ICG, fd‐AR‐TN, fd‐AR‐TN@ICG, fd‐AR‐TN@PtNE and fd‐AR‐TN@PtNE/ICG. e,f) Photodegradation rates of the 1O2 indicator DPBF when incubated with PBS, ICG, fd‐AR‐TN@ICG, fd‐AR‐TN@PtNE and fd‐AR‐TN@PtNE/ICG in the presence of H2O2 under NIR light irradiation in air atmosphere (e) and N2 atmosphere (f).
Figure 5
Figure 5
In vitro cellular uptake, suppression of hypoxic condition, and intracellular ROS generation. a) CLSM images of the MCF‐7 tumor cells co‐cultured with the fd‐GE‐TN@PtNE/FITC and fd‐AR‐TN@PtNE/FITC nanofibers. GE was a control peptide with a scrambled sequence of the peptide AR. All the nanofibers were conjugated with FITC to be conveniently observed under CLSM imaging. The cell nucleus was stained by DAPI (blue). b) HIF‐1α immunofluorescence staining (green) of MCF‐7 cells after various treatments indicated. Actin cytoskeleton was stained by fluorescent phalloidin conjugates (red). The cell nucleus was stained by DAPI (blue). c) ROS generation (green) in MCF‐7 cells treated by PBS, ICG, fd‐AR‐TN@ICG, fd‐AR‐TN@PtNE, and fd‐AR‐TN@PtNE/ICG in the hypoxic condition, as detected by DCFH‐DA, an intracellular ROS indicator. d) The relative intensity analysis of green fluorescence signals from FITC‐conjugated nanofibers of various groups in (a). ** p < 0.01. e) The relative intensity analysis of green fluorescence signals from HIF‐1α immunofluorescence staining in (b). **** p < 0.0001. f) The relative intensity analysis of green fluorescence signals from ROS staining in (c). * p < 0.05, *** p < 0.001, **** p < 0.0001.
Figure 6
Figure 6
In vitro PDT efficacy of fd‐AR‐TN@PtNE/ICG on MCF‐7 tumor cells. a) Relative cell viability of MCF‐7 cells treated with the fd‐AR‐TN@PtNE or fd‐AR‐TN@PtNE/ICG nanofibers with different concentrations in the absence of NIR light irradiation. b,c) Relative cell viability of ICG, fd‐AR‐TN@ICG, and fd‐AR‐TN@PtNE/ICG treated MCF‐7 cells in normoxic (b) and hypoxic (c) conditions under NIR light irradiation. * p < 0.05, ** p < 0.01, *** p < 0.001, **** p < 0.0001. d) Live‐dead staining of MCF‐7 cells treated by PBS, ICG, fd‐AR‐TN@ICG and fd‐AR‐TN@PtNE/ICG under NIR light irradiation in the hypoxic condition. Live cells (green) were stained by calcein‐AM and dead cells (red) were stained by propidium iodide.
Figure 7
Figure 7
In vivo MCF‐7 tumor targeting ability of the phage nanofibers displaying the tumor‐homing peptide AR (vs the non‐tumor‐homing control peptide GE) at the tip and in vivo suppressing of tumor hypoxia by PtNE‐coated phage nanofibers. a) Fluorescence imaging of the fd‐GE‐TN@PtNE/ICG and fd‐AR‐TN@PtNE/ICG nanofibers distribution in the MCF‐7 tumor‐bearing mice. The images were obtained at 6, 12, 24, 48, 72 and 96 h post injection. The tumor sites were highlighted by blue circles. b) Fluorescence imaging of excised tumors and major organs (heart, liver, spleen, lungs, and kidney) 96 h post injection. c) Quantitative analysis of the mean ICG fluorescence intensity in the tissues excised after 96 h. ** p < 0.01. d) HIF‐1α staining (red) of MCF‐7 tumor tissues 24 h post injection with the PBS, fd‐AR‐TN@ICG, PtNE and fd‐AR‐TN@PtNE/ICG. The cell nuclei were stained by DAPI (blue).
Figure 8
Figure 8
The targeted breast cancer therapy in vivo using the tumor‐homing nanofibers via nanozyme‐enhanced PDT in the MCF‐7 tumor‐bearing mice. a) Schematic illustration of the tumor therapy procedure in vivo. b) The actual photographs of the mice after the 16 days treatment. The tumor sites were highlighted by red circles. c) Body weights of the mice with different treatments (PBS, ICG + NIR, fd‐AR‐TN@ICG + NIR, fd‐AR‐TN@PtNE/ICG, and fd‐AR‐TN@PtNE/ICG + NIR, n = 5) during the 16 days of the therapy. + NIR, under NIR light irradiation. d) Relative tumor volume changes of MCF‐7 tumor‐bearing mice after various treatments. * p < 0.05, ** p < 0.01, **** p < 0.0001. e) The tumor weights acquired from the excised tumor tissues after various treatments. * p < 0.05, ** p < 0.01, **** p < 0.0001. f) ROS staining images of tumor tissues after various treatments indicated.
Figure 9
Figure 9
The histological and immunohistochemical evaluation of the tumors. a) H&E staining images of tumor slices from different groups, receiving treatments indicated. b) TUNEL and c) Ki67 immunohistochemical staining images of tumor tissues from various groups, receiving treatments indicated. d) Quantitative proportion of tumor cell death from the H&E staining images (n = 5 random respective sections). The apoptotic index and the Ki67 positive ratio were quantified in (e) and (f) from the immunohistochemical staining images (n = 5 random respective sections), respectively. * p < 0.05, ** p < 0.01, *** p < 0.001, **** p < 0.0001.

References

    1. a) Li Z., Di C., Li S., Yang X., Nie G., Acc. Chem. Res. 2019, 52, 2703; - PubMed
    2. b) Zhang Y., He J., Acta Biomater. 2021, 134, 1. - PubMed
    1. a) Jain R. K., Science 2005, 307, 58; - PubMed
    2. b) Phung C. D., Tran T. H., Pham L. M., Nguyen H. T., Jeong J.‐H., Yong C. S., Kim J. O., J. Controlled Release 2020, 324, 413; - PubMed
    3. c) Liu Y., Jiang Y., Zhang M., Tang Z., He M., Bu W., Acc. Chem. Res. 2018, 51, 2502. - PubMed
    1. a) Lin H., Chen Y., Shi J., Chem. Soc. Rev. 2018, 47, 1938; - PubMed
    2. b) Hao Y., Chen Y., He X., Yu Y., Han R., Li Y., Yang C., Hu D., Qian Z., Adv. Sci. 2020, 7, 2001853. - PMC - PubMed
    1. a) Jiang D., Ni D., Rosenkrans Z. T., Huang P., Yan X., Cai W., Chem. Soc. Rev. 2019, 48, 3683; - PMC - PubMed
    2. b) Wang H., Wan K., Shi X., Adv. Mater. 2019, 31, 1805368. - PubMed
    1. a) Wang X.‐S., Zeng J.‐Y., Zhang M.‐K., Zeng X., Zhang X.‐Z., Adv. Funct. Mater. 2018, 28, 1801783;
    2. b) Zhang Y., Wang F., Liu C., Wang Z., Kang L., Huang Y., Dong K., Ren J., Qu X., ACS Nano 2018, 12, 651. - PubMed

LinkOut - more resources