. 2024 Sep 2;8(9):e149.
doi: 10.1002/hem3.149. eCollection 2024 Sep.

Single-cell RNA sequencing of pediatric Hodgkin lymphoma to study the inhibition of T cell subtypes

Affiliations

Single-cell RNA sequencing of pediatric Hodgkin lymphoma to study the inhibition of T cell subtypes

Jurrian K de Kanter et al. Hemasphere. .

Erratum in

Abstract

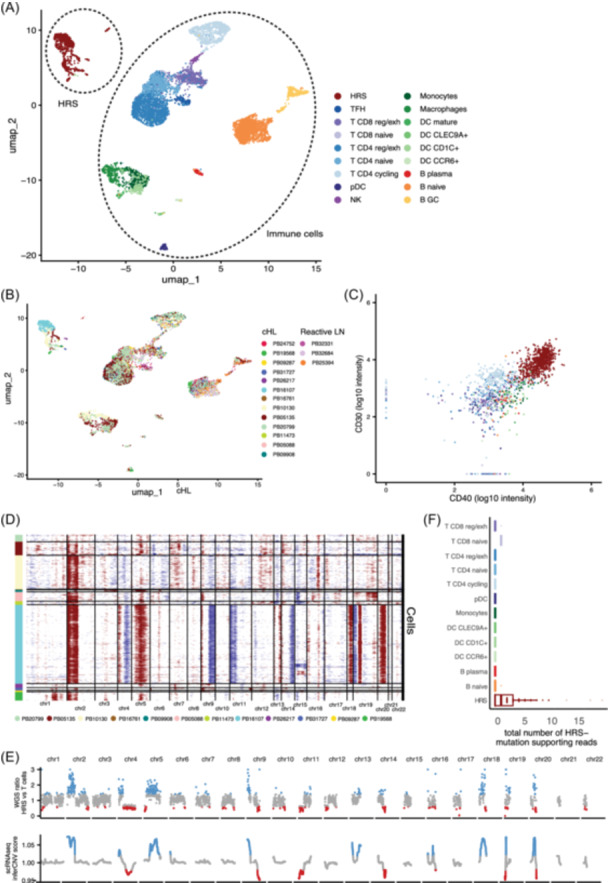
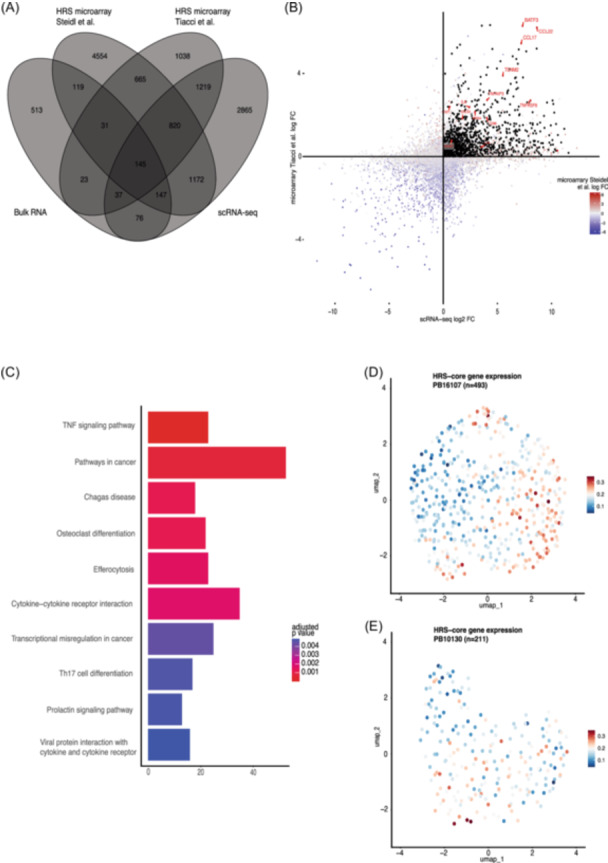
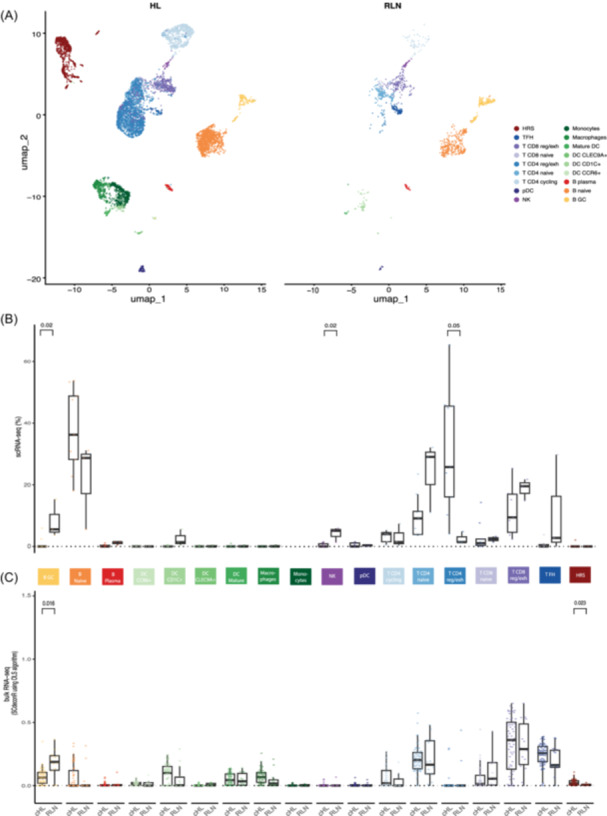
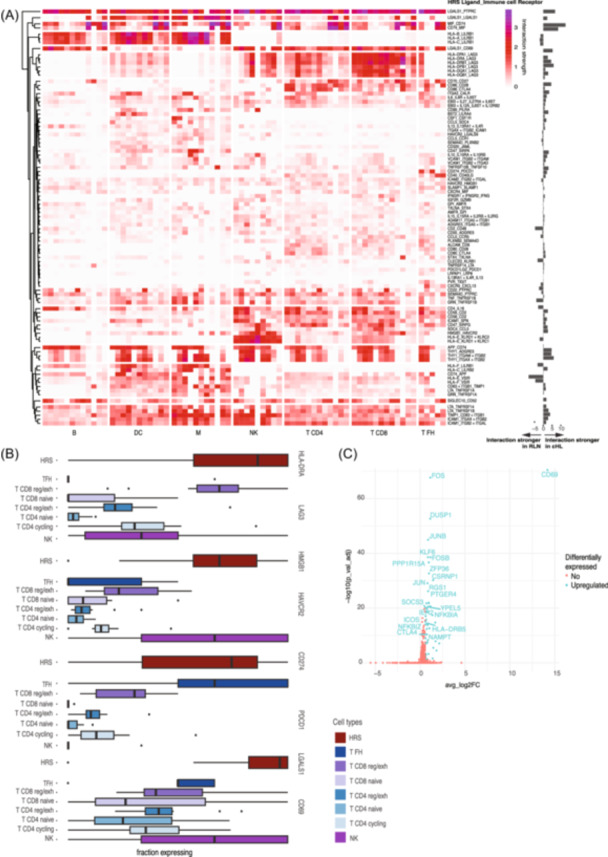
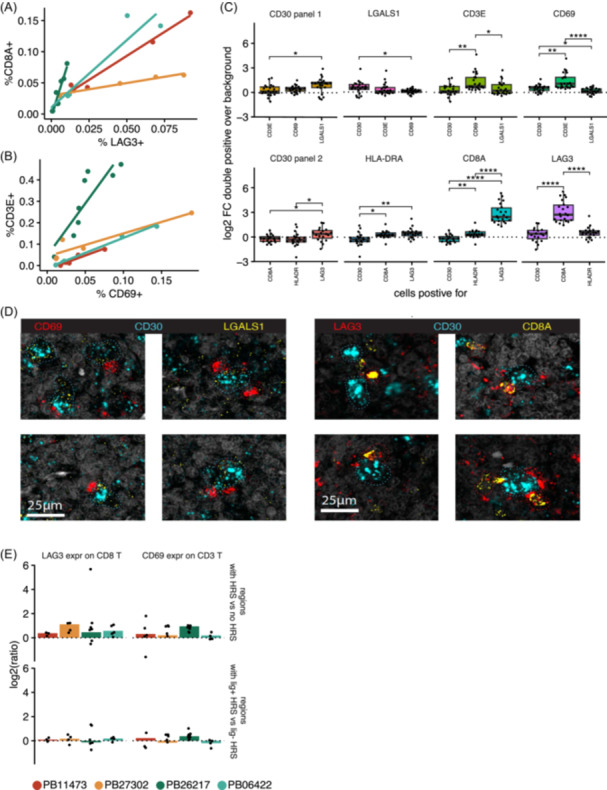
Pediatric classic Hodgkin lymphoma (cHL) patients have a high survival rate but suffer from severe long-term side effects induced by chemo- and radiotherapy. cHL tumors are characterized by the low fraction (0.1%-10%) of malignant Hodgkin and Reed-Sternberg (HRS) cells in the tumor. The HRS cells depend on the surrounding immune cells for survival and growth. This dependence is leveraged by current treatments that target the PD-1/PD-L1 axis in cHL tumors. The development of more targeted therapies that are specific for the tumor and are therefore less toxic for healthy tissue compared with conventional chemotherapy could improve the quality of life of pediatric cHL survivors. Here, we applied single-cell RNA sequencing (scRNA-seq) on isolated HRS cells and the immune cells from the same cHL tumors. Besides TNFRSF8 (CD30), we identified other genes of cell surface proteins that are consistently overexpressed in HRS cells, such as NRXN3 and LRP8, which can potentially be used as alternative targets for antibody-drug conjugates or CAR T cells. Finally, we identified potential interactions by which HRS cells inhibit T cells, among which are the galectin-1/CD69 and HLA-II/LAG3 interactions. RNAscope was used to validate the enrichment of CD69 and LAG3 expression on T cells near HRS cells and indicated large variability of the interaction strength with the corresponding ligands between patients and between tumor tissue regions. In conclusion, this study identifies new potential therapeutic targets for cHL and highlights the importance of studying heterogeneity when identifying therapy targets, specifically those that target tumor-immune cell interactions.


Conflict of interest statement

The authors declare no conflicts of interest.

Figures

Figure 1
Figure 1
Hodgkin and Reed–Sternberg (HRS) cells were captured by plate‐ and chip‐based single‐cell RNA sequencing (scRNA‐seq). (A) UMAP (Uniform Manifold Approximation and Projection) plot of all cells from classic Hodgkin lymphoma and reactive lymph nodes labeled by cell type. (B) UMAP plot colored for patients. (C) Fluorescence‐activated cell sorting intensities of the cells sorted on the SORT‐seq platform with CD30 and CD40 antibodies labeled according to the scRNA‐seq cell types. (D) Copy number variation plot of the HRS cells shown in (A). Each row is a cell, and each column is a gene. Chromosomal gains are annotated as red, whereas chromosomal losses are annotated as blue. (E) Normalized copy number plots of patient PB16107 based on HRS cell whole‐genome sequencing (WGS) data (top) and HRS cell scRNA‐seq (bottom). (F) The number of reads in each cell of patient PB16107 that supported a mutation found in the WGS data of HRS cells from the same patient. GC, germinal center; NK, natural killer; pDC, plasmacytoid dendritic cell; TFH, T follicular helper.
Figure 2
Figure 2
Hodgkin and Reed–Sternberg (HRS) core‐gene identification. (A) A Venn diagram of HRS markers as identified in four data sets, HRS cell microarray data from Steidl et al. and Tiacci et al., the single‐cell RNA sequencing (scRNA‐seq) data presented here, and bulk RNA‐seq data of classic Hodgkin lymphoma and reactive lymph nodes. The genes that overlapped between the two microarray data sets and the scRNA‐seq data set were termed “HRS‐core” genes. (B) The differential expression of HRS markers in HRS cells compared with normal B cells in the scRNA‐seq data compared to the Tiacci et al. microarray data. Each point is a gene. Points are colored according to fold change in expression in the Steidl et al. microarray data of HRS cells compared to healthy B cells. (C) Kyoto Encyclopedia of Genes and Genomes‐pathway enrichment of the HRS‐core genes. (D) An aggregate score of expression of HRS‐core genes in HRS cells of patient PB16107. (E) Same as (D), but for patient PB10130. FC, fold change; Th17, T‐helper type 17; TNF, tumor necrosis factor.
Figure 3
Figure 3
The immune cell composition of the classic Hodgkin lymphoma (cHL) microenvironment compared with reactive lymph nodes. (A) UMAP (Uniform Manifold Approximation and Projection) plots of cells of cHL lymph nodes and reactive lymph nodes (RLNs) labeled by cell type. (B) A quantification of the percentage of cell types per sample. This includes only SORT‐seq cells, which were sorted without enrichment of any marker in flow cytometry (i.e., only unbiased live cells). Each dot represents a sample. Here and in all other figures, the box plots depict the median (center line), 25th, and 75th percentiles (box), and the largest values no more than 1.5* the interquartile range (whiskers). p Values were calculated using the differential composition analysis of DCATS and false discovery rate (FDR)‐corrected. (C) The estimated frequency of cell types in bulk RNA‐seq data of cHL lymph nodes and RLN as estimated by SCdeconR using the OLS algorithm. p Values were calculated by the Wilcoxon test and FDR corrected.
Figure 4
Figure 4
Potential interactions between Hodgkin and Reed–Sternberg (HRS) cells and tumor microenvironment cells. (A) The presence and strength of HRS cell interactions with other cells in the microenvironment. Each block is the strength of a particular interaction in one patient. Each interaction is annotated with [HRS cell ligand]_[immune cell receptor]. Only interactions are shown that are present between HRS cells and a single immune cell type in three or more patients. The difference in the maximum interaction strength between classic Hodgkin lymphoma and reactive lymph node samples is indicated on the right side of the plot. (B) The percentage of T cell subsets and NK cells expressing inhibitory receptors across samples. For each receptor, the percentage of HRS cells expressing the corresponding ligand across samples is depicted. Each dot is an outlier. (C) Volcano plot of differentially expressed genes between CD69+ T cells and CD69 T cells. Significantly differentially expressed genes are annotated.
Figure 5
Figure 5
Spatial assessment of LAG3+CD8A+ and CD69+CD3E+ T cells with Hodgkin and Reed–Sternberg (HRS) cells. (A) RNAscope co‐expression of CD8A and LAG3 across regions of classic Hodgkin lymphoma (cHL) lymph nodes. Regions were separated into 51 px blocks. The fraction of blocks positive for each marker is depicted. Each dot is a region of one lymph node. (B) The same as (A), but for CD69 and CD3E expression. (C) Co‐expression of genes in 51 px blocks (7.2 µm). For each probe used in the two panels, the log2 fold change of co‐expression (y‐axis) with the rest of the probes (x‐axis) was quantified, with respect to the background level. A value above 0 means co‐expression is more often observed than expected by chance. Each dot is a single region in a sample. Top: Probes used in panel 1 (CD30, LGALS1, CD3E, and CD69). Bottom: Probes used in panel 2 (CD30, HLA‐DRA, CD8A, and LAG3). (D) Examples of RNAscope images of HRS cells (CD30) with T cells in close proximity. On the left, images of RNAscope panel 1 of patient PB26217 are depicted. On the right, images of panel 2 of patient PB27302 are depicted. HRS cells are annotated with blue dotted lines. T cells are annotated with red dotted lines. (E) Enrichment of LAG3/CD69‐expressing T cells near HRS cells. Top: T cells expressing the inhibitory receptor gene near HRS cells (this includes both ligand‐positive and ligand‐negative HRS) compared with T cells not near HRS cells. Bottom: T cells expressing the inhibitory receptor gene near ligand‐positive (lig+) HRS cells compared with ligand‐negative (lig) HRS cells. The bar plot is based on all T cells in all regions of an individual patient. The dots indicate the log2 fold change in single regions. *p < 0.05; **p < 0.01; ****p < 0.0001.

Similar articles

Cited by

  • Dissection of single-cell landscapes for the development of chimeric antigen receptor T cells in Hodgkin lymphoma.
    Gottschlich A, Grünmeier R, Hoffmann GV, Nandi S, Kavaka V, Müller PJ, Jobst J, Oner A, Kaiser R, Gärtig J, Piseddu I, Frenz-Wiessner S, Fairley SD, Schulz H, Igl V, Janert TA, Di Fina L, Mulkers M, Thomas M, Briukhovetska D, Simnica D, Carlini E, Tsiverioti CA, Trefny MP, Lorenzini T, Märkl F, Mesquita P, Brabenec R, Strzalkowski T, Stock S, Michaelides S, Hellmuth J, Thelen M, Reinke S, Klapper W, Gelebart PF, Nicolai L, Marr C, Beltrán E, Megens RTA, Klein C, Baran-Marszak F, Rosenwald A, von Bergwelt-Baildon M, Bröckelmann PJ, Endres S, Kobold S. Gottschlich A, et al. Blood. 2025 Apr 3;145(14):1536-1552. doi: 10.1182/blood.2023022197. Blood. 2025. PMID: 40178843 Free PMC article.

References

    1. Brice P, de Kerviler E, Friedberg JW. Classical Hodgkin lymphoma. Lancet. 2021;398:1518‐1527. - PubMed
    1. LaCasce AS. Treating Hodgkin lymphoma in the new millennium: relapsed and refractory disease. Hematol Oncol. 2019;37:87‐91. - PubMed
    1. Raut M, Singh G, Hiscock I, Sharma S, Pilkhwal N. A systematic literature review of the epidemiology, quality of life, and economic burden, including disease pathways and treatment patterns of relapsed/refractory classical Hodgkin lymphoma. Expert Rev Hematol. 2022;15:607‐617. - PubMed
    1. Ehrhardt MJ, Flerlage JE, Armenian SH, Castellino SM, Hodgson DC, Hudson MM. Integration of pediatric Hodgkin lymphoma treatment and late effects guidelines: seeing the forest beyond the trees. J Natl Compr Cancer Netw. 2021;19:755‐764. - PubMed
    1. Ansell SM. Hodgkin lymphoma: 2018 update on diagnosis, risk‐stratification, and management. Am J Hematol. 2018;93:704‐715. - PubMed

LinkOut - more resources