

Mapping QTLs with additive and epistatic effects for awn length and their effects on kernel-related traits in common wheat
- PMID: 39233911
- PMCID: PMC11371672
- DOI: 10.3389/fpls.2024.1417588
Mapping QTLs with additive and epistatic effects for awn length and their effects on kernel-related traits in common wheat
Abstract
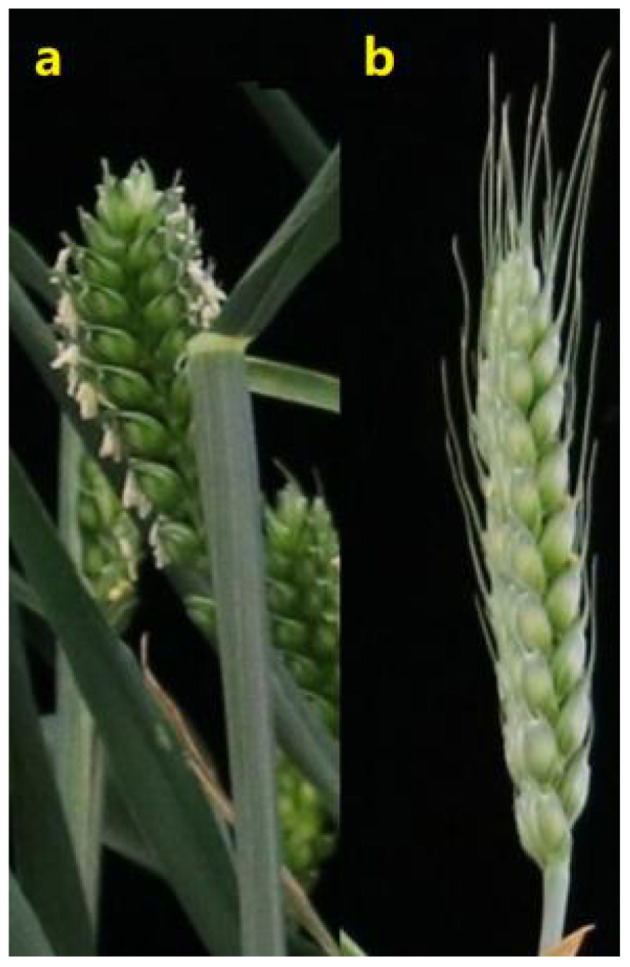
Introduction: Wheat awns are crucial determinants of wheat yield due to their capacity to photosynthesize and exchange gas. Understanding the genetic basis of awn length (AL) is essential for improving wheat yield in molecular breeding programs.
Methods: In this study, quantitative trait loci (QTLs) of AL were analyzed using recombinant inbred line (RIL) mapping population referred to as YY-RILs, which was derived from a cross between Yannong 15 (YN15) and Yannong 1212 (YN1212).
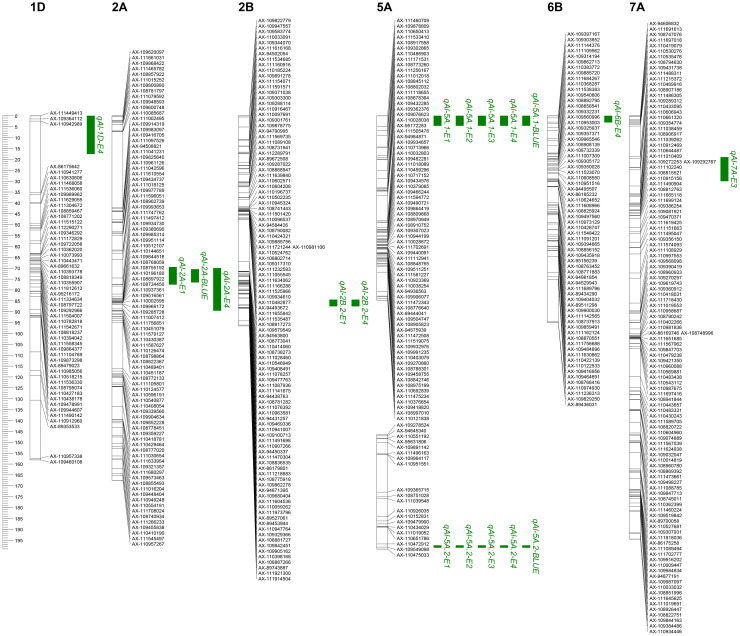
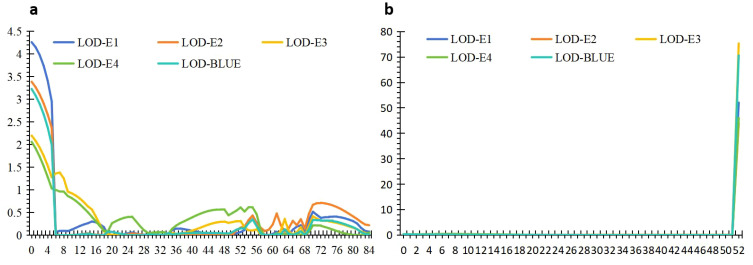
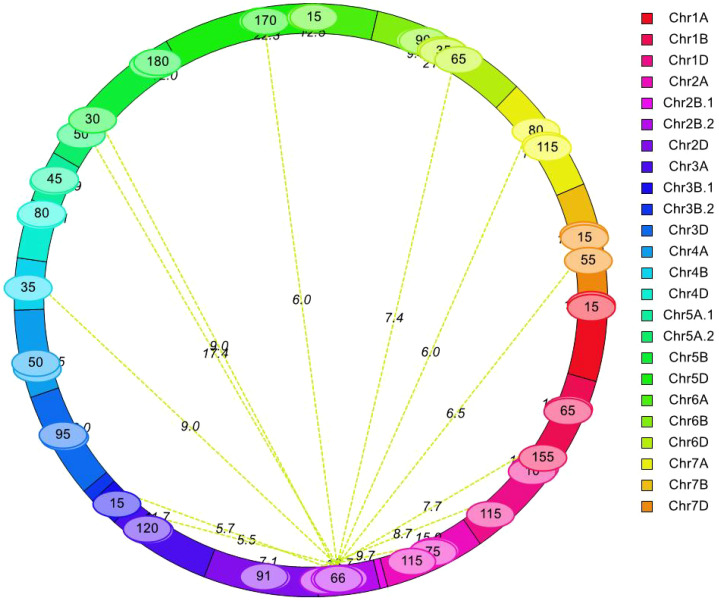
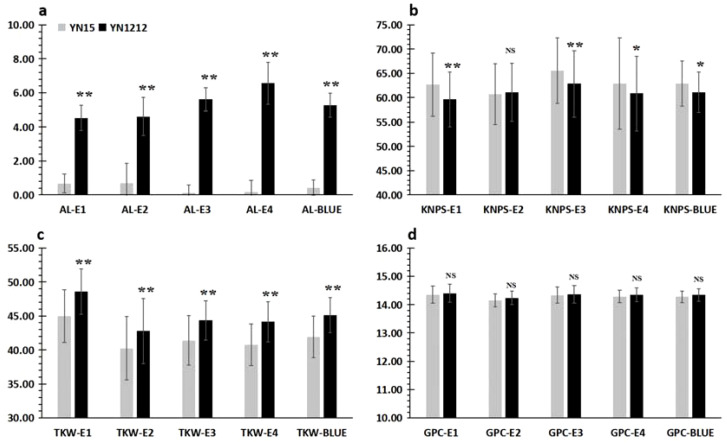
Results and discussion: Seven putative additive QTLs and 30 pairwise epistatic QTLs for AL were identified. Among them, five novel additive QTLs (except qAl-2A and qAl-5A.2) and 30 novel pairwise epistatic QTLs were identified. qAl-5A.1 was repeatedly identified in all five environment datasets, which was considered to be one novel stable QTL for AL with minor additive effects. eqAl-2B.2-2 significantly interacted with eight loci and could be of great importance in regulating awn development. The genes associated with the major stable QTL of qAl-5A.2 and the minor stable QTL of qAl-2A were B1 and WFZP-A, respectively. Awn lengths exhibited significant genetic correlations with kernel weight and kernels per spike, which could affect grain protein content to a lesser extent. This study enhances our understanding of the genetic basis of awn development and identifies novel genes as well as markers for future genetic improvement of wheat yield.
Keywords: QTL; awn length; genetic effects; kernel-related traits; wheat.
Copyright © 2024 Sun, Liu, Shi, Zhao, Ou, Song, Yang, Sun, Wu, Qin, Yuan, Jiao, Li and Cui.
Conflict of interest statement
The authors declare that the research was conducted in the absence of any commercial or financial relationships that could be construed as a potential conflict of interest.
Figures
Similar articles
-
Study of QTLs linked to awn length and their relationships with chloroplasts under control and saline environments in bread wheat.Genes Genomics. 2019 Feb;41(2):223-231. doi: 10.1007/s13258-018-0757-2. Epub 2018 Oct 30. Genes Genomics. 2019. PMID: 30378005
-
Quantitative trait loci detection for three tiller-related traits and the effects on wheat (Triticum aestivum L.) yields.Theor Appl Genet. 2024 Mar 21;137(4):87. doi: 10.1007/s00122-024-04589-x. Theor Appl Genet. 2024. PMID: 38512468
-
Genetic control of some plant growth characteristics of bread wheat (Triticum aestivum L.) under aluminum stress.Genes Genomics. 2020 Mar;42(3):245-261. doi: 10.1007/s13258-019-00895-7. Epub 2019 Dec 12. Genes Genomics. 2020. PMID: 31833049
-
Quick mapping and characterization of a co-located kernel length and thousand-kernel weight-related QTL in wheat.Theor Appl Genet. 2022 Aug;135(8):2849-2860. doi: 10.1007/s00122-022-04154-4. Epub 2022 Jul 8. Theor Appl Genet. 2022. PMID: 35804167 Review.
-
Identification and validation of new quantitative trait loci for spike-related traits in two RIL populations.Mol Breed. 2023 Jul 31;43(8):64. doi: 10.1007/s11032-023-01401-4. eCollection 2023 Aug. Mol Breed. 2023. PMID: 37533603 Free PMC article. Review.
Cited by
-
Characterization of a stable QTL for quality-related traits and its effects on yields in wheat (Triticum aestivum L.).Theor Appl Genet. 2025 Feb 26;138(3):56. doi: 10.1007/s00122-025-04852-9. Theor Appl Genet. 2025. PMID: 40000500
-
Conditional QTL Analysis and Fine Mapping for Thousand-Kernel Weight in Common Wheat.Plants (Basel). 2025 Jun 16;14(12):1848. doi: 10.3390/plants14121848. Plants (Basel). 2025. PMID: 40573836 Free PMC article.
References
-
- Ali M., Hussain M., Khan M., Ali Z., Zulkiffal M., Anwar J., et al. . (2010). Source-sink relationship between photosynthetic organs and grain yield attributes during grain filling stage in spring wheat (Triticum aestivum). Int. J. Agric. Biol. 12, 509–515. Available at: https://digitalcommons.memphis.edu/facpubs/14242.
LinkOut - more resources
Full Text Sources