

Correlation between the gut microbiota characteristics of hosts with severe acute pancreatitis and secondary intra-abdominal infection
- PMID: 39234039
- PMCID: PMC11371553
- DOI: 10.3389/fmed.2024.1409409
Correlation between the gut microbiota characteristics of hosts with severe acute pancreatitis and secondary intra-abdominal infection
Abstract
Objective: The objective of the study is to investigate the changes in the composition of intestinal microecology in severe acute pancreatitis (SAP) patients with or without intra-abdominal infection and also to analyze the expression of antibiotic resistance genes to provide evidence for early warning of infectious diseases and the rational use of antibiotics.
Methods: Twenty patients with SAP were enrolled in the study. According to whether the enrolled patients had a secondary intra-abdominal infection, they were divided into two groups, each consisting of 10 patients. Stool specimens were collected when the patients were admitted to the emergency intensive care unit (EICU), and nucleic acid extraction was performed. Next-generation gene sequencing was used to compare the differences in intestinal microflora diversity and drug resistance gene expression between the two groups.
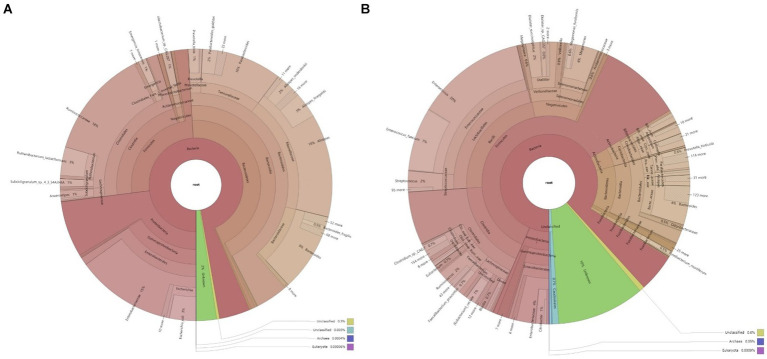
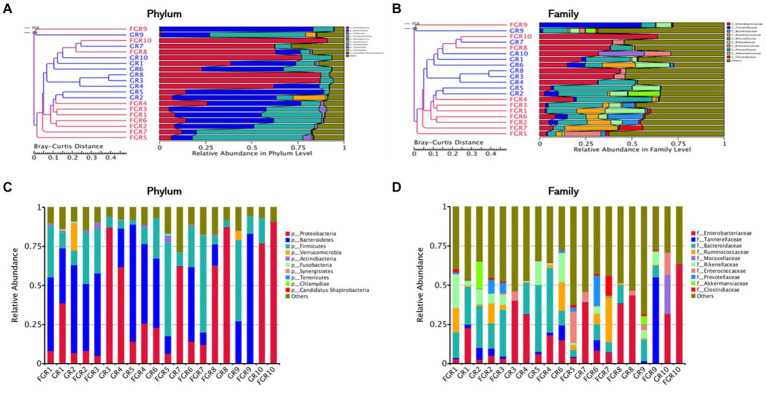
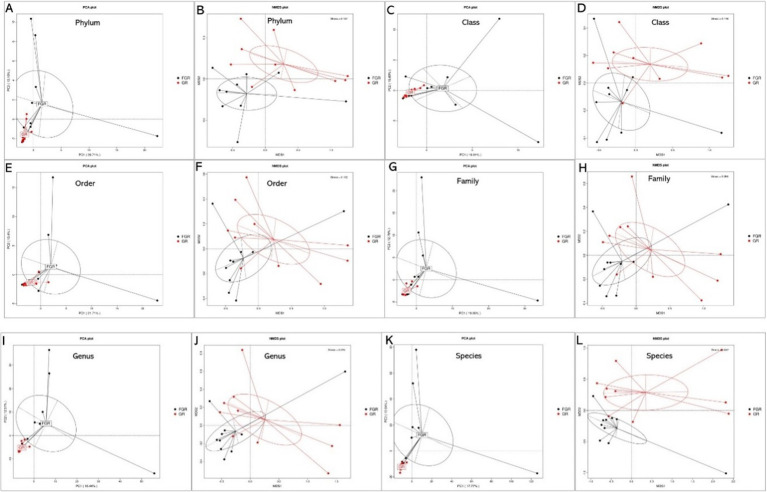
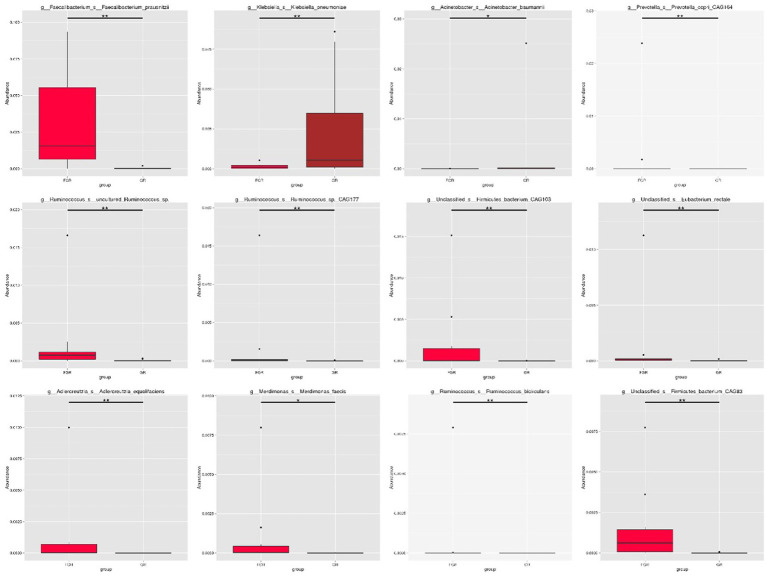
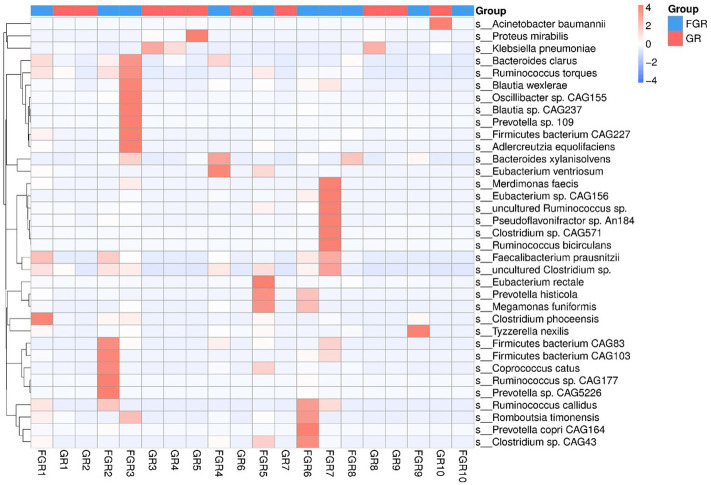
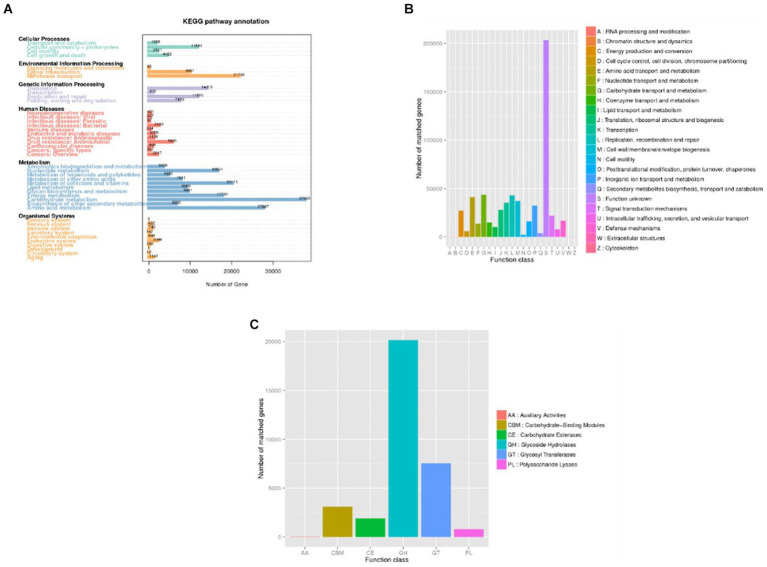
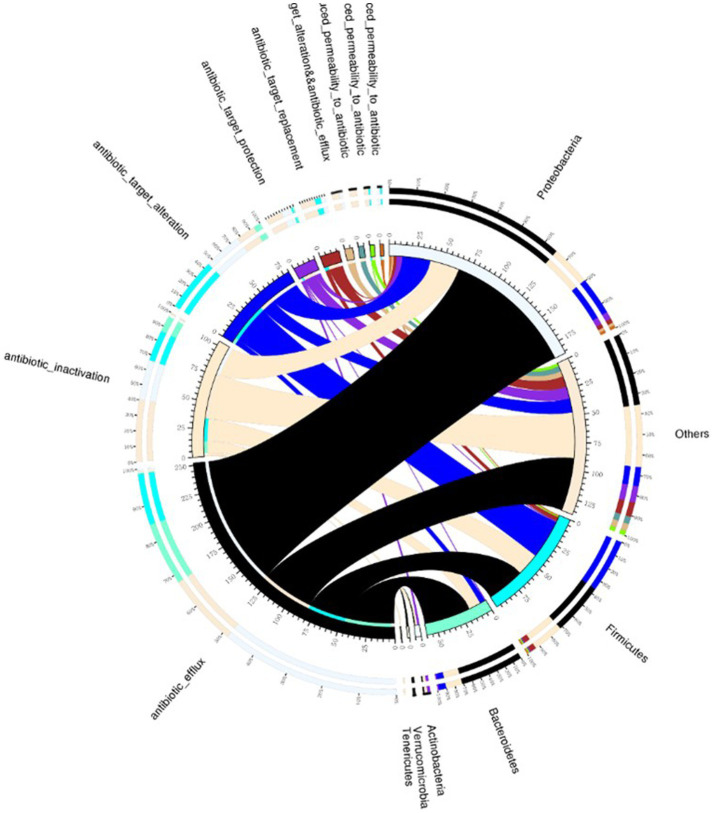
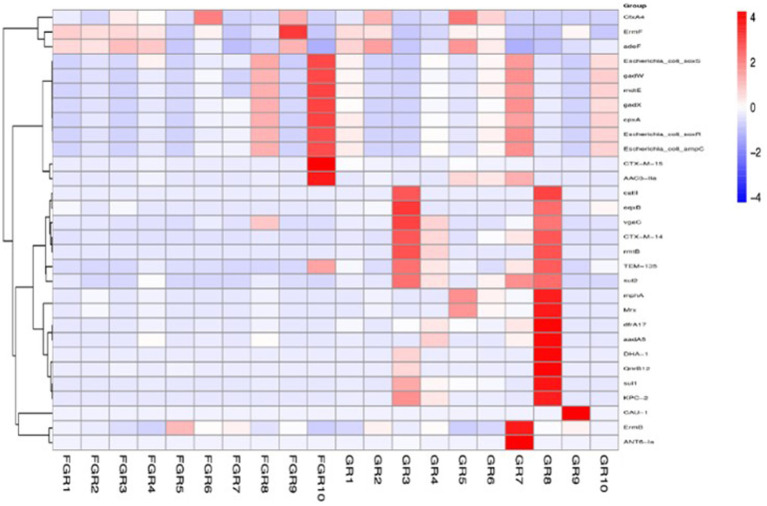
Results: The gut microbiota of patients in the infection group exhibited distribution on multiple clustered branches with some intra-group heterogeneity, and their flora diversity was compromised. The infected group showed an enrichment of various opportunistic bacteria in the gut microbiota, along with a high number of metabolic functions, stress functions to external signals, and genes associated with pathogenesis. Drug resistance genes were expressed in the gut microbiota of both groups, but their abundance was significantly lower in the non-infected group.
Conclusion: The intestinal microbiota of patients in the infection group exhibited distribution on multiple clustered branches with some intra-group heterogeneity, and their flora diversity was compromised. Additionally, drug resistance genes were expressed in the gut microbiota of both groups, although their abundance was significantly lower in the non-infected group.
Keywords: intensive care unit; intestinal microecology; intra-abdominal infection; metagenomic next-generation sequencing; severe acute pancreatitis.
Copyright © 2024 Wang, Zhang, Dai, Gao, Zhu and Yu.
Conflict of interest statement
The authors declare that the research was conducted in the absence of any commercial or financial relationships that could be construed as a potential conflict of interest.
Figures
Similar articles
-
Composition and functional profiles of gut microbiota reflect the treatment stage, severity, and etiology of acute pancreatitis.Microbiol Spectr. 2023 Sep 12;11(5):e0082923. doi: 10.1128/spectrum.00829-23. Online ahead of print. Microbiol Spectr. 2023. PMID: 37698429 Free PMC article.
-
[Analysis of intestinal patients' flora changes with severe pneumonia based on 16SrDNA sequencing technology].Zhonghua Wei Zhong Bing Ji Jiu Yi Xue. 2019 Dec;31(12):1479-1484. doi: 10.3760/cma.j.issn.2095-4352.2019.12.009. Zhonghua Wei Zhong Bing Ji Jiu Yi Xue. 2019. PMID: 32029033 Chinese.
-
[Analysis of the dynamic changes in gut microbiota in patients with extremely severe burns by 16S ribosomal RNA high-throughput sequencing technology].Zhonghua Shao Shang Za Zhi. 2020 Dec 20;36(12):1159-1166. doi: 10.3760/cma.j.cn501120-20200518-00271. Zhonghua Shao Shang Za Zhi. 2020. PMID: 33379852 Chinese.
-
Microbiota-Immune Interaction in the Pathogenesis of Gut-Derived Infection.Front Immunol. 2019 Aug 7;10:1873. doi: 10.3389/fimmu.2019.01873. eCollection 2019. Front Immunol. 2019. PMID: 31456801 Free PMC article. Review.
-
The role of the gut microbiome in colonization resistance and recurrent Clostridioides difficile infection.Therap Adv Gastroenterol. 2022 Nov 18;15:17562848221134396. doi: 10.1177/17562848221134396. eCollection 2022. Therap Adv Gastroenterol. 2022. PMID: 36425405 Free PMC article. Review.
References
-
- Zhang D, Li X, Wang Y, Zhao Y, Zhang H. The clinical importance of metagenomic next-generation sequencing in detecting disease-causing microorganisms in cases of sepsis acquired in the community or hospital setting. Front Microbiol. (2024) 15:1384166. doi: 10.3389/fmicb.2024.1384166, PMID: - DOI - PMC - PubMed
LinkOut - more resources
Full Text Sources
Miscellaneous