. 2024 Aug 21:12:1430920.
doi: 10.3389/fpubh.2024.1430920. eCollection 2024.

Increasing situational awareness through nowcasting of the reproduction number

Affiliations

Increasing situational awareness through nowcasting of the reproduction number

Andrea Bizzotto et al. Front Public Health. .

Abstract

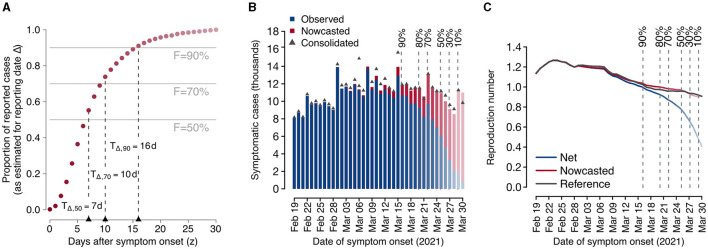
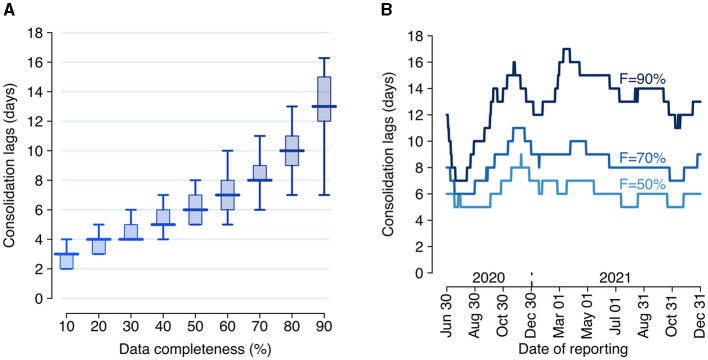
Background: The time-varying reproduction number R is a critical variable for situational awareness during infectious disease outbreaks; however, delays between infection and reporting of cases hinder its accurate estimation in real-time. A number of nowcasting methods, leveraging available information on data consolidation delays, have been proposed to mitigate this problem.

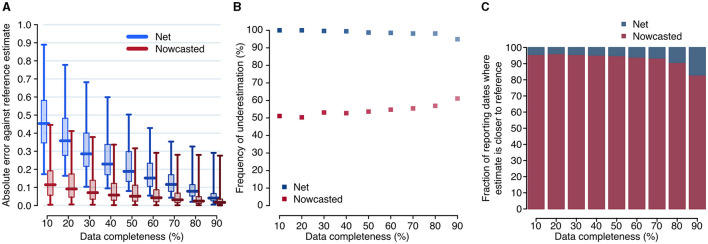
Methods: In this work, we retrospectively validate the use of a nowcasting algorithm during 18 months of the COVID-19 pandemic in Italy by quantitatively assessing its performance against standard methods for the estimation of R.

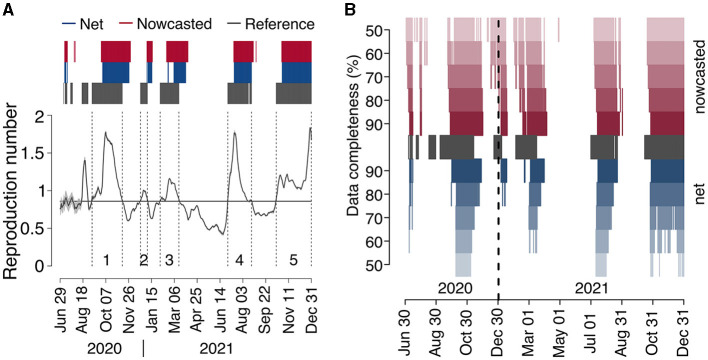
Results: Nowcasting significantly reduced the median lag in the estimation of R from 13 to 8 days, while concurrently enhancing accuracy. Furthermore, it allowed the detection of periods of epidemic growth with a lead of between 6 and 23 days.

Conclusions: Nowcasting augments epidemic awareness, empowering better informed public health responses.

Keywords: epidemic surveillance; nowcasting; outbreaks; reproduction number; situational awareness.


Conflict of interest statement

The authors declare that the research was conducted in the absence of any commercial or financial relationships that could be construed as a potential conflict of interest. The author(s) declared that they were an editorial board member of Frontiers, at the time of submission. This had no impact on the peer review process and the final decision.

Figures

Figure 1
Figure 1
Example of application of the proposed nowcasting technique using data from the Italian COVID-19 integrated surveillance system for a selected reporting date (Δ = April 1, 2021). (A) Estimated consolidation distribution and corresponding consolidation lags. Dark red dots represent the estimated consolidation distribution at Δ. Horizontal lines define selected completeness thresholds (50, 70, and 90%) and vertical lines define the corresponding consolidation lags. (B) Observed and nowcasted epidemic curves by date of symptom onset. The consolidated epidemic curve is shown as dark gray triangles. Vertical dashed lines show the dates at which the observed number of cases is estimated to have reached a given completeness value. Bars in the epidemic curve are reported in fading colors with a level of darkness proportional to the estimated completeness. (C) Mean estimates of the net, nowcasted, and reference reproduction numbers over time. Vertical dashed lines show the dates at which the observed number of cases is estimated to have reached a given completeness value. The level of darkness in line colors is proportional to the estimated completeness.
Figure 2
Figure 2
Consolidation lags for the Italian COVID-19 integrated surveillance system. (A) Distribution of the consolidation lag across the estimation period (June 29, 2020–December 31, 2021) for different values of completeness. Boxplots show the median (horizontal line), interquartile range (rectangle) and 95% quantiles (whiskers) over the n = 551 reporting dates. (B) Consolidation lags at different reporting dates as estimated for three selected values of completeness F.
Figure 3
Figure 3
Accuracy of the net and nowcasted reproduction numbers. (A) Distributions of the absolute error between the reference reproduction number and the net and nowcasted reproduction numbers, computed at different reporting dates (daily between June 29, 2020, and December 31, 2021), and evaluated at the date corresponding to a specified level of completeness. Boxplots show the median (horizontal line), interquartile range (rectangle) and 95% quantiles (whiskers). (B) Fraction of reporting dates for which the net and nowcasted estimates of the reproduction number underestimate the reference value. (C) Fraction of reporting dates for which either estimate is the closest one to the reference value, for different values of completeness.
Figure 4
Figure 4
COVID-19 epidemic periods in Italy (2020–2021). (A) Reference reproduction number by date of symptom onset, as computed from consolidated data reported on April 5, 2023 (solid black line). The gray shaded area around the reference reproduction number (visible only in the period May–August 2020, due to the low number of cases contributing to R estimates) represents the 95% CI in its estimate. Dark gray bars above the graph highlight the days where the reference reproduction number was above 1, and dark gray vertical dashed lines delimit epidemic periods (see Table 1), labeled with a progressive number just above the x-axis. Blue and red bars identify the dates of reporting for which the net and nowcasted reproduction numbers, respectively, estimated at the nearest date afforded by a completeness of 90%, were above 1. (B) Dates where the reference reproduction number was above 1 (dark gray), and dates of reporting for which the net and nowcasted reproduction numbers, estimated at the nearest date afforded by a completeness between 50 and 90%, were above 1 (red and blue).

Similar articles

References

    1. Nash RK, Nouvellet P, Cori A. Real-time estimation of the epidemic reproduction number: scoping review of the applications and challenges. PLOS Digit Health. (2022) 1:e0000052. 10.1371/journal.pdig.0000052 - DOI - PMC - PubMed
    1. Cori A, Ferguson NM, Fraser C, Cauchemez S. A new framework and software to estimate time-varying reproduction numbers during epidemics. Am J Epidemiol. (2013) 178:1505–12. 10.1093/aje/kwt133 - DOI - PMC - PubMed
    1. Thompson RN, Stockwin JE, van Gaalen RD, Polonsky JA, Kamvar ZN, Demarsh PA, et al. Improved inference of time-varying reproduction numbers during infectious disease outbreaks. Epidemics. (2019) 29:100356. 10.1016/j.epidem.2019.100356 - DOI - PMC - PubMed
    1. O'Driscoll M, Harry C, Donnelly CA, Cori A, Dorigatti I. A comparative analysis of statistical methods to estimate the reproduction number in emerging epidemics, with implications for the current coronavirus disease 2019 (COVID-19) pandemic. Clin Infect Dis. (2021) 73:e215–23. 10.1093/cid/ciaa1599 - DOI - PMC - PubMed
    1. Zhang J, Litvinova M, Wang W, Wang Y, Deng X, Chen X, et al. Evolving epidemiology and transmission dynamics of coronavirus disease 2019 outside Hubei province, China: a descriptive and modelling study. Lancet Infect Dis. (2020) 20:793–802. 10.1016/S1473-3099(20)30230-9 - DOI - PMC - PubMed

LinkOut - more resources