. 2024 Aug 21:15:1444424.
doi: 10.3389/fimmu.2024.1444424. eCollection 2024.

Dissociation of LAG-3 inhibitory cluster from TCR microcluster by immune checkpoint blockade

Affiliations

Dissociation of LAG-3 inhibitory cluster from TCR microcluster by immune checkpoint blockade

Akiko Hashimoto-Tane et al. Front Immunol. .

Abstract

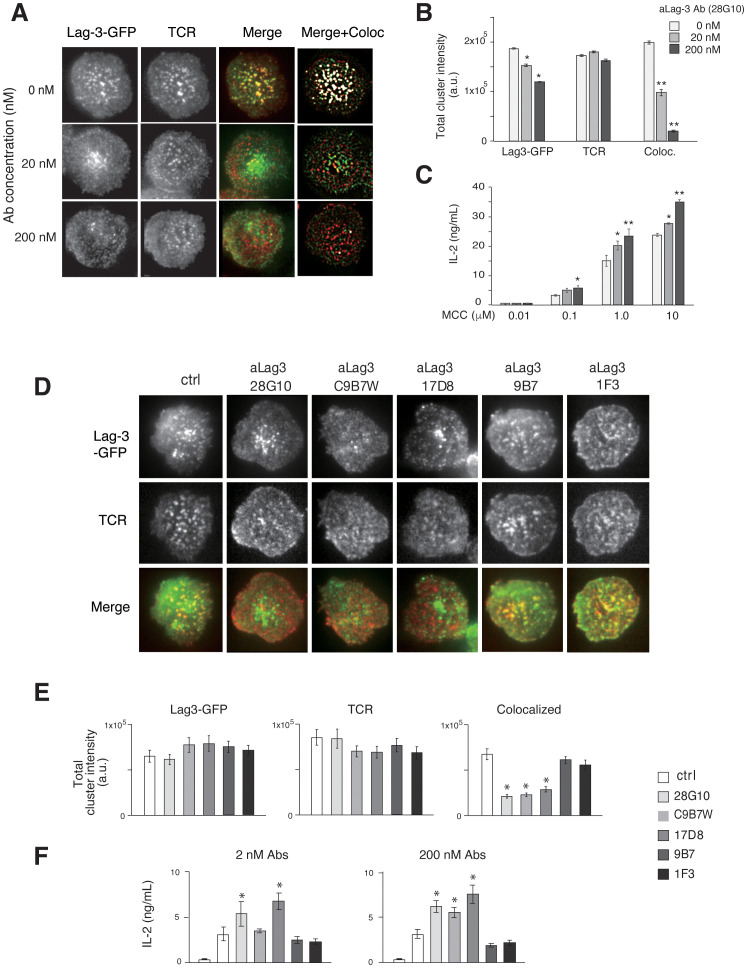
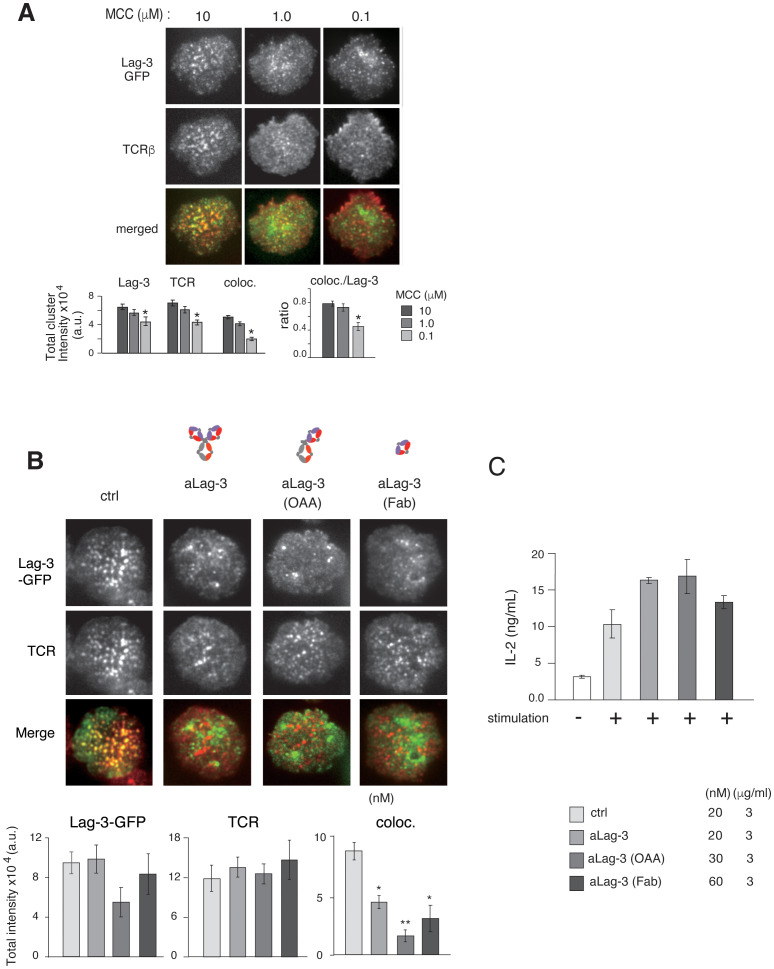
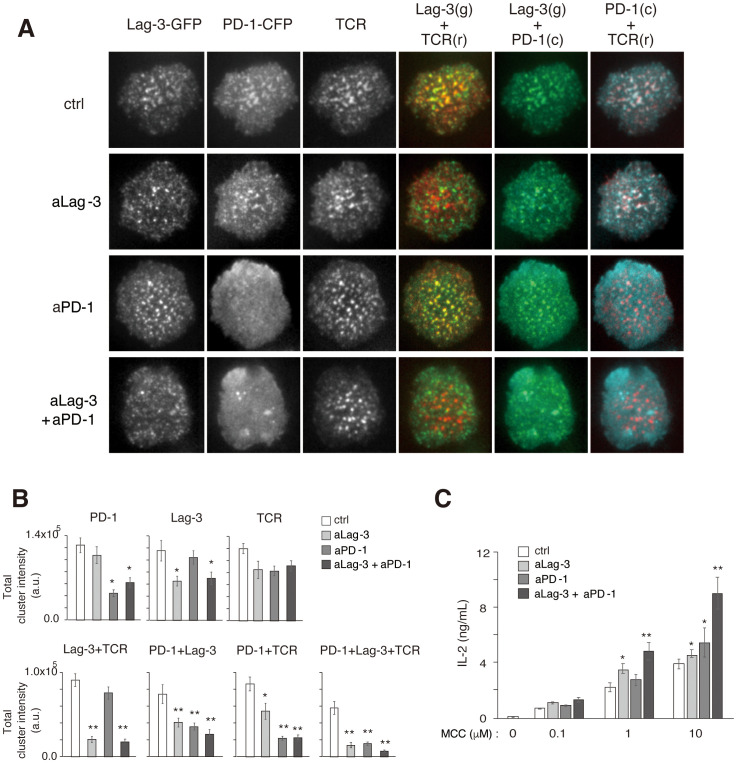
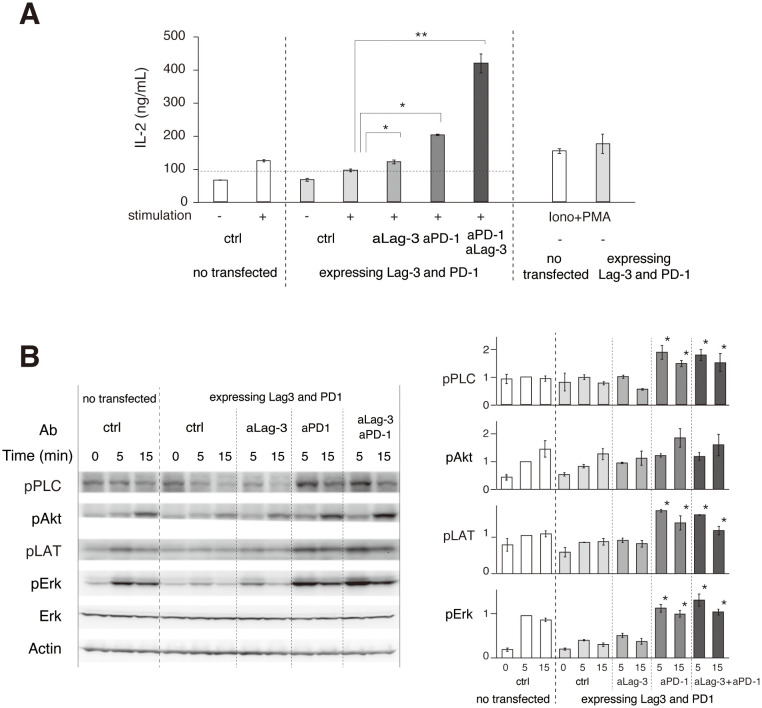
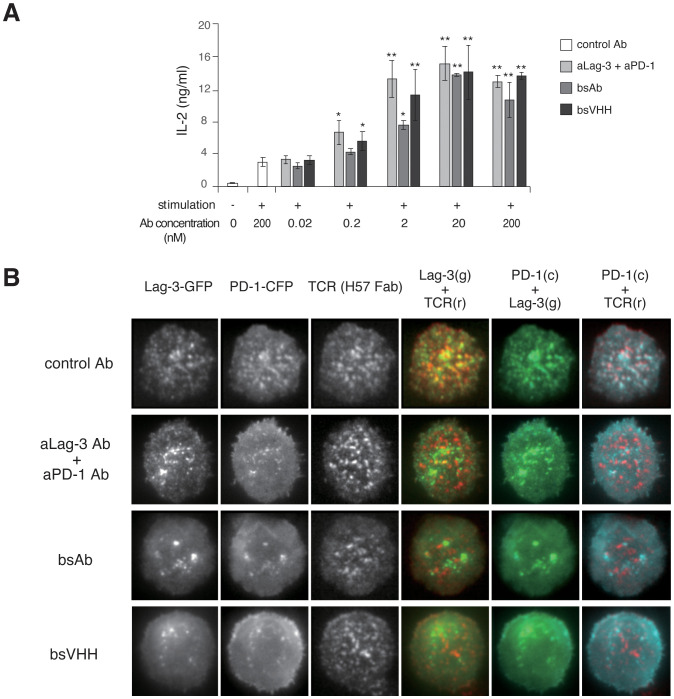
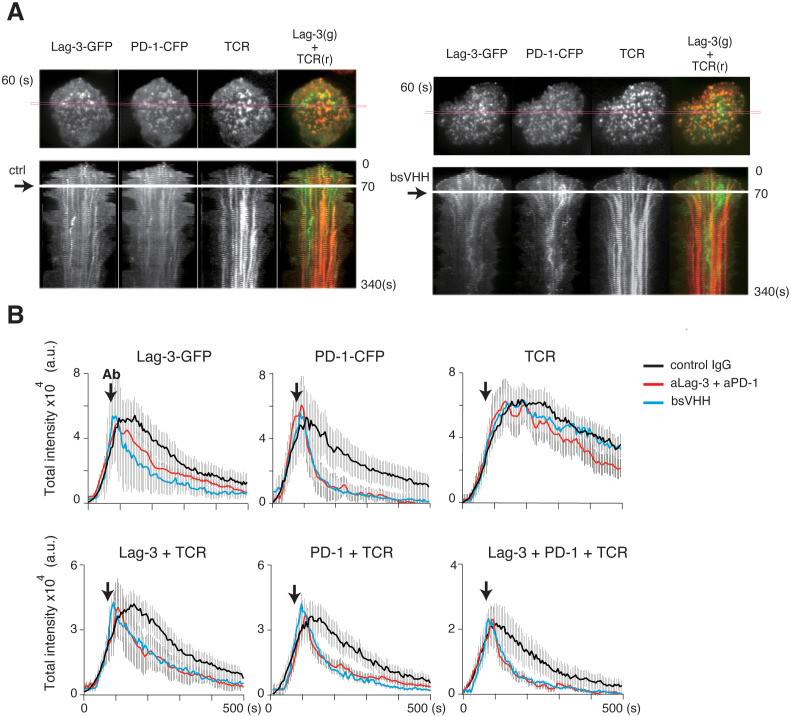
Lymphocyte activation gene (Lag)-3 is an inhibitory co-receptor and target of immune checkpoint inhibitor (ICI) therapy for cancer. The dynamic behavior of Lag-3 was analyzed at the immune synapse upon T-cell activation to elucidate the Lag-3 inhibitory mechanism. Lag-3 formed clusters and co-localized with T-cell receptor microcluster (TCR-MC) upon T-cell activation similar to PD-1. Lag-3 blocking antibodies (Abs) inhibited the co-localization between Lag-3 and TCR-MC without inhibiting Lag-3 cluster formation. Lag-3 also inhibited MHC-II-independent stimulation and Lag-3 Ab, which did not block MHC-II binding could still block Lag-3's inhibitory function, suggesting that the Lag-3 Ab blocks the Lag-3 inhibitory signal by dissociating the co-assembly of TCR-MC and Lag-3 clusters. Consistent with the combination benefit of PD-1 and Lag-3 Abs to augment T-cell responses, bispecific Lag-3/PD-1 antagonists effectively inhibited both cluster formation and co-localization of PD-1 and Lag-3 with TCR-MC. Therefore, Lag-3 inhibits T-cell activation at TCR-MC, and the target of Lag-3 ICI is to dissociate the co-localization of Lag-3 with TCR-MC.

Keywords: LAG-3; PD-1; T cell activation; TCR microcluster; immune checkpoint blockade; inhibitory co-receptor.


Conflict of interest statement

EB and RWM were employed by Merck Sharp & Dohme LLC, a subsidiary of Merck & Co., Inc., Rahway, NJ, USA, during the course of this research work. The remaining authors declare that the research was conducted in the absence of any commercial or financial relationships that could be construed as a potential conflict of interest.

Figures

Figure 1
Figure 1
Lag-3 forms clusters co-localized with TCR-MCs. (A) T cells from AND-tg/Lag-3 KO mice expressing Lag-3-GFP were incubated with MCC(K99A) peptide-loaded APC for 10 min and fixed. The images from side of conjugated cells were taken by confocal microscopy. Representative images of Lag-3-GFP (green), TCR stained by aCD3ε Ab (red), and merged, and the bright field (BF) revealed Lag-3 accumulation at immune synapse. (B) Lag-3-GFP-expressing AND-tg T cells were analyzed on planer bilayer, and the TIRF images every 10 sec (s) are shown. Lag-3-GFP formed clusters and co-localized with TCR-MCs (TCRβ). Single-colored clusters in panels (B, D, F) are expressed in gray for better resolution. (C) The total cluster intensity, a metric derived from cluster number and each cluster’s intensity, is plotted as a function of time for the images in panel (B) Lag-3-GFP is shown in green and TCRβ in red, and yellow denotes overlapping co-association. (D) 2D12 T-cell hybridoma cells expressing Lag3(ΔCP)-GFP were stained with H57 for TCR. Left: the images of Lag-3(ΔCP)-GFP (green) and TCR (red), merged on planer bilayer, are shown. Lag-3(ΔCP)-GFP showed intact cluster formation and co-localization with TCR-MCs. Right: statistical analysis of the peak total cluster intensity values, Lag-3-GFP, TCR, and co-localized clusters for Lag-3-GFP (gray) and Lag3(ΔCP)-GFP (black) are plotted. (E) IL-2 production from Lag-3-GFP or Lag-3(ΔCP)-GFP expressing 2D12 hybridoma cells. The cells were stimulated with 10 μM MCC peptide-pulsed DC-1 cells or PMA plus ionophore for 24 hours. Experiments were performed in triplicate, and the average ± SD is shown. **p < 0.01. Single-colored clusters in panels (B, D) as well as Figures 2A, D , 3A , 4A , 6B . Supplementary Figure 4A is expressed in gray for better resolution. TCR-MCs, T-cell receptor microclusters; APC, antigen-presenting cell; TIRF, total internal reflection fluorescence microscopy; MCC, moth cytochrome c; PMA, phorbol myristate acetate; Ab, antibody.
Figure 2
Figure 2
Effects of aLag-3 blocking Abs on Lag-3 cluster formation. (A) The Lag-3-GFP expressing AND-tg/Lag-3 KO T cells were pre-incubated with 20 nM or 200 nM aLag-3 Ab (28G10) and examined on planer bilayers. The representative images of Lag-3-GFP (green) and TCR (red), merged, and background subtracted merged with co-localized (with TCR-MC) image (white) at 60 sec after activation started are shown. (B) The peak value of total cluster intensity in T cells from panel (A) is plotted. (C) IL-2 production by naïve AND-tg T cells stimulated by graded concentrations (0.01 μM to 10 μM) of MCC and APC in the presence or absence of aLag-3 Ab at 48 hours are plotted. (D–F) Lag-3-GFP expressing AND-tg T cells were treated with a panel of aLag-3 Abs (28G10, C9B7W, 1F3, 9B7, and 17D8). (D) Representative images of Lag-3 cluster and TCR-MC formation after Abs were added at time 0, and the images were taken 60 sec after activation. (E) The peak value of total cluster intensities of panel (D) is plotted. (F) IL-2 production by T cells at 48 hours in the presence of aLag-3 Abs is shown. The leftmost columns represent unstimulated conditions. Experiments in panels (C, F) were performed in triplicate, and the average ± SD is shown. * and ** mean p < 0.1 and 0.01. aLag-3, anti-Lag-3; Abs, antibodies; TCR, T-cell receptor; TCR-MC, T-cell receptor microcluster; MCC, moth cytochrome c; APC, antigen-presenting cell.
Figure 3
Figure 3
Inhibitory function of various forms of aLag-3 Ab on cluster formation. (A) Effects of Ag concentration. Top: the images of Lag-3-GFP (green) and TCR (red) of AND-tg/Lag-3 KO T cells on the planer bilayers loaded with constant amount of MHC-II (I-Ek) (200 molecules/μm2) and increasing Ag peptide concentrations from 100 nM to 10 μM. Bottom: the results of statistical analysis. The “coloc./Lag-3” ratio was calculated by dividing co-localized cluster intensity by Lag-3-GFP intensity and indicates the efficiency of co-localization of Lag-3-GFP with TCR-MC depending on TCR stimulation strength. Experiments were performed in triplicate, and the average ± SD is shown. * and ** mean p < 0.1 and 0.01, respectively. (B) Lag-3-GFP expressing AND-tg T cells were pre-incubated with 20 nM for each control Ab or various aLag-3 Ab formats [i.e., conventional bivalent Ab, monovalent one-armed Ab (OAA), and monovalent Fab]. Images of cluster formation were taken on planer bilayer, and peak value of total cluster intensities is plotted. (C) IL-2 production by naïve AND-tg T cells stimulated by 10 μM MCC plus APC with or without various aLag-3 Ab formats at 48 hours is shown. aLag-3, anti-Lag-3; Ab, antibody; TCR, T-cell receptor; TCR-MC, T-cell receptor microcluster; MCC, moth cytochrome c; APC, antigen-presenting cell.
Figure 4
Figure 4
Simultaneous analysis of Lag-3, PD-1, and TCR cluster formation. (A) Representative images of Lag-3-GFP, PD-1-CFP, TCR, co-localization of Lag-3-GFP and TCR, co-localization of PD-1-CFP and TCR, and co-localization of PD-1-CFP and Lag-3-GFP following treatment with control IgG (ctrl), aLag-3 Ab (28G10), aPD-1 Ab (DX400), or the cocktail of aLag-3 Ab and aPD-1 Ab (20 nM) are shown. (B) The peak values of total cluster intensities of the images in panel (A) are plotted. (C) IL-2 production by naïve AND-tg T cells upon stimulation with MCC (0 μM, 0.1 μM, 1 μM, or 10 μM) and APC in the presence of 20 nM of control IgG (ctrl IgG), aLag-3, aPD-1, or the cocktail of aLag-3 and aPD-1 Abs (20 nM each) for 48 hours are shown. Experiments were performed in triplicate, and the average ± SD is shown. * and ** mean p < 0.1 and 0.01, respectively, using Student’s t-test. The cocktail showed combination-enhancing effects. TCR, T-cell receptor; MCC, moth cytochrome c; APC, antigen-presenting cell.
Figure 5
Figure 5
Biochemical effects of aLag-3 and aPD-1 Ab treatment. (A) 2D12 T-cell hybridomas expressing Lag-3 and PD-1 were stimulated with MCC peptide and DC-1 cells with or without addition of 20 nM of control Ab (ctrl), aLag-3 (28G10), aPD-1 (DX400), the cocktail of aLag-3 and aPD-1 Abs, or PMA plus ionophore (Iono+PMA). IL-2 production in the culture supernatant after 24 hours was measured. (B) 2D12 T-cell hybridoma expressing Lag-3 and PD-1 was stimulated with MCC peptide, and DC-1 cells with or without blocking Abs were lysed at the indicated time after stimulation. Tyrosine phosphorylation levels were analyzed by Western blotting using indicated anti-phospho-tyrosine Abs. The quantitation of the blots is shown on the right. * and ** mean p < 0.1 and 0.01, respectively. MCC, moth cytochrome c; Ab, antibody; PMA, phorbol myristate acetate.
Figure 6
Figure 6
Effects of bispecific Lag-3/PD-1 Abs on Lag-3 and PD-1 cluster formation and function. (A) Naïve AND-tg T cells were stimulated with MCC and DC-1 cells with or without control IgG, the cocktail of aLag-3 and aPD-1 Abs, bsAb, or bsVHH. IL-2 production in the culture supernatant after 24 hours was measured. * and ** mean p < 0.1 and 0.01, respectively. (B) Representative images of AND-tg T cells co-expressing Lag-3-GFP, PD-1-CFP, and TCR upon Ag stimulation on planar bilayer in the presence of control Ab, the cocktail of aLag-3 and aPD-1 Abs, bsAb, or bsVHH are shown. Abs, antibodies; MCC, moth cytochrome c; TCR, T-cell receptor.
Figure 7
Figure 7
Immediate effects of blocking Abs after starting TCR activation. AND-tg T cells expressing Lag-3-GFP and PD-1-CFP were stimulated with Ag peptide on planar bilayer in the presence of control IgG (ctrl), the cocktail of aLag-3 and aPD-1 Abs, or Lag-3/PD-1 bsVHH, which were added at 60 seconds after initial cluster formation (arrow). (A) Representative images of Lag-3-GFP, PD-1-CFP, and TCR around 60 sec after stimulation (upper) and their time-dependent kymographs at the indicated cross-section of the cell (magenta square) after adding control Ab (ctrl) or bsVHH are shown (lower). (B) Statistical analysis of Figure 6A ; the total cluster intensities of Lag-3-GFP, PD-1-CFP, TCR, co-localized clusters of Lag-3 and TCR, PD-1 and TCR, and triple co-localized clusters (Lag-3+PD-1+TCR) are plotted versus time. Abs, antibodies; TCR, T-cell receptor.

References

    1. Hegde PS, Chen DS. Top 10 challenges in cancer immunotherapy. Immunity. (2020) 52:17–35. doi: 10.1016/j.immuni.2019.12.011 - DOI - PubMed
    1. Barber DL, Wherry EJ, Masopust D, Zhu B, Allison JP, Sharpe AH, et al. . Restoring function in exhausted CD8 T cells during chronic viral infection. Nature. (2006) 439:682–7. doi: 10.1038/nature04444 - DOI - PubMed
    1. Held W, Siddiqui I, Schaeuble K, Speiser DE. Intra-tumoral CD8+ T cells with stem-like properties: Implications for cancer immunotherapy. Sci Transl Med. (2019) 11:eaay6863. doi: 10.1126/scitranslmed.aay6863 - DOI - PubMed
    1. Marrone KA, Ying W, Naidoo J. Immune-related adverse events from immune checkpoint inhibitors. Clin Pharmacol Ther. (2016) 100:242–51. doi: 10.1002/cpt.394 - DOI - PubMed
    1. Pitt JM, Vétizou M, Daillère R, Roberti MP, Yamazaki T, Routy B, et al. . Resistance mechanisms to immune-checkpoint blockade in cancer: tumor-intrinsic and -extrinsic factors. Immunity. (2016) 44:1255–69. doi: 10.1016/j.immuni.2016.06.001 - DOI - PubMed

MeSH terms

Substances

LinkOut - more resources