. 2024 Jul 31;32(3):101311.
doi: 10.1016/j.omtm.2024.101311. eCollection 2024 Sep 12.

A cellular disease model toward gene therapy of TGM1-dependent lamellar ichthyosis

Affiliations

A cellular disease model toward gene therapy of TGM1-dependent lamellar ichthyosis

Laura Sercia et al. Mol Ther Methods Clin Dev. .

Abstract

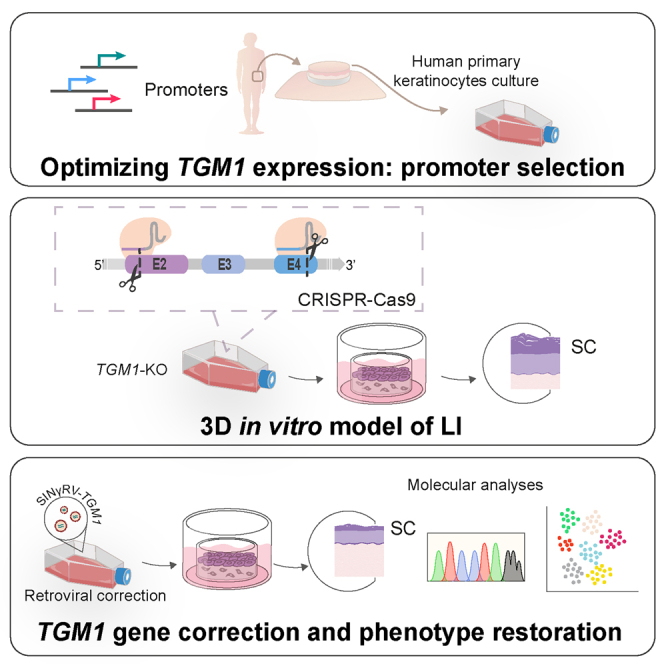
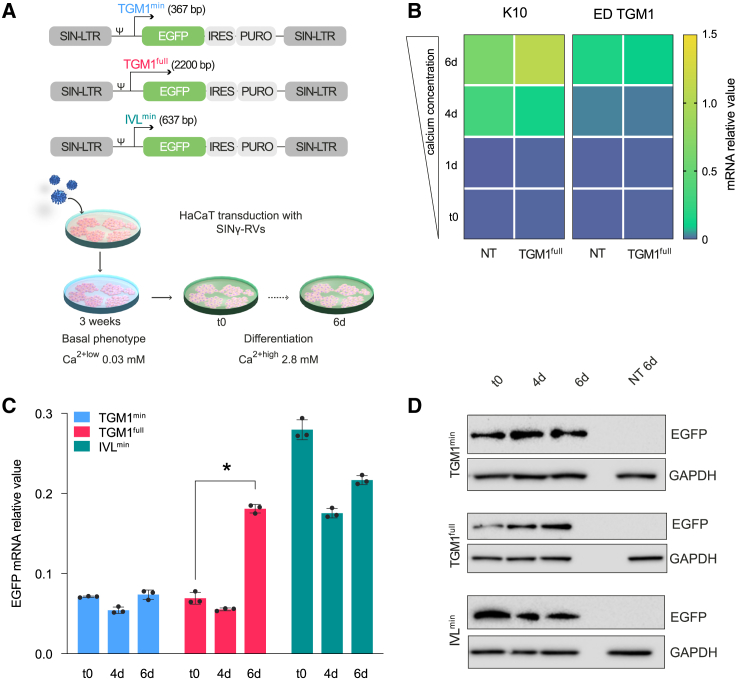
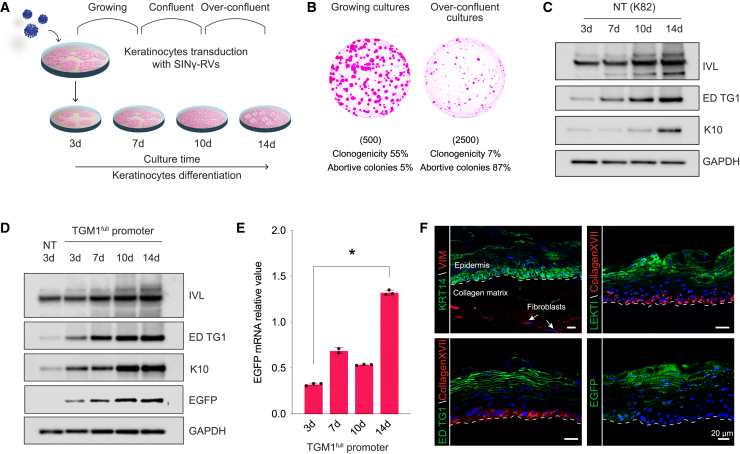
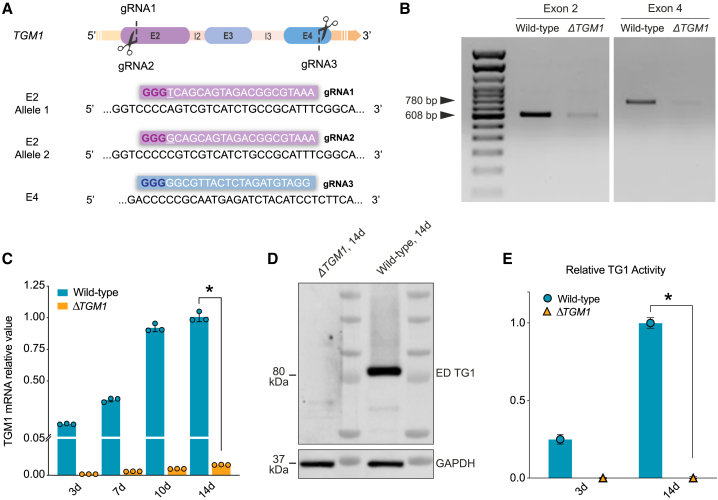
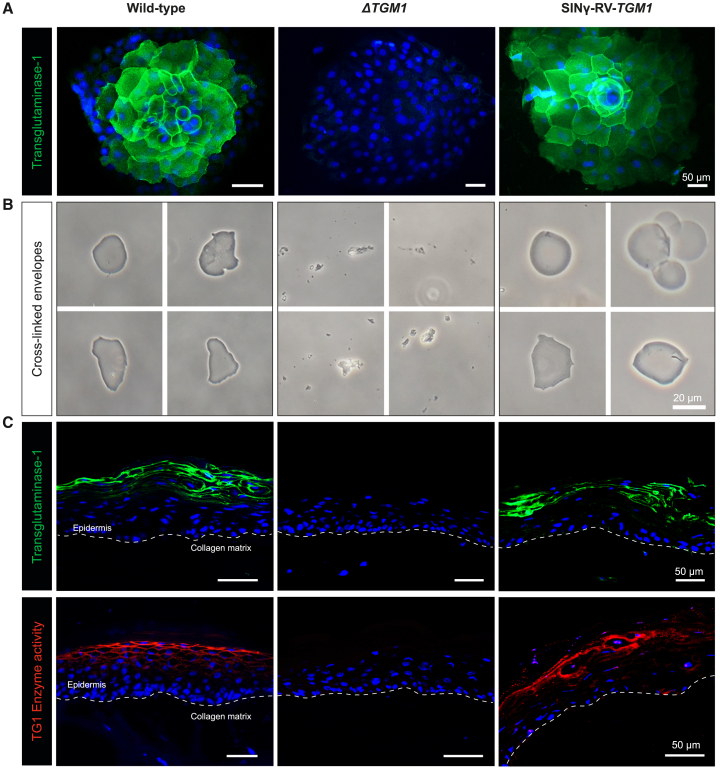
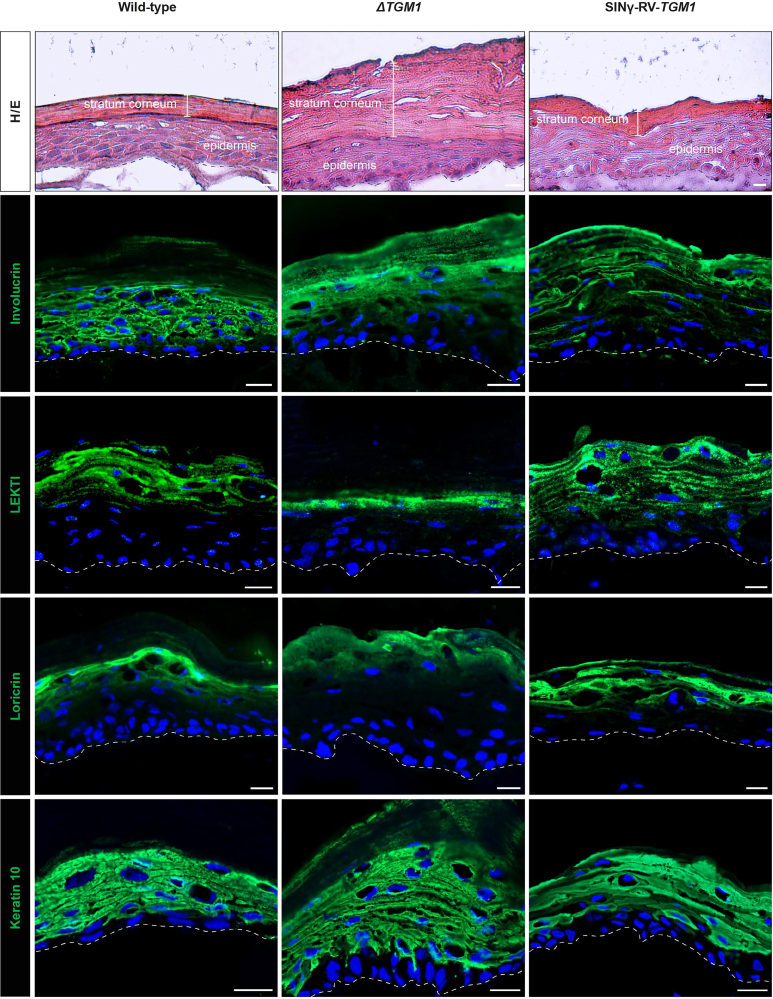
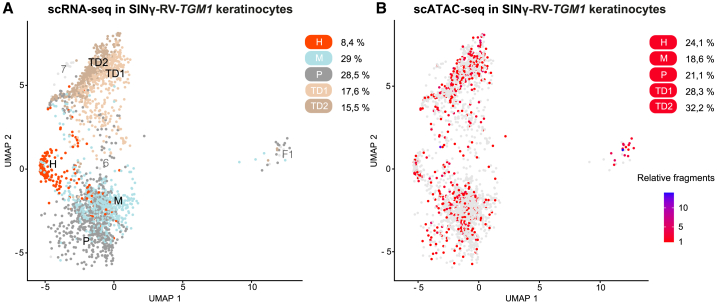
Lamellar ichthyosis (LI) is a chronic disease, mostly caused by mutations in the TGM1 gene, marked by impaired skin barrier formation. No definitive therapies are available, and current treatments aim at symptomatic relief. LI mouse models often fail to faithfully replicate the clinical and histopathological features of human skin conditions. To develop advanced therapeutic approaches, such as combined ex vivo cell and gene therapy, we established a human cellular model of LI by efficient CRISPR-Cas9-mediated gene ablation of the TGM1 gene in human primary clonogenic keratinocytes. Gene-edited cells showed complete absence of transglutaminase 1 (TG1) expression and recapitulated a hyperkeratotic phenotype with most of the molecular hallmarks of LI in vitro. Using a self-inactivating γ-retroviral (SINγ-RV) vector expressing transgenic TGM1 under the control of its own promoter, we tested an ex vivo gene therapy approach and validate the model of LI as a platform for pre-clinical evaluation studies. Gene-corrected TGM1-null keratinocytes displayed proper TG1 expression, enzymatic activity, and cornified envelope formation and, hence, restored proper epidermal architecture. Single-cell multiomics analysis demonstrated proviral integrations in holoclone-forming epidermal stem cells, which are crucial for epidermal regeneration. This study serves as a proof of concept for assessing the potential of this therapeutic approach in treating TGM1-dependent LI.

Keywords: 3D skin equivalent; CRISPR-Cas9; TGM1; gene therapy; lamellar ichthyosis; multiomics analysis; primary human keratinocytes; regenerative medicine.


Conflict of interest statement

M.D.L. is a consultant for J-TEC-Japan Tissue Engineering, Ltd.

Figures

None
Graphical abstract
Figure 1
Figure 1
Differentiation-related expression of EGFP in HaCaT cells transduced with SINγ-RVs (A) Top: schematic of self-inactivating γ-retroviral vectors (SINγ-RVs) carrying the three different promoters that drive the expression of the bicistronic gene encoding EGFP and puromycin resistance. Bottom: graphic of the HaCaT differentiation protocol. (B) K10 (left) and endogenous TGM1 (ED TGM1) (right) relative mRNA expression in non-transduced (NT) and transduced (TGM1full) HaCaT cells, grown in low calcium (t0) and high calcium for 1, 4, and 6 days. GAPDH mRNA was used to normalize the RT-PCR. (C) RT-qPCR quantification of the relative mRNA expression value of EGFP. GAPDH mRNA was used to normalize the RT-PCR (∗p < 0.0001). (D) Western blot analysis of EGFP expression in low-calcium (t0) and high-calcium culture conditions for 4 or 6 days of cultivation. NT HaCaT cells 6 days after calcium addition are loaded as a reference sample. t0: time zero.
Figure 2
Figure 2
The TGM1full promoter drives EGFP expression in primary differentiated human keratinocytes (A) Schematic of the in vitro keratinocyte differentiation experimental design. (B) Representative colony-forming efficiency (CFE) of keratinocyte cultures in growing (left) (d7) and over-confluent (right) culture conditions (d14). The number of cells per dish plated in the CFE condition is indicated in brackets. Colonies were stained with Rhodamine B after 12 days of cultivation. (C) Western blot analysis of keratinocyte differentiation markers (IVL, endogenous TG1, and K10) in growing (3-day), confluent (7- to 10-day), and over-confluent (14-day) normal, healthy keratinocytes (K82). (D) Western blot analysis of keratinocyte differentiation markers (IVL, endogenous TG1, and K10) and EGFP in growing (3-day), confluent (7- to 10-day), and over-confluent (14-day) K82 keratinocytes transduced with a SINγ-RV carrying EGFP under the control of the TGM1full promoter. (E) Progressive (3- to 14-day) increase of EGFP mRNA during transgenic keratinocyte differentiation and stratification. GAPDH mRNA was used to normalize the RT-qPCR (p < 0.0001). (F) Representative immunofluorescence images of 7-μm-thick cryosections of 3D SEs obtained with TGM1full promoter-transduced keratinocytes, showing the expression of differentiation markers (endogenous TG1 and LEKTI) in the upper layers of the epidermis and collagen XVII and KRT14 as markers of the epidermal basal layer (n = 3, pictures are representative of what was observed in at least three independent samples or replicates). The EGFP fluorescent signal is properly restricted to the granular layer of the epidermis. White arrows indicate the presence of living fibroblasts inside the collagen matrix, expressing vimentin. A white dotted line marks the epidermal-dermal junction. DAPI (blue) stains nuclei. Scale bars, 20 μm. LEKTI, lympho-epithelial Kazal-type-related inhibitor; KRT14, cytokeratin 14; VIM, vimentin.
Figure 3
Figure 3
Generation of the ΔTGM1 human cellular model (A) TGM1 KO strategy design. gRNA1 and gRNA2 target E2, while gRNA3 targets E4 of the TGM1 gene. gRNA1 and gRNA2 differ in 1 nt (underlined), allowing targeting of both alleles, exploiting the presence of a SNP in a wild-type strain (K81). gRNA sequences are enclosed in colored boxes, with the protospacer adjacent motif (PAM) shown in bold. (B) PCR analysis on both edited exons performed on genomic DNA from wild-type keratinocytes (K81) and ΔTGM1-nucleofected keratinocytes. Note the intensity reduction of the bands at 608 bp and 780 bp in ΔTGM1 nucleofected keratinocytes. (C and D) RT-qPCR (C) and western blot analysis (D) show ablation of both TGM1 mRNA (C, orange bars) and protein (D) in ΔTGM1 keratinocytes as compared to wild-type cells. (E) Relative TG1 enzymatic activity in growing (3-day) and over-confluent (14-day) wild-type and ΔTGM1 keratinocytes. n = 3 replicates, data are presented as mean ± SD (p < 0.0001).
Figure 4
Figure 4
SINγ-RV-TGM1 rescues TG1 expression and activity in the ΔTGM1 human cellular model (A) Representative images of TG1 immunofluorescence analysis of wild-type, ΔTGM1, and SINγ-RV-TGM1-transduced keratinocytes after 7-days cultivation. DAPI (blue) stains nuclei. Scale bars, 50 μm. (B) Optical micrographs of the isolated cornified cell envelopes in wild-type and SINγ-RV-TGM1-transduced keratinocytes. Note that typical envelopes were not detected in ΔTGM1 keratinocytes, and only a few cell fragments were observed. Scale bar, 20 μm. (C) Immunostaining detection of TG1 protein (top, green) and TG1 in situ enzymatic activity (bottom, red) in cryosections of collagen-based 3D SEs from wild-type, ΔTGM1, or SINγ-RV-TGM1-transduced keratinocytes. DAPI (blue) stains nuclei. A white dotted line marks the epidermal-dermal junction. Scale bars, 50 μm (n = 3, pictures are representative of what was observed in at least three independent samples or replicates).
Figure 5
Figure 5
ΔTGM1 3D SEs resembling LI skin hallmarks and architecture Histological analysis (H&E) and immunostaining of TG1 substrates (involucrin, LEKTI, and loricrin) and keratin 10 on 3D SEs from wild-type, ΔTGM1, or SINγ-RV-TGM1-transduced keratinocytes. DAPI (blue) stains nuclei. A dotted line marks the epidermal-dermal junction. Scale bars, 20 μm.
Figure 6
Figure 6
Single-cell multiomics analysis reveals TGM1-transduced keratinocyte stem cells (A) UMAP of scRNA-seq profiles in SINγ-RV-TGM1-transduced keratinocytes. Keratinocytes were classified in five clonogenic and differentiated populations through label transfer and mapping to a previously reported reference of human keratinocytes., Dots represent individual cells, and the colors indicate the cell populations (holoclone [H] in orange, meroclone [M] in light blue, paraclone [P] in gray, TD1 in light brown, and TD2 in brown). Feeder layer-derived fibroblasts and low-quality keratinocyte clusters (F1 and 6,7) are shown in light gray. The percentages of cells in each population are shown on the right. (B) UMAP showing SINγ-RV-TGM1-positive cells containing at least one provirus fragment (red). The color scale indicates the number of provirus fragments retrieved in each cell. Negative cells are shown in light gray. The percentages of positive cells in each population are shown on the right.

Similar articles

Cited by

References

    1. Elias P.M., Williams M.L., Crumrine D., Schmuth M. Focuses solely on generalized, inherited (Mendelian) disorders of cornification (DOC or MeDOC). Introduction. Curr. Probl. Dermatol. 2010;39:1–29. doi: 10.1159/000321082. - DOI - PubMed
    1. Oji V., Tadini G., Akiyama M., Blanchet Bardon C., Bodemer C., Bourrat E., Coudiere P., DiGiovanna J.J., Elias P., Fischer J., et al. Revised nomenclature and classification of inherited ichthyoses: results of the First Ichthyosis Consensus Conference in Soreze 2009. J. Am. Acad. Dermatol. 2010;63:607–641. - PubMed
    1. Fischer J., Bourrat E. Genetics of Inherited Ichthyoses and Related Diseases. Acta Derm. Venereol. 2020;100:adv00096. doi: 10.2340/00015555-3432. - DOI - PMC - PubMed
    1. Vahlquist A., Fischer J., Törmä H. Inherited nonsyndromic ichthyoses: an update on pathophysiology, diagnosis and treatment. Am. J. Clin. Dermatol. 2018;19:51–66. - PMC - PubMed
    1. Abernethy J.L., Hill R.L., Goldsmith L.A. epsilon-(gamma-Glutamyl) lysine cross-links in human stratum corneum. J. Biol. Chem. 1977;252:1837–1839. - PubMed