

Spatial Transcriptomic Study Reveals Heterogeneous Metabolic Adaptation and a Role of Pericentral PPARα/CAR/Ces2a Axis During Fasting in Mouse Liver
- PMID: 39234807
- PMCID: PMC11538668
- DOI: 10.1002/advs.202405240
Spatial Transcriptomic Study Reveals Heterogeneous Metabolic Adaptation and a Role of Pericentral PPARα/CAR/Ces2a Axis During Fasting in Mouse Liver
Abstract
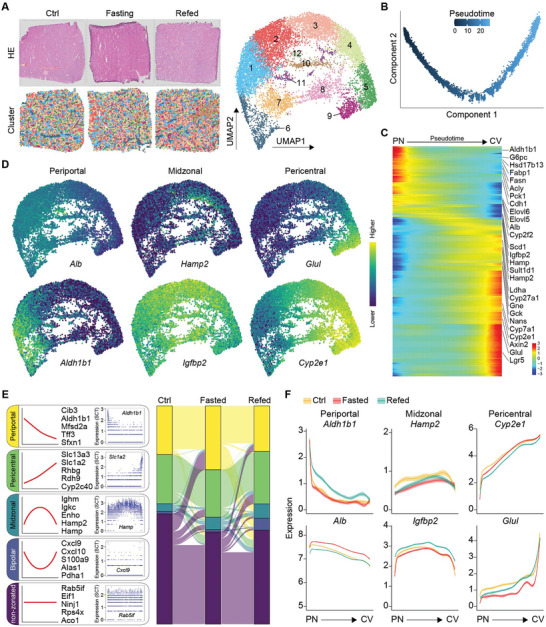
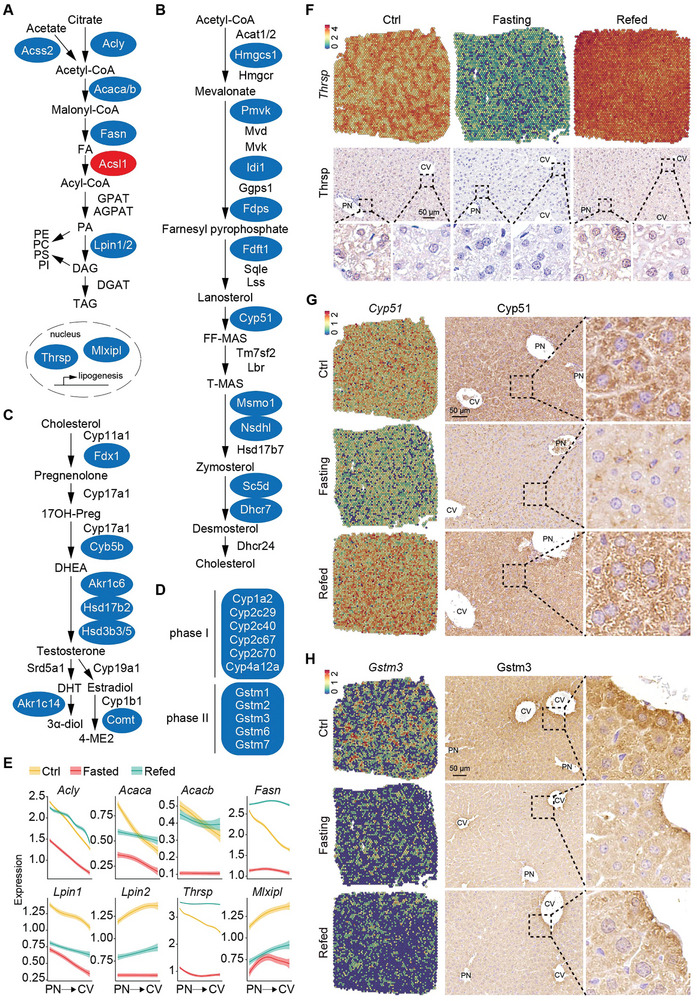
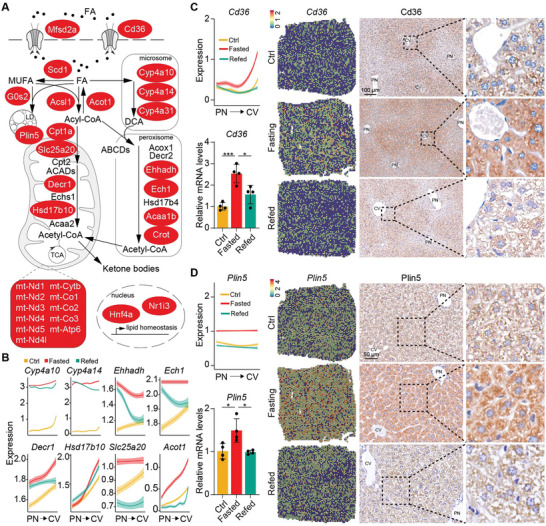
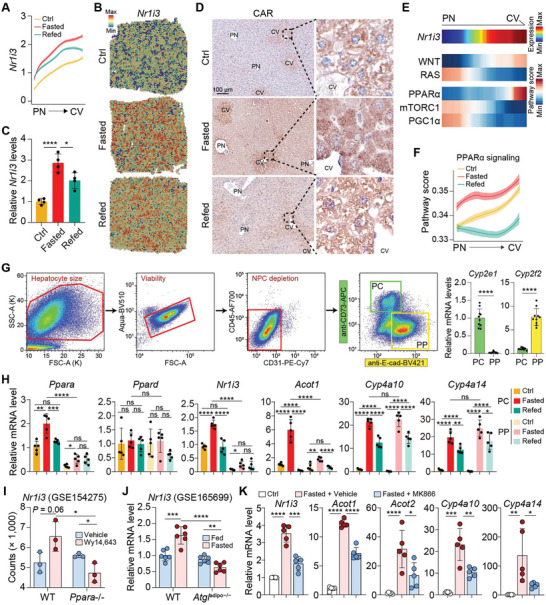
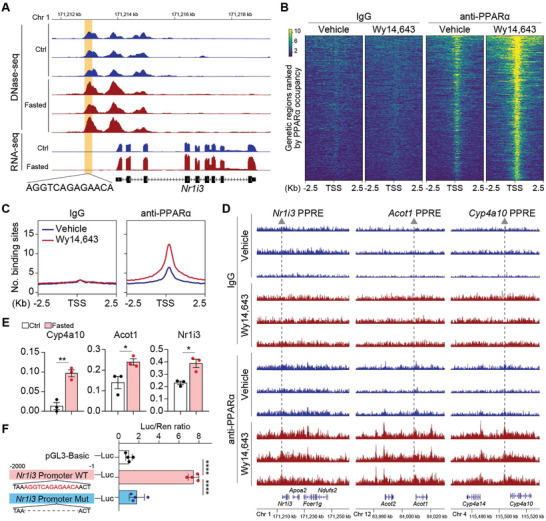
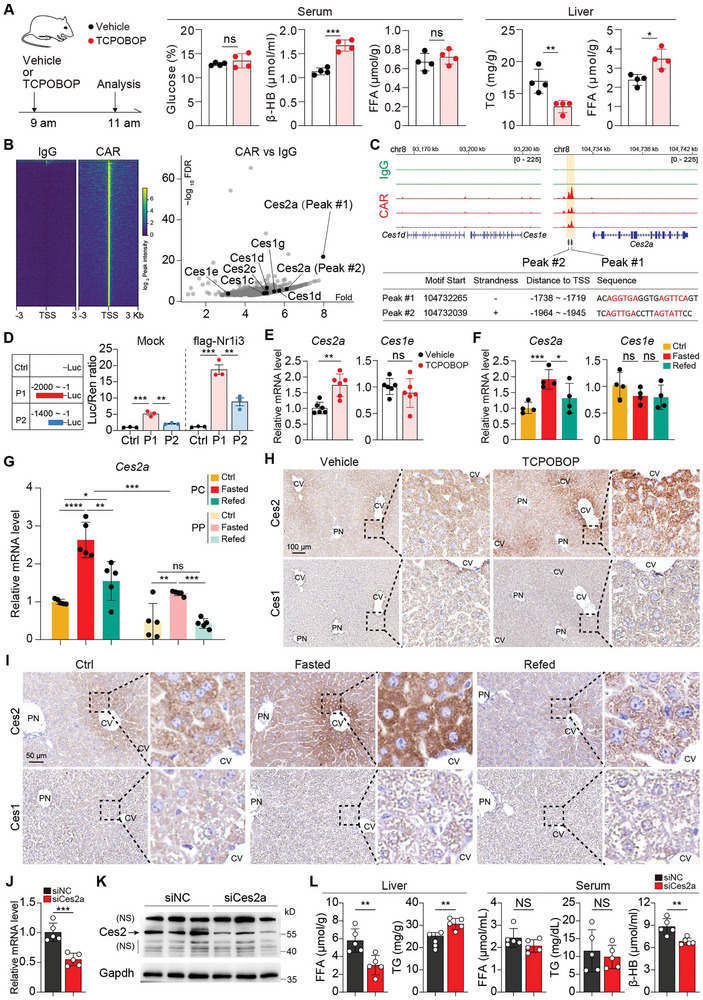
Spatial heterogeneity and plasticity of the mammalian liver are critical for systemic metabolic homeostasis in response to fluctuating nutritional conditions. Here, a spatially resolved transcriptomic landscape of mouse livers across fed, fasted and refed states using spatial transcriptomics is generated. This approach elucidated dynamic temporal-spatial gene cascades and how liver zonation-both expression levels and patterns-adapts to shifts in nutritional status. Importantly, the pericentral nuclear receptor Nr1i3 (CAR) as a pivotal regulator of triglyceride metabolism is pinpointed. It is showed that the activation of CAR in the pericentral region is transcriptionally governed by Pparα. During fasting, CAR activation enhances lipolysis by upregulating carboxylesterase 2a, playing a crucial role in maintaining triglyceride homeostasis. These findings lay the foundation for future mechanistic studies of liver metabolic heterogeneity and plasticity in response to nutritional status changes, offering insights into the zonated pathology that emerge during liver disease progression linked to nutritional imbalances.
Keywords: constitutive androstane receptor (CAR); fasting response; liver zonation; metabolic heterogeneity; peroxisome proliferator‐activated receptor alpha (Pparα); spatial transcriptomics.
© 2024 The Author(s). Advanced Science published by Wiley‐VCH GmbH.
Conflict of interest statement
The authors declare no conflict of interest.
Figures
Similar articles
-
PPARα Induces the Expression of CAR That Works as a Negative Regulator of PPARα Functions in Mouse Livers.Int J Mol Sci. 2023 Feb 16;24(4):3953. doi: 10.3390/ijms24043953. Int J Mol Sci. 2023. PMID: 36835365 Free PMC article.
-
The nuclear receptor CAR (NR1I3) regulates serum triglyceride levels under conditions of metabolic stress.J Lipid Res. 2009 Mar;50(3):439-445. doi: 10.1194/jlr.M800226-JLR200. Epub 2008 Oct 21. J Lipid Res. 2009. PMID: 18941143
-
Xenobiotic-induced hepatocyte proliferation associated with constitutive active/androstane receptor (CAR) or peroxisome proliferator-activated receptor α (PPARα) is enhanced by pregnane X receptor (PXR) activation in mice.PLoS One. 2013 Apr 23;8(4):e61802. doi: 10.1371/journal.pone.0061802. Print 2013. PLoS One. 2013. PMID: 23626729 Free PMC article.
-
The emerging role of constitutive androstane receptor and its cross talk with liver X receptors and peroxisome proliferator-activated receptor A in lipid metabolism.Vitam Horm. 2013;91:243-58. doi: 10.1016/B978-0-12-407766-9.00010-9. Vitam Horm. 2013. PMID: 23374719 Review.
-
Regulation of Liver Energy Balance by the Nuclear Receptors Farnesoid X Receptor and Peroxisome Proliferator Activated Receptor α.Dig Dis. 2017;35(3):203-209. doi: 10.1159/000450912. Epub 2017 Mar 1. Dig Dis. 2017. PMID: 28249296 Review.
References
MeSH terms
Substances
Grants and funding
- 2020YFA0804400/National Key Research and Development Program of China
- 82270621/National Natural Science Foundation of China
- 82071854/National Natural Science Foundation of China
- 32100590/National Natural Science Foundation of China
- 32270820/National Natural Science Foundation of China
- 32422024/National Natural Science Foundation of China
- 62373216/National Natural Science Foundation of China
- 82400713/National Natural Science Foundation of China
- ZR2020QH038 ZR2021QB012/Natural Science Foundation of Shandong Province
- ZR2022MH150/Natural Science Foundation of Shandong Province
- 2020QNQT003/Funds for Youth Interdisciplinary and Innovation Research Groups of Shandong University
- 2020QNQT009/Funds for Youth Interdisciplinary and Innovation Research Groups of Shandong University
- 2022JC008/Fundamental Research Funds for the Central Universities
- GYY2023QY01/Cutting Edge Development Fund of Advanced Medical Research Institute
- BX20230211/Taishan Scholars Program of Shandong Province and China Postdoctoral Science Foundation
- 2023M742123/Taishan Scholars Program of Shandong Province and China Postdoctoral Science Foundation
LinkOut - more resources
Full Text Sources
Molecular Biology Databases